Báo cáo hóa học: " Research Article Nonlinear Frequency Scaling Algorithm for High Squint Spotlight SAR Data Processing" pdf
Bạn đang xem bản rút gọn của tài liệu. Xem và tải ngay bản đầy đủ của tài liệu tại đây (935.05 KB, 8 trang )
Hindawi Publishing Corporation
EURASIP Journal on Advances in Signal Processing
Volume 2008, Article ID 657081, 8 pages
doi:10.1155/2008/657081
Research Article
Nonlinear Frequenc y Scaling Algorithm for
High Squint Spotlight SAR Data Processing
Lihua Jin and Xingzhao Liu
Department of Electronic Engineering, School of Electronic, Information, and Electrical Engineering,
Shanghai Jiao Tong University, 1-411 SEIEE Buildings, 800 Dongchuan Road, Shanghai 200240, China
Correspondence should be addressed to Xingzhao Liu,
Received 1 August 2007; Revised 27 December 2007; Accepted 12 February 2008
Recommended by A. Enis C¸etin
This paper presents a new approach for the squint-mode spotlight SAR imaging. Like the frequency scaling algorithm, this method
starts with the received signal dechirped in range. According to the geometry for the squint mode, the reference range of the
dechirping function is defined as the range between the scene center and the synthetic aperture center. In our work, the residual
video phase is compensated firstly to facilitate the following processing. Then the range-cell migration with a high-order range-
azimuth coupling form is processed by a nonlinear frequency scaling operation, which is different from the original frequency
scaling one. Due to these improvements, the algorithm can be used to process high squint SAR data with a wide swath and a high
resolution. In addition, some simulation results are given at the end of this paper to demonstrate the validity of the proposed
method.
Copyright © 2008 L. Jin and X. Liu. This is an open access article distributed under the Creative Commons Attribution License,
which permits unrestricted use, distribution, and reproduction in any medium, provided the original work is properly cited.
1. INTRODUCTION
Spotlight synthetic aperture radar (SAR) often operates in
the squint mode. Several algorithms can be used for the
squint mode spotlight SAR processing, that is, the polar
format algorithm (PFA) [1], the range migration algorithm
(RMA) [2], the chirp scaling (CS) algorithm [3], and the
frequency scaling (FS) algorithm [4], the former three of
which have been comprehensively discussed in [5]. The PFA
limits the quality of the final image because of polar-to-
rectangular interpolation and has a higher computational
burden due to two interpolations compared to the RMA
technique with one interpolation [5]. The RMA is supposed
to be squint angle independent. However, the interpolation
degrades the image at the edges for high squint angle.
Moreover, the spectrum in the range wave number direction
after the Stolt mapping requires expansion and thus increases
the computational load. Modified Stolt mapping methods
[6, 7] introduced a change of the variable range wave number
to overcome these problems.
The algorithms of CS and FS are more attractive because
they avoid interpolation and the computing burden is
reduced greatly. In the former algorithm, the range cell
migration is approximately written as a polynomial, and is
accurately corrected except the range-dependent secondary
range correction (SRC) error. However, with increasing the
squint angle, the error becomes significant and degrades the
image. In the latter algorithm, which is presented specially
for spotlight SAR data processing, the dechirped signal has
been applied to reduce the sampling frequency in range.
When processing high squint spotlight SAR data, the FS
algorithm also suffers the trouble caused by the SRC error.
Based on the CS algorithm, a nonlinear chirp scaling (NCS)
algorithm [8] has been proposed to deal with the squint
mode strip-map SAR imaging, in which the CS technique is
extended to the cubic order to achieve the effect of the range-
dependent filtering required in the SRC.
In this paper, a nonlinear frequency scaling method is
presented. Inspired by the NCS algorithm, the FS operation
has been extended to the cubic order to perform a more accu-
rate SRC. Before the nonlinear frequency scaling operation,
the dechirping function for the squint mode is defined, and
the residual video phase is compensated to remove the side
effect caused by the dechirping operation. Some simulation
results for an X-band airborne spotlight SAR in the squint
mode are given to demonstrate the validity of the proposed
2 EURASIP Journal on Advances in Signal Processing
t
a,start
Lt
a,end
lt
a
= 0
ϕ
R
c
Δθ
r
0
r
c
θ
h
t
a
r
max
r
min
p(r
0
,0)
W
a
W
r
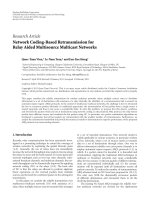
Figure 1: Squint-mode spotlight SAR geometry.
algorithm. The detailed description of the algorithm is given
in Section 2, the simulation results are presented in Section 3,
and the conclusion appears in Section 4.
2. ALGORITHM DESCRIPTION
2.1. Dechirping function and signal model
A simple geometry of airborne squint mode spotlight SAR
is shown in Figure 1,whereh is the flight altitude, θ is
the angle of view, r
c
is the distance from the center of the
scene to the flight line, r
min
and r
max
are the minimum and
maximum distance from the scene to the flight line, and R
c
is the distance between the scene center and the synthetic
aperture center. The platform moves with velocity v along
a straight line, and the radar beam is steered to spotlight
the scene center. The squint angle ϕ is defined as the angle
between the view axis of the radar at the synthetic aperture
center and the broadside direction.
At a certain azimuth time t
a
, the slant range R(t
a
; r
0
)
between the radar sensor and a point target at position (r
0
,0)
can be expressed as
R
t
a
; r
0
=
r
2
0
+
vt
a
2
1/2
. (1)
For short, R(t
a
; r
0
)iswrittenasR(t
a
) in the following text.
The received chirp signal from the target is
s
t
a
, t
e
; r
0
=
C · rect
t
e
− 2R
t
a
/c
T
p
×
rect
t
a
−
t
a,start
+ t
a,end
/2
T
spot
×
exp
−
j
4πR
t
a
λ
×
exp
jπk
e
t
e
−
2R
t
a
c
2
,
(2)
where C is constant term, t
e
is fast time, λ is the radar
wavelength, k
e
is the chirp rate, and c is the speed of light.
T
p
and T
spot
are the pulse width and the synthetic aperture
time, respectively, t
a,start
and t
a,end
are the start and the end of
t
a
,respectively.
In this paper, a dechirping operation is performed at the
receiver. The dechirping function is defined as
H
Dechirp
= exp
−
jπk
e
t
e
−
2R
c
c
2
,(3)
where the reference range is chosen as R
c
which is presented
by the solid line in Figure 1. The dechirped signal can be
described as
s
dechirp
t
a
, t
e
; r
0
=
C · rect
t
e
− 2R
t
a
/c
T
p
×
rect
t
a
−
t
a,start
+ t
a,end
/2
T
spot
×
exp
−
j
4π
λ
R
t
a
× exp
−
j
4πk
e
c
R
t
a
− R
c
t
e
−
2R
c
c
×
exp
j
4πk
e
c
2
R
t
a
−
R
c
2
.
(4)
According to the appendix of [4], the range Doppler
domain signal after the dechirping and the azimuth Fourier
transform (FT) is described as
S
0
f
a
, t
e
; r
0
=
C ·
rect
t
e
−2R
c
/c
T
p
exp
j
4πk
e
c
R
c
t
e
−
2R
c
c
×
exp
−
j
4πr
0
λ
1+
λk
e
c
t
e
−
2R
c
c
2
−
λf
a
2v
2
∗
exp
− jπk
e
t
2
e
,
(5)
where f
a
denotes the azimuth frequency, and ∗ is the con-
volution operation. For the squint mode in Figure 1, the
center of fast time t
e
becomes 2R
c
/c,andthus
λk
e
c
t
e
−
2R
c
c
≤
λk
e
c
T
p
2
=
B
2 f
c
1, (6)
where B is the bandwidth of the transmitted signal, and
f
c
is the carrier frequency. Therefore, the definition of the
dechirping function makes the phase error small enough
when the phase of the signal is expanded into the Taylor
series in the range-Doppler domain.
2.2. Preprocessing residual video phase compensation
In (5), the phase of the last exponential term is called the
residual video phase (RVP), which is a side effect of the
dechirping. The RVP term can be removed completely from
the radar signal in a preprocessing operation.
L. Jin and X. Liu 3
First, the dechirped signal is transformed into the range
frequency domain, according to (C.8) and (C.9) in the
appendix of [5], where the constant term C is omitted:
S
1
t
a
, f
e
; r
0
=
exp
−
j
4π
λ
R
t
a
×
exp
−
j
4πk
e
c
2
R
t
a
−
R
c
2
×
exp
−
j
4πR
t
a
c
f
e
×
T
p
sinc
πT
p
f
e
+
2k
e
c
R
t
a
−
R
c
,
(7)
where f
e
is the range frequency. Since F = f
e
+(2k
e
/c)[R(t
a
)−
R
c
]andexp(− jπ/k
e
· F
2
) ≈ 1 when −1/T
p
<F<1/T
p
,
therefore (7) can be simplified as
S
2
t
a
, f
e
; r
0
=
T
p
sinc
πT
p
F
exp
−
j
4π
λ
R
t
a
×
exp
−
j
4πR
c
c
f
e
exp
j
π
k
e
f
2
e
.
(8)
The last exponential term exp(jπ/k
e
· f
2
e
) in the frequency
domain expression of (8) corresponds to the RVP term in
the time domain expression of (5). Multiplied by a phase
compensation function, the RVP term can be removed in the
range frequency domain. In the domain of fast time and slow
time, the output is
S
3
t
a
, t
e
; r
0
=
rect
t
e
− 2R
c
/c
T
p
exp
−
j
4π
λ
R
t
a
×
exp
−
j
4πk
e
c
R
t
a
−
R
c
t
e
−
2R
c
c
.
(9)
2.3. Nonlinear frequency scaling algorithm
Transforming (9) by the principle of stationary phase [9]
for the azimuth Fourier transformation, we can obtain the
range-Doppler domain expression similar to (5), that is,
S
4
f
a
, t
e
; r
0
=
rect
t
e
− 2R
c
/c
T
p
exp
j
4πk
e
c
R
c
t
e
−
2R
c
c
×
exp
−
j
4πr
0
λ
1+
λk
e
c
t
e
−
2R
c
c
2
−
λf
a
2v
2
.
(10)
After a Taylor series expansion of the square root
expression in (10), the signal is written as
S
4
f
a
, t
e
; r
0
=
rect[·]exp
−
j
4πr
0
β
λ
×
exp
−
j
4πk
e
c
r
0
β
− R
c
t
e
−
2R
c
c
×
exp
−
j
π
K
m
t
e
−
2R
c
c
2
×
exp
jφ
3
t
e
−
2R
c
c
3
.
(11)
Generally, the quartic and the higher-order errors can be
neglected even in the case of a large squint angle. In (11),
β
f
a
=
1 −
λ
f
a
+ f
dc
2v
2
,
K
m
=
c
2
β
3
2λk
2
e
β
2
− 1
r
0
= K
mref
+ K
s
· Δ f ,
K
mref
=
c
2
β
3
2λk
2
e
β
2
− 1
r
c
,
K
s
=
c
3
β
4
4λk
3
e
β
2
− 1
r
2
c
,
Δ f
=−
2k
e
cβ
r
0
− r
c
,
φ
3
=
2πλ
2
k
3
e
r
0
c
3
β
2
− 1
β
5
.
(12)
In (12), f
dc
is Doppler centroid, K
m
is written as the sum
of a constant term and a linear term. In [4], the original FS
operation scales the range frequency by 1/β, that is, the main
part of the phase in (11) is scaled as
−
4πk
e
cβ
r
0
− R
c
β
t
e
β −
2R
c
c
−
π
K
m
t
e
β −
2R
c
c
2
+ ··· .
(13)
The secondary range compression and the bulk range shift
are performed by
+
4πk
e
cβ
r
c
− R
c
β
t
e
β −
2R
c
c
+
π
K
mref
t
e
β −
2R
c
c
2
−··· .
(14)
Obviously, the phase compensation of the FS algorithm is
completed only for the second exponential term in (11). The
quadraticandthecubicexponentialtermsin(11)aredefined
to be src( f
a
, t
e
; r
0
) which is referred to as the secondary range
compression term in [4], and are compensated by src(r
ref
)
∗
in the FS algorithm, where r
c
is chosen as the reference range
r
ref
. However, in the case of a large squint angle and a large
scene, the error from approximation r
0
≈ r
ref
(K
m
≈ K
mref
)
cannot be neglected any longer, and the phase error caused
by the incompletely matched src(r
ref
)
∗
distorts the image
severely.
The quadratic and cubic phases ϕ
2
=−(π/K
m
)(t
e
−
2R
c
/c)
2
, ϕ
3
= φ
3
(t
e
− 2R
c
/c)
3
are the function of azimuth
frequency f
a
,rangetimet
e
, and the target range. The
4 EURASIP Journal on Advances in Signal Processing
4096
Range time (sample)
−300
−200
−100
0
100
200
300
Quadratic phase error(rad)
(a)
4096
Range time (sample)
−300
−200
−100
0
100
200
300
Quadratic phase error(rad)
(b)
4096
Range time (sample)
−300
−200
−100
0
100
200
300
Quadratic phase error(rad)
(c)
40960
Range time (sample)
r
c
r
min
r
max
−20
−10
0
10
20
Cubic phase error(rad)
(d)
40960
Range time (sample)
r
c
r
min
r
max
−20
−10
0
10
20
Cubic phase error(rad)
(e)
40960
Range time (sample)
r
c
r
min
r
max
−20
−10
0
10
20
Cubic phase error(rad)
(f)
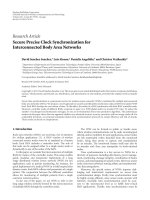
Figure 2: (a), (b), and (c) present the quadratic phase error ϕ
2
− ϕ
2
(r
c
)inthecaseofβ(−PRF/2) = 0.5394, β(0) = 0.5, and β(PRF/2) =
0.4559, respectively. (d), (e), and (f) present the cubic phase error ϕ
3
− ϕ
3
(r
c
) at three different β values 0.5394, 0.5, and 0.4559.
following simulation result presents the quadratic and cubic
phaseerrorfor60degreesquintanglewithparticular
parameters listed in Section 3.
The quadratic phase error shown in Figure 2 is too large
to make the image focused. Therefore, the quadratic phase
error has to be compensated. However, the cubic phase error
is acceptable if compared with the quadratic phase error.
A nonlinear method [8] has been used to solve this
problem caused by the approximation error, where the
coefficient of the quadratic term is also scaled to be range
independent. In the proposed algorithm, the main part of
phase in (11) after the nonlinear FS can be written as
−
4πk
e
cβ
r
0
− R
c
β
t
e
β −
2R
c
c
−
π
K
mref
β
t
e
β −
2R
c
c
2
+···.
(15)
Though (11) is not a strict chirp signal, if the cubic
term is small enough, it is possible to apply the principle of
stationary phase to obtain its FT. The fundamental FT pair in
the nonlinear operation can be described as
exp
−
j
π
k
t
2
exp
−
j
2π
3
yt
3
⇐⇒
exp
jπk f
2
exp
j
2π
3
yk
3
f
3
,
(16)
where the coefficient y should satisfy
|y|1/|4k
2
f |.The
derivation is given in Appendix A.
2.4. Phase compensation functions
The block diagram of the nonlinear FS algorithm is shown
in Figure 3. The signal at the stage of the dashed line box
below in Figure 3 corresponds to (11). In order to accurately
compensate the quadratic term and minimize the errors
L. Jin and X. Liu 5
Dechirped SAR signal
Range FFT
Preprocessing
Range IFFT
Azimuth FFT
Range FFT
Range IFFT
Range FFT
Azimuth IFFT
Processed image
S
1
exp(− j
π
k
e
f
2
e
)
S
3
S
4
S
5
S
6
S
7
S
8
S
9
Cubic phase function H
cubic
Frequency scaling function H
FS
Matched filter function H
MF
Azimuth filter function H
AF
Figure 3: Block diagram of the nonlinear frequency scaling
algorithm.
from higher-order terms, a small-phase filter function is
multiplied before the FS operation, that is,
H
cubic
= exp
−
j
2π
3
Y
m
+
3
2π
φ
r
ref
t
e
−
2R
c
c
3
,
(17)
where Y
m
= K
s
(1/β − 0.5)/K
3
mref
(1/β − 1). The derivation of
Y
m
is given in Appendix B. The output of the cubic filter is
approximately written as
S
5
f
a
, t
e
; r
0
=
S
4
f
a
, t
e
; r
0
·
H
cubic
= rect[·]exp
−
j
4πr
0
β
λ
×
exp
−
j
4πk
e
c
r
0
β
− R
c
t
e
−
2R
c
c
× exp
−
j
π
K
m
t
e
−
2R
c
c
2
×
exp
−
j
2π
3
Y
m
t
e
−
2R
c
c
3
.
(18)
According to (16), we can write the expression after the range
FT as
S
6
f
a
, f
e
; r
0
=
exp
−
j
4πr
0
λ
β
×
exp
−
j
4πR
c
c
f
e
− f
d
×
exp
jπK
m
f
e
− f
d
2
×
exp
j
2π
3
Y
m
K
3
m
f
e
− f
d
3
,
(19)
where
f
d
=−
2k
e
c
r
0
β
− R
c
=
2k
e
c
R
c
−
r
c
β
+
2k
e
cβ
r
c
− r
0
=
f
ref
+ Δ f , f
ref
=
2k
e
c
R
c
−
r
c
β
,
(20)
where f
d
is the counterpart of the scatterer trajectory τ
d
mentioned in the NCS algorithm [8]. The frequency f
d
is
moved to the desired trajectory f
s
= f
ref
+ β · Δ f after the
nonlinear FS operation, and thus the range migration can be
corrected.
The frequency scaling function is extended to the cubic
order such that the coefficient of the quadratic term is scaled
as a range-independent one, that is,
H
FS
= exp
j
4πR
c
c
1 −
1
β
f
e
− f
ref
×
exp
jπq
2
f
e
− f
ref
2
×
exp
j
2π
3
q
3
f
e
− f
ref
3
,
(21)
where q
2
= K
mref
(1/β − 1),q
3
= K
s
(1/β − 1)/2.
Multiplied by H
FS
, the signal becomes as follows:
S
7
f
a
, f
e
; r
0
=
S
6
f
a
, f
e
; r
0
·
H
FS
= exp
−
j
4πr
0
λ
β
exp
−
j
4πR
c
cβ
f
e
− f
s
×
exp
jπ
K
ref
β
f
e
− f
s
2
×
exp
j
2π
3
K
s
2β(1 − β)
f
e
− f
s
3
exp
jφ
Δ
.
(22)
The derivation of (22) and the definition of φ
Δ
are also given
in Appendix B. According to (16), the signal after the inverse
FT in range can be expressed as
S
8
f
a
, t
e
; r
0
= exp
−
j
4πr
0
λ
β
exp
j2πf
s
t
e
−
2R
c
cβ
×
exp
−
j
πβ
K
mref
t
e
−
2R
c
cβ
2
×
exp
−
j
π
3
K
s
β
2
K
3
mref
(1 − β)
t
e
−
2R
c
cβ
3
×
exp
jφ
Δ
.
(23)
6 EURASIP Journal on Advances in Signal Processing
Table 1: System parameters for an airborne X-band SAR.
Wavelength Alti tude h Slant range R
c
Ve l o c i t y v Ground resolution Scene size
0.03 m 4 Km 60 Km 200 m/s 1 m × 1m 1Km× 1Km
58.438.518.6−1.3
Azimuth (m)
58037
58015.6
57994.1
57972.7
Range (m)
(a)
40.420.50.6−19.3
Azimuth (m)
57977.4
57956
57934.5
57913.1
Range (m)
(b)
4020.10.2−19.7
Azimuth (m)
57976.6
57955.1
57933.7
57912.2
Range (m)
(c)
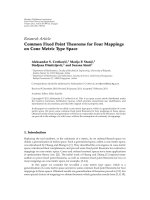
Figure 4: Contour plots of point target by different algorithms (squint angle ϕ = 15
◦
). (a) Processed by the FS algorithm [4]. (b) Processed
by the FS algorithm with the dechirping function given in this paper. (c) Processed by the nonlinear FS algorithm.
After the multiplication by the frequency scaling function
H
FS
and the inverse FT in range, the secondary range
compression and the bulk range cell migration correction
(RCMC) can be performed using the range-matched filter
function. The range-matched filter function is given by
H
MF
= exp
−
j2πf
ref
t
e
−
2R
c
cβ
×
exp
j
πβ
K
mref
t
e
−
2R
c
cβ
2
×
exp
j
πK
s
β
2
3K
3
mref
(1 − β)
t
e
−
2R
c
cβ
3
.
(24)
After the range-matched filtering and the range FT, the signal
is focused in range, that is,
S
9
f
a
, f
e
; r
0
=
exp
−
j
4πr
0
λ
β
sinc
f
e
+
2k
e
c
r
0
− r
c
×
exp
−
j2π
2R
c
cβ
f
e
exp
jφ
Δ
.
(25)
Finally, a focused image can be obtained by the azimuth
filtering and the azimuth inverse FT. The azimuth filter
function is given as follows:
H
AF
= exp
−
j
4πr
0
λ
(1
− β)
exp
−
jφ
Δ
exp
j2π
2R
c
cβ
f
e
.
(26)
Shifting the range spectrum to make f
ref
= 0 before the
frequency scaling operation will simplify the expressions of
H
FS
, H
MF
,andH
AF
.
3. SIMULATION RESULTS
In order to evaluate the proposed algorithm, some simula-
tions for an airborne spotlight SAR in the squint mode have
been performed. The system parameters are given in Tab le 1 .
First, the results obtained by using the FS algorithm [4],
the FS algorithm with the dechirping function given in this
paper and the proposed algorithm, have been compared.
The squint angle is defined as 15 degree. The echo of a
point target at the center of the scene is simulated and
the contour plots by the three algorithms are shown in
Figure 4.FromFigure 4, the contour of point target by
the FS algorithm [4] is defocused so severe that the target
cannot be identified; the image by the FS algorithm with
the dechirping function given in this paper is acceptable,
however, its main lobe is broadened and represents a small
position shift; as expectation the image processed by the
proposed algorithm shows excellent focus performance and
the range and azimuth peak position all agree with the
theoretical values.
Another simulation under the same system parameters
with the squint angle ϕ
= 60
◦
is implemented. The distance
from the center of the scene to the flight path r
c
is 30 km,
the synthetic aperture L is 1800 m, the signal bandwidth is
L. Jin and X. Liu 7
5000−500
Azimuth (m)
30495.61
30000
29504.54
Range (m)
Figure 5: Contour plot of targets (squint angle ϕ = 60
◦
), where the
image of each target has been zoomed and then pasted back into
original figure according to its location.
151.35 MHz, the pulse width is 20 microseconds, and the
PRF is 640 Hz. Nine typical point targets are arranged in the
scene. Their range coordinates are r
max
, r
c
,andr
min
, and their
azimuth coordinates are
−500 m, 0, and 500 m, respectively.
The Doppler centroid is not zero, and thus the azimuth
spectrum should be shifted before being transformed into
the range-Doppler domain. The contour plot of the nine
targets is shown in Figure 5. The simulation results show that
the nonlinear frequency scaling method is also effective even
in the squint angle up to 60 degree, which can obtain images
with high quality even at the edges of a large scene.
4. CONCLUSION
In this paper, we present a squint mode spotlight SAR
processing scheme. With the phase error correction, a
complete processing flow for the squint mode spotlight
SAR is proposed. First, a dechirping function for the squint
mode is given. Then a preprocessing step is introduced to
remove the RVP. Finally, the nonlinear approach and the
frequency scaling operation are combined to minimize the
approximation error of the SRC. The simulation results show
that the proposed algorithm is quite effective in the case of
high squint angle and large scene. In addition, only the FT
and multiplication operations are required in this algorithm.
APPENDICES
A. DERIVATION OF FOURIER TRANSFORMS PAIR
FOR A NONLINEAR CHIRP SIGNAL
Consider a signal
x(t)
= exp
−
j
π
k
t
2
exp
−
j
2π
3
yt
3
,(A.1)
we can use the principle of stationary phase to obtain its FT.
The integral phase can be written as follows:
φ(t)
=−
π
k
t
2
−
2π
3
yt
3
− 2πft. (A.2)
According to the principle, the stationary points that make
the most contributions satisfy the following:
d
dt
φ(t)
=−
2π
k
t
− 2πyt
2
− 2πf = 0. (A.3)
Thesolutiontothisequationis
t
=
−
1 ±
1 − 4 fk
2
y
2ky
, when
|y|
1
4k
2
f
, t ≈−kf.
(A.4)
Substituting the solution into the integral phase expression,
we can obtain the phase of the FT, that is,
φ( f )
= πk f
2
+
2π
3
yk
3
f
3
. (A.5)
As a result, we can obtain the FT pair in (16).
B. DERIVATION OF THE NONLINEAR FREQUENCY
SCALING FUNCTION
In this section, the derivation of variables q
2
, q
3
, Y
m
, φ
Δ
is
presented. Here, (19)and(21) are rewritten as (B.1)and
(B.2) as follows:
S
6
f
a
, f
e
; r
0
=
exp
−
j
4πr
0
λ
β
exp
−
j
4πR
c
c
f
e
− f
d
×
exp
jπK
m
f
e
− f
d
2
×
exp
j
2π
3
Y
m
K
3
m
f
e
− f
d
3
,
(B.1)
H
FS
= exp
j
4πR
c
c
1 −
1
β
f
e
− f
ref
×
exp
jπq
2
f
e
− f
ref
2
×
exp
j
2π
3
q
3
f
e
− f
ref
3
.
(B.2)
Multiplied (B.1)by(B.2), that is, S
6
∗
H
FS
, the quadratic
and the cubic terms of the phase expression can be written as
apolynomialoff
e
− f
s
, where constant π is neglected:
K
m
f
e
− f
d
2
+
2
3
Y
m
K
3
m
f
e
− f
d
3
+q
2
f
e
− f
ref
2
+
2
3
q
3
f
e
− f
ref
3
= C
3
f
e
− f
s
3
+ C
2
f
e
− f
s
2
+ C
1
f
e
− f
s
+ C
0
,
(B.3)
where the relationships f
d
= f
ref
+ Δ f , f
s
= f
ref
+ β · Δ f have
been applied and the polynomial coefficients of f
e
− f
s
can be
calculated as
C
3
=
2
3
Y
m
K
3
m
+ q
3
,
C
2
= 2
Y
m
K
3
m
+ q
3
βΔ f +
K
m
+ q
2
− 2Y
m
K
3
m
Δ f
,
C
1
= 2
Y
m
K
3
m
+ q
3
β
2
Δ f
2
+2
K
m
+ q
2
− 2Y
m
K
3
m
Δ f
βΔ f
+
2Y
m
K
3
m
Δ f
2
− 2K
m
Δ f
.
(B.4)
8 EURASIP Journal on Advances in Signal Processing
In (B.4), unknown variables q
2
, q
3
,andY
m
are used to make
that C
1
, C
2
,andC
3
are independent of Δ f . Expanding C
1
,
C
2
,andC
3
into polynomials of Δ f = (2k
e
/cβ)(r
c
− r
0
)and
substituting the expression of K
m
= K
mref
+K
s
·Δ f , therefore,
the coefficient of the cubic term is as follows:
C
3
=
2
3
Y
m
K
3
mref
+ q
3
+2Y
m
K
2
mref
K
s
Δ f
+2Y
m
K
mref
K
2
s
Δ f
2
+
2
3
Y
m
K
3
s
Δ f
3
,
(B.5)
and the coefficient of the quadratic term
C
2
= K
mref
+ q
2
+
K
s
+2q
3
β +2Y
m
K
3
mref
(β − 1)
Δ f
+6Y
m
K
2
mref
K
s
(β − 1)Δ f
2
+ ··· ,
(B.6)
and the coefficient of the linear term
C
1
=
2K
mref
(β − 1) + 2q
2
β
Δ f
+
2Y
m
K
3
mref
(β − 1)
2
+2q
3
β
2
+2K
s
(β − 1)
Δ f
2
+6Y
m
K
2
mref
K
s
(β − 1)
2
Δ f
3
+ ··· .
(B.7)
In order to compensate src term exactly, the coefficients
of Δ f in (B.5), (B.6), and (B.7) are preferred to be zero.
However, the case of Y
m
= 0 is meaningless, thus, the
following equations hold:
K
s
+2q
3
β +2Y
m
K
3
mref
(β − 1) = 0,
2K
mref
(β − 1) + 2q
2
β = 0,
2Y
m
K
3
mref
(β − 1)
2
+2q
3
β
2
+2K
s
(β − 1) = 0.
(B.8)
Solving the linear equations, we obtain
q
2
= K
mref
1
β − 1
, q
3
=
K
s
(1/β − 1)
2
,
Y
m
=
K
s
(1/β − 0.5)
K
3
mref
(1/β − 1)
.
(B.9)
By ignoring higher-order terms of Δ f in the coefficients of
f
e
− f
s
,(B.3) is approximated as follows:
2
3
Y
m
K
3
mref
+ q
3
f
e
− f
s
3
+
K
mref
+ q
2
f
e
− f
s
2
+ ···
=
A
f
e
− f
s
2
+
2
3
BA
3
f
e
− f
s
3
+ φ
Δ
,
(B.10)
where
A
=
1
β
K
mref
,
BA
3
=
K
s
2β(1 −β)
,
φ
Δ
=
−
2
3
Y
m
K
3
s
Δ f
6
+
−2Y
m
K
mref
K
2
s
−2Y
m
K
3
s
f
ref
Δ f
5
+
−2Y
m
K
2
mref
K
2
s
−6Y
m
K
mref
K
2
s
f
ref
−2Y
m
K
3
s
f
2
ref
Δ f
4
+
K
s
3
(1
− β) − 6Y
m
K
2
mref
K
s
f
ref
− 6Y
m
K
mref
K
2
s
f
2
ref
−
2
3
Y
m
K
3
s
f
3
ref
Δ f
3
+
K
mref
(1 − β) − 6Y
m
K
2
mref
K
s
f
2
ref
−2Y
m
K
mref
K
2
s
f
3
ref
Δ f
2
+
−2Y
m
K
2
mref
K
s
f
ref
Δ f.
(B.11)
REFERENCES
[1] M. Soumekh, Synthetic Aperture Radar Signal Processing with
MATLAB Algorithms, John Wiley & Sons, New York, NY, USA,
1999.
[2] C. Cafforio, C. Prati, and F. Rocca, “SAR data focusing using
seismic migration techniques,” IEEE Transactions on Aerospace
and Electronic Systems, vol. 27, no. 2, pp. 194–207, 1991.
[3] R. K. Raney, H. Runge, R. Bamler, I. G. Cumming, and F. H.
Wong, “Precision SAR processing using chirp scaling,” IEEE
Transactions on Geoscience and Remote Sensing,vol.32,no.4,
pp. 786–799, 1994.
[4]J.Mittermayer,A.Moreira,andO.Loffeld, “Spotlight SAR
data processing using the frequency scaling algorithm,” IEEE
Transactions on Geoscience and Remote Sensing,vol.37,no.5,
part 1, pp. 2198–2214, 1999.
[5]G.Carrara,R.S.Goodman,andR.M.Majewski,Spotlight
Synthetic Aperture Radar, Artech House, Norwood, Mass, USA,
1995.
[6] A. Reigber, E. Alivizatos, A. Potsis, and A. Moreira, “Extended
wavenumber-domain synthetic aperture radar focusing with
integrated motion compensation,” IEE Proceedings: Radar,
Sonar and Navigation, vol. 153, no. 3, pp. 301–310, 2006.
[7] M. Vandewal, R. Speck, and H. S
¨
uß, “Efficient and precise
processing for squinted spotlight SAR through a modified stolt
mapping,” EURASIP Journal on Advances in Signal Processing,
vol. 2007, Article ID 59704, 7 pages, 2007.
[8] G. W. Davidson, I. G. Cumming, and M. R. Ito, “A chirp
scaling approach for processing squint mode SAR data,” IEEE
Transactions on Aerospace and Electronic Systems, vol. 32, no. 1,
pp. 121–133, 1996.
[9]J.C.CurlanderandR.N.McDonough,Synthetic Aperture
Radar: Systems and Signal Processing, John Wiley & Sons, New
York, NY, USA, 1991.