Báo cáo hóa học: " Research Article New Method to Determine the Range of DVB-H Networks and the Influence of MPE-FEC Rate and Modulation Scheme" doc
Bạn đang xem bản rút gọn của tài liệu. Xem và tải ngay bản đầy đủ của tài liệu tại đây (4.87 MB, 10 trang )
Hindawi Publishing Corporation
EURASIP Journal on Wireless Communications and Networking
Volume 2009, Article ID 524163, 10 pages
doi:10.1155/2009/524163
Research Article
New Method to Determine the Range of DVB-H Networks and
the Influence of MPE-FEC Rate and Modulation Scheme
David Plets,
1
Wout Joseph,
1
Leen Verloock,
1
Emmeric Tanghe,
1
Luc Martens,
1
Hugo Gauderis,
2
and Etienne Deventer
2
1
IBBT, Department of Information Technology, Ghent University, Gaston Crommenlaan 8 Box 201, 9050 Ghent, Belgium
2
VRT-medialab, Flemish Radio and Television Network (VRT), Auguste Reyerslaan 52, 1043 Brussel, Belgium
Correspondence should be addressed to David Plets,
Received 30 September 2008; Revised 28 January 2009; Accepted 18 March 2009
Recommended by Alagan Anpalagan
DVB-H networks allow high data rate broadcast access for hand-held terminals. A new method to determine the range of good
reception quality of such a DVB-H network will be investigated in this paper. To this end, a new subjective criterion is proposed,
based on the viewing experience of the users. This criterion is related to the percentage of valid reception. A comparison with
existing criteria, based on measured signal strengths, is also made. The ranges are determined for mobile reception inside a car. The
influence of the MPE-FEC rate and the modulation scheme on the range is also investigated, enabling wireless telecom operators
to select optimal settings for future networks.
Copyright © 2009 David Plets et al. This is an open access article distributed under the Creative Commons Attribution License,
which permits unrestricted use, distribution, and reproduction in any medium, provided the original work is properly cited.
1. Introduction
The digital broadcasting standard Digital Video
Broadcasting-Handheld (DVB-H) enables a high data
rate broadcast access for hand-held terminals (e.g., portable,
pocket-size, battery-operated phones). It is based on the
specifications and guidelines of ETSI [1–4]. The broadband
downstream channel features a useful data rate of up
to several Mbps and may be used for audio and video
streaming applications, file downloads, and many other
kinds of services. The standard uses a Coded Orthogonal
Frequency Division Multiplexing (COFDM) modulation
scheme and builds on Digital Video Broadcasting-Terrestrial
(DVB-T) [2]; but is adapted for hand-held devices; it
introduces time-slicing to reduce power consumption and
includes the possibility to use Multiprotocol Encapsulation-
Forward Error Correction (MPE-FEC) at the link layer to
improve the performance for mobile reception.
Only very limited data about the calculation of the range
of DVB-H systems is available. In [3–7], performance of
DVB-H systems is evaluated. A subjective criterion for good
viewing reception has also been developed in [8] for Digital
Multimedia Broadcasting (DMB). In [9], the performance
degradation of OFDM signals due to Doppler spreading in
mobile radio applications such as 802.11a and DVB systems
is investigated. In [10], a fast prediction method of the
coverage area on the uplink of a UMTS network cell is
presented by computation of the other cell interferences. The
impact on attainable range for an added mobile broadband
access element is investigated for systems beyond IMT-
2000 in [11, 12]; UMTS cell ranges are calculated based on
simulations results. In [13], the influence of different MPE-
FEC rates and modulation schemes on the performance
of a DVB-H network is analyzed for different reception
conditions. In [14], an optimal transmission scheme is
proposed for a specific network, maximizing the range
for a certain throughput requirement, based on technical
trial results. In [15], the benefit and effectiveness of Cyclic
Delay Diversity (CDD) in DVB-H networks are investigated
through coverage simulations.
The objective of this paper is to investigate the “range”
of a DVB-H system. A new method for range calculation
is presented, enabling a fast yet accurate prediction of the
range of a DVB-H network. The range will be defined as the
largest distance from a transmitter, where “good” reception is
possible. With “good” reception, we mean a valid reception
2 EURASIP Journal on Wireless Communications and Networking
percentage of at least 95%. This means that the viewer
receives valid images on his handheld during at least 95% of
the considered time span. In [3], it is stated that a period
of 20 seconds during which 5% of the MPE tables or less
are erroneous will correspond to a valid reception. In [4],
it is stated that it has been agreed that 5% MFER is used
to mark the degradation point of the DVB-H service. This
corresponds well with our criterion, since we also demand
valid MPE tables for 95% of the time. Only, we will use a
period of 40 seconds for reasons explained in the paper. The
influence of the MPE-FEC rate and the modulation scheme
on the range will be analyzed, and a comparison with the
existing criteria will be made.
In this paper we investigate the range of a DVB-H
system in a suburban environment in Ghent, Belgium. A
new subjective criterion to determine the range of a DVB-
H system is proposed, based on the viewing experience
of the users. It makes use of a new quality criterion,
percentage valid reception, which is based on the lock
percentage (percentage of the time that the receiver is able to
receive frames), and the percentage of correct, corrected, and
incorrect tables. Also a second criterion, based on the mea-
sured carrier to interference-plus-noise ratio (CINR) and
electric-field (E) values along the route, is investigated. The
presented methodology can be used to assess the reception
quality in wireless DVB-T/H networks. This paper will
enable future DVB-H trials and roll-outs to select optimal
settings and to define a region, where good reception will be
possible.
The presented procedure to calculate the range of a
DVB-H network can be used in other networks and for other
frequencies, since the proposed method is independent of the
terrain characteristics and the frequency. Compared to meth-
ods based on path loss measurements, the procedure has
several advantages, for example, the possibility for terrain-
dependent ranges or the lowered effort to obtain results
that are yet reliable. The presented analysis in this paper
could be applied in broadband wireless communications or
multimedia communications over wireless.
The outline of the paper is as follows: the transmitting
network, the measurement method, and the parameters used
to calculate the range are described in Section 2. Also the
procedure to calculate the range and the investigated schemes
is described in this section. Section 3 presents the results
for the different range definitions and the different MPE-
FEC rates and modulation schemes. Section 4 discusses other
work related to this paper, and finally, the conclusions are
presented in Section 5.
2. Method
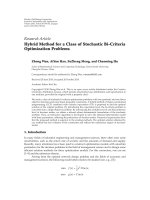
2.1. Transmitting Network. The transmitting network is
located in a suburban environment in Ghent, Belgium. The
single-frequency network (SFN) contains three base station
(BS) antennas. The center frequency is 602 MHz, and the
bandwidth is 8 MHz. Time synchronization is achieved by
Meinberg GPS receivers with a 10-MHz clock. The absolute
accuracy is 1 microsecond. The 10-MHz clock is also used
5
0
(km)
North
West
East
BS3
BS2
BS1
ITx
South
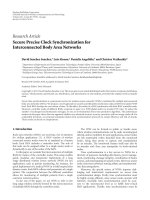
Figure 1: Map of Ghent with the three transmitting DVB-H
antennas, the “imaginary transmitter” ITx, and the routes (in red)
used to determine the range.
to synchronize the transmitting frequency of the different
transmitters in the SFN. In the network no static delay is
used, that is, all transmitters transmit at the same time. The
locations of the transmitting base stations (Tx) are a tower
at the Rooigemlaan-Groendreef (Bemilcom mast, BS1), a
building at the Keizer Karelstraat (Belgacom building, BS2),
and a building of Ghent University at the Ledeganckstraat
(Ledeganck building, BS3). Figure 1 shows a map of Ghent
with the location of the three base stations marked with black
dots. All transmitting antennas are omnidirectional and
vertically polarized. The heights of these Tx are h
Tx
= 57 m,
h
Tx
= 64 m, and h
Tx
= 63 m, respectively. The Equivalent
Isotropically Radiated Power (EIRP) used for these Tx is
36.62 dBW, 39.93 dBW, and 40.90 dBW, respectively. The
measurement environment in Figure 1 islocatedinaflat
terrain, without hills or mountains.
2.2. Measurement Method. The measurements are per-
formed with a DVB-H tool implemented on a PCMCIA card
with a small receiver antenna [6, 7, 13]. The antenna is a
Pulse DVB-H 470–750 MHz Planar PWB (planar printed
wire board) antenna with the following dimensions: length
of 50.5 mm, width of 10.5 mm, thickness of 3.0 mm. The gain
of the system is
−5 dBi. The connector is of type MMCX.
The PCMCIA card is plugged into a laptop, which is used to
collect and process the measurements later.
Every 0.5 second, a sample is recorded, while the receiver
is either locked or unlocked, depending on the signal
strength. A locked receiver can receive DVB-H frames,
which are either correct or incorrect. Incorrect tables can
EURASIP Journal on Wireless Communications and Networking 3
(sometimes) be corrected by the MPE-FEC code. The tool
logs parameters as CINR, Frame Error Rate (FER), Multipro-
tocol Encapsulation FER (MFER), and electric-field strength.
MFER is the ratio of the number of residual erroneous frames
(i.e., not recoverable) and the number of received frames
[3]. FER is the ratio of the number of erroneous frames
before MPE-FEC correction and the number of received
frames [3]. Location and speed are recorded with a GPS
device. To measure the electric-field value [dBμV/m], the
Automatic Gain Control (AGC) value is used. This AGC
value corresponds with a certain received power P
r
[dBm].
From P
r
, the electric field E [dBμV/m] can be calculated as
described in [16, 17].
During the measurements, the video channel “
´
e
´
en” of
VRT (Flemish Radio and Television network) is monitored.
All investigated modulation schemes (see Section 2.5)are
broadcast in frames with 768 rows, except for 16-QAM 1/2,
MPE-FEC 7/8 with 512 rows. Using the right packet iden-
tifier, the receiver can stream a channel of the transmitted
DVB-H signal. By opening a session description protocol
(sdp) file, we can monitor the channel on the laptop with
a media player. The observation of the visual and auditive
reception quality is related to %Valid reception, defined in
Section 2.3. The analysis in this paper will be performed
for mobile reception at a height of 1.5 m inside a small
van, driving around at a speed of 20 km/h. The reason to
select this reception is because firstly, mobile reception is an
important scenario for future (DVB-H and other network)
deployments [9], secondly, because this low speed is allowed
at all locations (speed limits in the city center are sometimes
as low as 30 km/h in Belgium), and thirdly, because 20 km/h
is low enough to obtain enough samples for the analysis (see
Section 2.4).
2.3. Parameters Used to Analyze Performance. This paragraph
defines the parameters used to analyze the range of the
DVB-H system. First, MpegLock and MpegDataLock are
explained. Next, parameters corresponding with MPE tables
and signal quality, and finally, parameters related to the range
are explained.
(i) Basic Definitions
(1) MpegLock: if MpegLock is “on,” the transport
stream (TS) synchonization is achieved;
(2) MpegDataLock: if MpegDataLock is “on,” the
TS synchonization is achieved and the TS
packet is valid.
(ii) Parameters Corresponding with MPE Tables
(1) %Lock: the percentage of the time that the
logged parameters MpegLock and MpegDat-
aLock are both “on.” When both are “on,” it is
possible to receive tables;
(2) %Incorrect tables
= MFER;
(3) %Valid reception: the percentage of the time
that the receiver is locked and receives either
correct, or corrected tables
=
100 −
%Not locked +
%Lock × %Incorrect tables
100
.
(1)
(iii) Signal Quality Requirements
(1) CINR
|
MFER5%
: the minimal value of CINR [dB]
for which the MFER is at most 5%;
(2) E
|
MFER5%
: the minimal value of E [dBμV/m] for
which the MFER is at most 5%. CINR
|
MFER5%
and E|
MFER5%
correspond with the MFER 5%
criterions [3, 4] for the CINR and the electric-
field strength, respectively.
(iv) Range
(1) R
CINR|
5
: estimated range in a particular direc-
tionbasedonrequiredCINR
|
MFER5%
;
(2) R
E|
5
: estimated range in a particular direction
basedonrequiredE
|
MFER5%
;
(3) R: estimated range in a particular direction
based on %Valid reception;
(4) CINR
R
: average CINR value at a distance equal
to R;
(5) E
R
: average E value at a distance equal to R.
More detailed definitions of the parameters related to the
range of the system can be found in Section 2.4.
2.4. Range. The range of the DVB-H network in Ghent will
be determined for the four wind directions (North, South,
East, and West) for a car driving at 20 km/h. Figure 1 shows
the four investigated routes indicated in red. The total length
of these routes is 40 km.
The ranges are calculated as the distance from a location
noted as the “imaginary transmitter” ITx. The location
((x, y, z)-coordinates) of this imaginary transmitter is chosen
as a weighted average of the positions of the three transmit-
ters (see Figure 1):
(x, y, z)
ITx
=
W1·(x, y, z)
Tx1
+W2·(x, y, z)
Tx2
+W3· (x, y, z)
Tx3
W1 + W2 + W3
,
(2)
with (x, y, z)
ITx
are the Lambert coordinates [18] of the imag-
inary transmitter, (x, y, z)
ITj
are the Lambert coordinates of
the base stations in Ghent ( j
= 1, 2, 3). The weights W1, W2,
and W3 correspond with their respective EIRP of 4594 W,
9844 W, and 12304 W.
Different criteria can be used to determine the range
of the DVB-H system: the required CINR, the required E,
or the correctness of the received video stream (%Valid
reception; see Section 2.3). In the following, the method to
determine the range based on these different criteria will be
described and the procedure to calculate R, R
CINR|
5
,andR
E|
5
is discussed.
4 EURASIP Journal on Wireless Communications and Networking
Select route
Label samples
(Fig. 3)
Select window
size: 80 samples
Valid reception
of 95%
Subjective criterion for
good viewing experience:
at most 1 bad image
Calculate R and
corresponding
C/(N + I)
R
and E
R
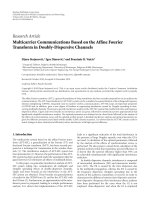
Figure 2: Flow graph illustrating the procedure to calculate R,
CINR
R
, and E
R
.
2.4.1. Criterion 1: Range R for %Valid Reception. Figure 2
shows a flow graph of the new procedure used to calculate
the range R (defined in Section 2.3)oftheDVB-Hsystem,
based on %Valid reception.
The definition of R is based on the definition of %Valid
reception (formula (1); see Section 2.3). To calculate R, a
window of 80 samples is chosen. This corresponds with at
most 20 tables, since tables are received every 2 seconds
or slower (sampling occurs every 0.5 seconds). A window
of 80 samples corresponds with a window length of 222
metres, when driving at 20 km/h. This length is small
enough to obtain sufficient resolution, and large enough to
obtain a sufficient number of samples to calculate a certain
percentage of valid reception. The range R is calculated for
a valid reception of 95% within the window (Figure 2). This
percentage corresponds with a subjective criterion based on
the viewing experience of the users in the DVB-H network:
maximally 1 bad image within the window is allowed for
a good experience. A tag is assigned to every sample: 0 or
1, with 0 for invalid reception and 1 for valid reception.
The procedure of labeling the samples causes the %Valid
reception of 95% to correspond with no more than one
incorrect table received within the window, as proposed in
our subjective criterion.
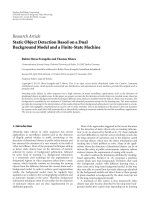
Figure 3 shows this procedure of labeling the samples.
The tag of a sample is zero if the receiver is not locked or if
the receiver is locked but an incorrect table is received. When
for a certain sample the receiver is locked, but no table is
received, the following rule is used: assign the same tag as
the tag of the nearest sample where a table is received. This
means, for example, that samples between two consecutive
incorrect tables are marked as incorrect as well. The same
counts for two consecutive correct tables, where corrected
tables are considered to be correct as well. Samples in
the middle between a correct and an incorrect table are
considered to be correct in order to satisfy our subjective
criterion of good reception (Figure 2), that is, maximally one
bad image is received within one window. Since the window
size is 80 samples, the 95% valid reception range ends when
2 incorrect tables within one window are encountered (2
incorrect tables correspond with at least 6 labels with a
tag equal to 0; see Figure 3), or when the receiver is not
locked for five samples within the window. This corresponds
with the subjective limit for good reception experienced by
the viewers when watching the DVB-H stream during the
tests. Two consecutive incorrect images or no images at all
(when at least 5 successive samples are not locked) observed
by the viewer correspond with a valid reception percentage
dropping below 95% and is the limiting requirement for a
good viewing experience.
Finally, the range R characterizing the distances for valid
reception of the system is defined as
R
=
(x
95
− x
ITx
)
2
+(y
95
− y
ITx
)
2
,(3)
with (x, y)
ITx
defined as in formula (2). x
95
and y
95
are the
coordinates of the point that is located the furthest from
ITx in the last window before %Valid reception reduces to
values lower than 95%. The difference in height between this
point and ITx (z-coordinates) will be neglected in the range
calculation, because the influence of the height difference on
the range is negligible compared to the influence of the x, y-
coordinates. CINR
R
and E
R
are the average values of CINR
and E, respectively, over the samples in this last window
before %Valid reception drops below 95%.
2.4.2. Criterions 2 and 3: R
CINR|
5
and R
E|
5
. To determine
R
CINR|
5
(defined in Section 2.3), a window of 80 samples is
slid along the route. For each position of the window, the
average CINR of the samples inside the window is deter-
mined. The window stops sliding when the average CINR
within the window drops below the required CINR
|
MFER5%
value. These CINR|
MFER5%
values have been determined in
[6, 7, 13]. R
CINR|
5
is then defined as the distance between
ITx and the location of the sample in the window that is
the furthest away from the transmitter ITx. An analogous
definition is used for R
E|
5
.
A comparison of the values of R, R
CINR|
5
and R
E|
5
will be
presented in Sections 3.1 and 3.2.
When comparing the different methods to calculate the
range, we prefer our subjective criterion based on %Valid
reception (criterion 1), because, unlike the criterion based
on the MFER values (criterions 2 and 3), this criterion is
based on the instantaneous viewing experience. The criterion
based on the MFER values makes use of precalculated MFER
values, which are based on an average calculation of the
percentage of correct(ed) tables over a large region. For
example, for the range calculation in the North direction,
the CINR
|
MFER5%
requirement is lower than that for other
directions, because the receiver suffers less from multipath
reception in the North direction as the environment is more
open there. To allow a correct use of the criterion based on
the MFER 5% values, one should have CINR
|
MFER5%
values
for each specific environment for which the measurements
are executed, in constrast to our criterion which is valid for all
situations. The CINR
|
MFER5%
value also differs for different
speeds, whereas using our subjective criterion, the velocity is
of no importance because no precalculated (CINR
|
MFER5%
)
values are used to define the range. For measurements inside
EURASIP Journal on Wireless Communications and Networking 5
Locked?
Incoming
table?
Incoming
table
correct(ed)?
In middle between
correct(ed) and
incorrect table?
Nearest
incoming table
correct(ed)?
N
N
N
N
0
0
0
1
1
N
Y
Y
Y
Y
Y
1
Figure 3: Flow graph illustrating the labeling of the samples (0 or 1) (Y = yes, N = no).
Table 1: Parameter sets investigated to determine the influence of MPE-FEC and modulation scheme.
Parameter set
PHY bit rate
[Mbps]
Var i at io n M PE -F EC
4 K, 1/8, 16-QAM 1/2 MPE-FEC 67/68 10.90
4 K, 1/8, 16-QAM 1/2 MPE-FEC 7/8 9.68
4 K, 1/8, 16-QAM 1/2 MPE-FEC 5/6 9.22
4 K, 1/8, 16-QAM 1/2 MPE-FEC 3/4 8.30
4 K, 1/8, 16-QAM 1/2 MPE-FEC 2/3 7.37
4 K, 1/8, 16-QAM 1/2 MPE-FEC 1/2 5.53
Variation modulation scheme
and inner code rate
4K,1/8,QPSK 1/2 MPE-FEC 7/8 4.84
4K,1/8,QPSK 2/3 MPE-FEC 7/8 6.45
4K,1/8,16-QAM 1/2 MPE-FEC 7/8 9.68
4K,1/8,16-QAM 2/3 MPE-FEC 7/8 12.91
4K,1/8,64-QAM 1/2 MPE-FEC 7/8 14.52
4K,1/8,64-QAM 2/3 MPE-FEC 7/8 19.36
a vehicle, the vehicle penetration loss has an influence on
the CINR
|
MFER5%
values. Also, a statistically relevant number
of samples needs to be investigated to obtain these MFER
values. So, a measurement campaign has to be executed
before the actual range measurements can even start.
The classical method to calculate the range for a network
is to formulate a path loss model based on a path loss
measurement campaign within the network. The range
is then calculated as the radius of the circle around the
transmitter for which the probability to meet the CINR
requirement on the edge is, for example, equal to 95%,
hereby taking into account the predicted average path loss
at a certain distance from the transmitter and the standard
deviation of the path loss values around the predicted value.
When comparing our method to this classical method, there
are several advantages. Firstly, our method is much faster
executable since there is no need for a large measurement
campaign to obtain a statistically relevant number of samples
on different distances from the transmitter for formulating a
path loss model (even at small distances from the transmitter,
where coverage is mostly excellent and does not need much
investigation). Secondly, models for networks with multiple
transmitters are not yet available, we only have knowledge
of path loss models for one transmitter. Thirdly, unlike
range calculations based on a path loss model, our method
provides the possibility to have different ranges in different
directions, which can be useful when the investigated terrain
is heterogeneous.
2.5. Investigated Schemes. Theparametersthathavebeen
tuned are modulation, inner code rate, and MPE-FEC coding
rate level. A list of the different investigated parameter sets
together with the corresponding bit rate [Mbps] is provided
6 EURASIP Journal on Wireless Communications and Networking
Table 2: Range R, corresponding CINR
R
and E
R
values for 95% valid reception, and MFER 5% values for routes along different wind
directions and for different MPE-FEC rates (modulation scheme 16-QAM 1/2).
MPE-FEC rate North West South East Average CINR|
MFER5%
and E|
MFER5%
67/68
Range R [m] 6589 6035 4149 3955 5182
CINR
R
[dB] 12 13.97 15.58 14.53 14.02 14.42
E
R
[dBμV/m] 74.8 77.59 83.07 77.52 78.25 78.89
7/8
Range R [m] 6469 4607 4072 4012 4790
CINR
R
[dB] 12.72 15.27 13.48 12.89 13.59 12.94
E
R
[dBμV/m] 79.93 83.75 81.27 75.89 80.21 79.65
5/6
Range R [m] 5665 6281 5188 3965 5275
CINR
R
[dB] 12.73 16.44 14.91 12.52 14.15 13.27
E
R
[dBμV/m] 76.29 80.8 77.14 77.85 78.02 78.91
3/4
Range R [m] 6637 6245 5117 3956 5489
CINR
R
[dB] 12.02 15.7 13.21 12.973 13.48 13.12
E
R
[dBμV/m] 76.65 81.39 77.69 77.5 78.31 77.73
2/3
Range R [m] 6975 6285 5402 4007 5667
CINR
R
[dB] 11.69 15.01 13.38 12.83 13.23 12.34
E
R
[dBμV/m] 73.3 77.02 75.76 77.05 75.78 74.88
1/2
Range R [m] 6676 6608 5498 4399 5795
CINR
R
[dB] 13.03 11.44 13.98 13.85 13.08 11.53
E
R
[dBμV/m] 76.05 72.67 74.93 78.95 75.65 75.00
in Ta bl e 1. The influence of the MPE-FEC rate and the
modulation on the range is investigated. For the MPE-FEC
study, 16-QAM 1/2 has been selected as modulation scheme
[6, 7, 13]. For the variation of the modulation scheme, MPE-
FEC 7/8 has been chosen [6, 7, 13]. The FFT size [2–4]is
4 K, and a guard interval of 1/8 has been selected for all tests
[6, 13].
3. Results
3.1. Influence of MPE-FEC Coding Rate on R, R
CINR|
5
,and
R
E|
5
. In this section, the influence of the MPE-FEC rate on
the range of the DVB-H network is analyzed.
3.1.1. Range R for Different MPE-FEC Modes. The range R
based on 95% valid reception and our subjective criterion
of Section 2.4 has been determined for the different wind
directions (North, South, East, and West (Figure 1)) and
the different MPE-FEC rates. Ta ble 2 shows the ranges for
the different MPE-FEC rates for the different directions,
as well as the average range over the four directions. For
the considered DVB-H system, in a suburban environment
(Ghent) a range R of 5 to 6 km is possible for good viewing
reception in a car.
Ta bl e 2 shows that the average range increases for higher
MPE-FEC rates (average values from 5182 m (67/68) to
5795 m (1/2)). Thus a gain in range of about 600 m is
possible. One has to make a compromise between lower bit
rate (more MPE-FEC) and higher possible ranges. Because of
the higher MPE-FEC coding, lower CINR values are required
and invalid reception occurs further from ITx than for lower
MPE-FEC coding rates. Tabl e 2 thus shows that higher MPE-
FEC rates require lower CINR
R
and E
R
values (CINR and E
values at range R; see Section 2.4), resulting in a higher range.
CINR
R
varies from 14.02 dB for MPE-FEC 67/68 to 13.08 dB
for MPE-FEC 1/2.
Ta bl e 2 further shows the MFER 5% values
(CINR
|
MFER5%
and E|
MFER5%
) for the different MPE-
FEC rates, as measured in [6, 7, 13].Thesevaluescorrespond
well with the CINR
R
and E
R
values, respectively (e.g.,
differences lower than 1.6 dB for CINR for all MPE-FEC
rates). The MFER 5% values tend to be slightly lower
than the CINR
R
and E
R
values though. Our subjective
criterion (two consecutive bad images are considered to
be intolerable) is thus somewhat more restrictive than the
MFER 5% requirement of [3, 4]. A first reason for this is that
the CINR
R
and E
R
values are determined in the first window,
where %Valid reception drops below 95%. As it concerns
the first drop under 95%, the window is likely to be located
relatively close to the transmitters. This window is probably
situated in a zone with relatively higher CINR and E values
than the MFER 5% values obtained in [6, 7, 13]. A second
reason is that our criterion also takes %Lock into account,
in contrast with the MFER 5% criterion. This could slightly
increase the signal strength requirements, since 95% valid
tables (or MFER 5%) correspond with maximally 95% valid
reception.
The differences between the E
R
values (up to 4.56 dB) for
the different MPE-FEC rates are larger than the differences
between the CINR
R
values (up to 1.07 dB), because of the
nonlinear relation between CINR and E: the measured range
for the CINR values is about 30 dB (0–30 dB), while the range
for E is about 50 dB (70–120 dBμV/m).
EURASIP Journal on Wireless Communications and Networking 7
The CINR
R
and E
R
requirement is lower for route
North than for the other directions due to the less dense
environment (more rural): the receiver suffers less from
multipath reception in the North direction, lowering the
CINR requirement. The range is also higher for North,
because the more open environment attenuates the signal
less than the denser environments in the other directions.
Another reason is the selection of the location of ITx: the
relatively higher weights of the two most southern BS pull
the location of ITx southwards, resulting in higher distances
in the North (and West) direction. The low-power BS1 in
the North is still very useful, because it extends the range
in that direction. It must also be noted that the differences
between the ranges for the different parameter sets are more
important than the absolute values to draw conclusions.
These results will enable future DVB-H trials to select
optimal settings and to define a region where good reception
will be possible.
3.1.2. Comparison of R, R
CINR|
5
,andR
E|
5
. Ta b le 3 compares
the ranges R, R
CINR|
5
,andR
E|
5
for the different MPE-FEC
rates for the different directions as well as the average
range over the four directions. Again, the highest ranges are
obtained for more MPE-FEC coding (67/68 : 4.7kmversus
1/2:5.8km).The differences between the three ranges are
rather limited. The values for R
CINR|
5
and R
E|
5
tend to be
slightly lower than the values for R, because of the method of
the subjective criterion (Section 2.4): samples in the middle
between a correct(ed) table and an incorrect table are always
marked as good, while on average only half of those samples
may be correct. The lower ranges R and R
CINR|
5
for route
West for MPE-FEC 7/8 (see Table 3 ) may be caused by the
fact that all range calculations are the result of one single
investigated route.
3.2. Influence of Modulation Scheme on R, R
CINR|
5
,andR
E|
5
.
In this section, the influence of the modulation scheme on
the range of the DVB-H network is analyzed.
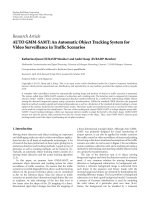
3.2.1. Range for Different Modulation Schemes. The range R
basedon95%validreceptionandoursubjectivecriterionof
Section 2.4 has again been determined for the different wind
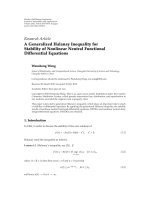
directions (Figure 1) for the modulation schemes (Tabl e 1).
Figure 4 shows the range R for the different wind directions
as a function of the modulation scheme. Tab le 4 shows the
ranges for the different modulation schemes and for the
different directions as well as the average range over the
four directions. Figure 4 and Ta ble 4 show that the range
increases for lower modulation schemes (average values from
3473 m (64-QAM 2/3) to 6427 m (QPSK 1/2)). Because of
the lower modulation, lower CINR values are required, and
invalid reception occurs further from ITx than for higher
modulation schemes.
Ta bl e 4 shows that lower modulation schemes require
lower CINR
R
and E
R
values, resulting in a higher range.
CINR
R
varies from 8.02 dB for QPSK 1/2 to 20.34 dB for 64-
QAM 2/3. Tab le 4 shows that more inner coding results in
higher ranges on average: 6427 m versus 5002m for QPSK,
QPSK 1/2
QPSK 2/3
16-QAM 1/2
16-QAM 2/3
64-QAM 1/2
64-QAM 2/3
Modulation scheme
2000
3000
4000
5000
6000
7000
8000
Range (m)
North
South
We st
East
Average
Figure 4: Range R for the different modulation schemes and for
different directions.
4790 m versus 4614 m for 16-QAM, and 4726 m versus
3473 m for 64-QAM, corresponding with an increase of the
range of 1425 m, 176 m, and 1253 m, respectively. The lower
increase of the range for 16-QAM may be caused by the
fact that all range calculations are the result of only a few
investigated routes.
Ta bl e 4 compares the MFER 5% values (CINR
|
MFER5%
and E|
MFER5%
) with the CINR
R
and E
R
values for the different
modulation schemes. These values correspond again well
with the CINR
R
and E
R
values, respectively (e.g., differences
lower than 0.74 dB for CINR). The MFER 5% values tend
to be slightly lower than the CINR
R
and E
R
values though,
for the same reason as mentioned in Section 3.1. Section 3.1
also explains why the differences between the E
R
values
(up to 15.75 dB) for the different modulation schemes are
larger than the differences between the CINR
R
values (up to
12.32 dB).
Comparison between Tables 3 and 5 shows that the gain
in range is higher when changing the modulation scheme
from QPSK 1/2 to 64-QAM 2/3 than when changing the
MPE-FEC rate from 67/68 to 1/2 (3000 m versus 600 m). A
first reason for this is of course the large influence of the
difference between modulation schemes QPSK and 64-QAM.
A second reason is the following. When changing the MPE-
FEC rate from 67/68 to 1/2, the inner code rate is constant
and equals 1/2. This code rate is relatively high, so that the
relative influence of the MPE-FEC rate on the range is rather
limited. When changing the modulation scheme from QPSK
1/2 to 64-QAM 2/3, the MPE-FEC rate is always 7/8. This low
rate MPE-FEC code causes the influence of the modulation
scheme on the range to be higher than when changing the
MPE-FEC rate, while keeping an inner code rate of 1/2. The
range is again higher for route North, and the CINR
R
and E
R
8 EURASIP Journal on Wireless Communications and Networking
Table 3: 95%-range R, R
CINR|
5
, and R
E|
5
for the different MPE-FEC rates and for the different directions.
MPE-FEC rate North West South East Average
67/68
Range R [m] 6589 6035 4149 3955 5182
R
CINR|
5
[m] 4907 5975 4194 3957 4758
R
E|
5
[m] 5175 5854 4270 3647 4737
7/8
Range R [m] 6469 4607 4072 4012 4790
R
CINR|
5
[m] 6462 4695 4129 4009 4824
R
E|
5
[m] 5171 6163 4132 3678 4786
5/6
Range R [m] 5665 6281 5188 3965 5275
R
CINR|
5
[m] 5093 6354 5301 3948 5174
R
E|
5
[m] 5028 6331 4282 3939 4895
3/4
Range R [m] 6637 6245 5117 3956 5489
R
CINR|
5
[m] 5766 6331 5129 3954 5295
R
E|
5
[m] 5299 6339 5117 3951 5177
2/3
Range R [m] 6975 6285 5402 4007 5667
R
CINR|
5
[m] 6923 6382 5455 4607 5842
R
E|
5
[m] 6700 6352 5446 4048 5637
1/2
Range R [m] 6676 6608 5498 4399 5795
R
CINR|
5
[m] 6709 6443 5604 4826 5896
R
E|
5
[m] 6715 6339 5498 4837 5847
Table 4: Range R, corresponding CINR
R
and E
R
values for 95% valid reception, and MFER 5% values for routes along different wind
directions and for different modulation schemes.
Modulation scheme North West South East Average CINR|
MFER5%
QPSK 1/2
Range R [m] 7162 7122 5641 5784 6427
CINR
R
[dB] 8.57 6.16 8.5 8.83 8.02 7.28
E
R
[dBμV/m] 74.7 71.02 71.59 70.81 72.03 72.30
QPSK 2/3
Range R [m] 5076 6224 5048 3660 5002
CINR
R
[dB] 8.93 11.17 10.41 10.42 10.23 10.23
E
R
[dBμV/m] 78.44 79.23 77.74 78.29 78.43 79.01
16-QAM 1/2
Range R [m] 6469 4607 4072 4012 4790
CINR
R
[dB] 12.72 15.27 13.48 12.89 13.59 12.94
E
R
[dBμV/m] 79.93 83.75 81.27 75.89 80.21 79.65
16-QAM 2/3
Range R [m] 4979 5771 4168 3537 4614
CINR
R
[dB] 15.06 16.22 16.58 17.15 16.25 16.11
E
R
[dBμV/m] 80.78 83.16 83.53 83.77 82.81 81.21
64-QAM 1/2
Range R [m] 5071 5327 4619 3887 4726
CINR
R
[dB] 15.95 18.35 17.88 18.41 17.65 17.45
E
R
[dBμV/m] 79.42 82.64 80.65 79.01 80.43 80.08
64-QAM 2/3
Range R [m] 2376 4704 3443 3368 3473
CINR
R
[dB] 20 20.12 20.54 20.7 20.34 20.28
E
R
[dBμV/m] 88.58 86.52 89.38 86.65 87.78 86.49
requirement is lower for that direction for the same reasons
mentioned in Section 3.1.
3.2.2. Comparison of R, R
CINR|
5
,andR
E|
5
. Ta b le 5 compares
the ranges R, R
CINR|
5
,andR
E|
5
for the different modulation
schemes and for the different directions as well as the average
range over the four directions. The differences between the
three ranges are rather limited. The values for R
CINR|
5
and
R
E|
5
tend to be slightly lower than the values for R, because
of the method of the subjective criterion. This reason is
explained in Section 3.1. The lower ranges R and R
CINR|
5
for
route West for 16-QAM 1/2 (see Table 5 and Figure 4)may
again be caused by the fact that all range calculations are the
result of one single investigated route.
The presented procedure to calculate the range of a DVB-
H network can also be used in other networks and for other
frequencies, since the method is independent of the terrain
characteristics and the frequency.
EURASIP Journal on Wireless Communications and Networking 9
Table 5: 95%-range R, R
CINR|
5
, and R
E|
5
for the different modulation schemes and the different directions.
Modulation scheme North West South East Average
QPSK 1/2
Range R [m] 7162 7122 5641 5784 6427
R
CINR|
5
[m] 7185 6635 7340 5827 6747
R
E|
5
[m] 6999 6592 5583 5746 6230
QPSK 2/3
Range R [m] 5076 6224 5048 3660 5002
R
CINR|
5
[m] 4674 6273 4222 3696 4716
R
E|
5
[m] 4929 5488 4217 3607 4560
16-QAM 1/2
Range R [m] 6469 4607 4072 4012 4790
R
CINR|
5
[m] 6462 4695 4129 4009 4824
R
E|
5
[m] 5171 6163 4132 3678 4786
16-QAM 2/3
Range R [m] 4979 5771 4168 3537 4614
R
CINR|
5
[m] 3374 5776 4193 3638 4245
R
E|
5
[m] 4743 5912 4237 3695 4647
64-QAM 1/2
Range R [m] 5071 5327 4619 3887 4726
R
CINR|
5
[m] 4896 5365 4224 3946 4608
R
E|
5
[m] 4912 5487 4192 3433 4506
64-QAM 2/3
Range R [m] 2376 4704 3443 3368 3473
R
CINR|
5
[m] 2376 4697 2747 1821 2910
R
E|
5
[m] 3060 4707 3977 1808 3388
4. Related Work
A subjective criterion for good viewing reception has also
been developed in [8] for DMB: 7% freeze frames in 20
seconds were considered the maximum rate, while in our
paper, the maximum was 5% in 40 seconds (or 80 samples).
Our criterion can be considered somewhat more restrictive.
It was shown in Section 3 that our criterion corresponds
well with the MFER 5% criterion [3, 4]. Work performed
in [3, 19] revealed that the MFER5 (5%) objective criteria
corresponded to a “good/fair” recovery of audiovisual pro-
grammes subjectively reported by two observers in [3]. It has
been also revealed that an MFER10 (10%) corresponds to
annoying recovery [3]. According to [4], MFER5 marks the
degradation point of the DVB-H service.
In [9], the performance degradation of OFDM signals
due to Doppler spreading in mobile radio applications such
as 802.11a and DVB systems is investigated. In [10],afast
prediction method of the coverage area on the uplink of
a UMTS network cell is presented by computation of the
other cell interferences. The impact on attainable range for
a new mobile broadband access element is investigated for
systems beyond IMT-2000 in [11, 12]; UMTS cell ranges
are calculated based on simulations results. All these papers
however do not present actual range calculations for active
networks.
In [13], the influence of different MPE-FEC rates and
modulation schemes on the performance of a DVB-H
network is analyzed for different reception conditions. The
percentage of valid reception, MPE-FEC gains, carrier to
interference-plus-noise ratios, and minimal signal strengths
for the different reception conditions and modulation
schemes are presented. The values obtained from this paper
can be used for range calculations based on CINR and E
(see Section 2.4.2). In [14], an optimal transmission scheme
is proposed for a specific network, maximizing the range
for a certain throughput requirement, based on technical
trial results. Ranges are calculated for one active transmitter
(BS2 in our paper), based on the ITU model and a self-
developed model. In [15], coverage simulations are presented
for antennas with different transmitting powers and at
different heights, but with a predefined CINR requirement
and with use of CDD. CDD is not used in our network and
moreover, in our paper the range is defined as the range for
an imaginary transmitter which is a combination of the three
active transmitters in the network, each with different heights
and transmitting powers. This makes a comparison between
[14, 15] and this paper difficult or at least unfair.
5. Conclusions
In this paper, a new method to determine the range of
DVB-H networks is proposed. A new subjective criterion
related to the percentage valid reception is used, based
on the viewing experience of the users. The proposed
method provides reliable range predictions for which less
measurement effort is needed than the classical methods,
and it provides the possibility to have different ranges for
different terrains. Measurements are performed with a DVB-
H tool implemented on a PCMCIA card in a laptop in a
suburban environment in Ghent, Belgium, for a DVB-H
network operating at 602 MHz and with a bandwidth of
8 MHz. The measurements are executed at a height of 1.5 m
inside a vehicle for different modulation schemes and MPE-
FEC rates.
10 EURASIP Journal on Wireless Communications and Networking
Modulation schemes with more MPE-FEC result in
higher ranges (up to 600 m): from 5182 m (67/68) to 5795 m
(1/2) for the considered system. Lower modulation schemes
also have higher ranges (up to 3000 m): from 3473 m (64-
QAM 2/3) to 6427 m (QPSK 1/2). The range can increase
by up to about 1400 m when changing the inner code
ratefrom2/3to1/2.Onehastomakeacompromise
between higher ranges (more MPE-FEC, more inner coding,
lower constellations) and the resulting lower data rates. The
MFER 5% values (CINR
|
MFER5%
and E|
MFER5%
) correspond
well with the CINR
R
and E
R
values. Future research could
include the formulation of a mathematical model, of which
the results can be compared with those presented in this
paper.
Acknowledgments
This work was supported by the IBBT-MADUF Project,
cofunded by the Interdisciplinary institute for BroadBand
Technology (IBBT), a research institute founded by the
Flemish Government in 2004, and the involved companies
and institutions. W. Joseph is a Postdoctoral Fellow of the
FWO-V (Research Foundation—Flanders).
References
[1] ETSI, EN 302 304 v1.1.1, “Digital Video Broadcasting (DVB);
Transmission System for Handheld Terminals (DVB-H),”
October 2004.
[2] ETSI, EN 300 744 v1.5.1, “Digital Video Broadcasting (DVB);
Framing structure, channel coding and modulation for digital
terrestrial television,” November 2004.
[3] ETSI, TR 102 401 v1.1.1, “Digital Video Broadcasting (DVB);
Transmission to Handheld Terminals (DVB-H); Validation
Task Force Report,” May 2005.
[4] ETSI, TR 102 377 v1.1.1, “Digital Video Broadcasting (DVB);
DVB-H Implementation Guidelines,” February 2005.
[5] G. Faria, J. A. Henriksson, E. Stare, and P. Talmola, “DVB-H:
digital broadcast services to handheld devices,” Proceedings of
the IEEE, vol. 94, no. 1, pp. 194–209, 2006.
[6] D. Plets, W. Joseph, L. Martens, E. Deventer, and H. Gauderis,
“Evaluation and validation of the performance of a DVB-H
network,” in Proceedings of the IEEE International Symposium
on Broadband Multimedia Systems and Broadcasting,Orlando,
Fla, USA, March 2007.
[7] D. Plets, W. Joseph, L. Martens, E. Deventer, and H. Gaud-
eris, “Evaluation of performance characteristics of a DVB-H
network for different reception conditions,” in Proceedings of
the 57th IEEE Annual Broadcast Symposium, Washington, DC,
USA, October 2007.
[8]Y.Lee,S.Lee,Y.H.Kim,etal.,“Fieldtrialsforterrestrial
digital multimedia broadcasting system,” IEEE Transactions on
Broadcasting, vol. 53, no. 1, pp. 425–432, 2007.
[9] T. Wang, J. G. Proakis, E. Masry, and J. R. Zeidler, “Per-
formance degradation of OFDM systems due to doppler
spreading,” IEEE Transactions on Wireless Communications,
vol. 5, no. 6, pp. 1422–1432, 2006.
[10] D. Staehle, K. Leibnitz, and K. Heck, “A fast prediction of
the coverage area in UMTS networks,” in Proceedings of IEEE
Global Telecommunications Conference (GLOBECOM ’02), vol.
1, pp. 615–619, Taipei, Taiwan, November 2002.
[11] W.Mohr,R.L
¨
uder, and K. M
¨
ohrmann, “Data rate estimates,
range calculations and spectrum demand for new elements
of systems beyond IMT-2000,” in Proceedings of the 5th
International Symposium on Wireless Personal Multimedia
Communications (WPMC ’02), vol. 1, pp. 37–46, Honolulu,
Hawaii, USA, October 2002.
[12] T. Westman and H. Holma, “CDMA system for UMTS
high bit rate services,” in Proceedings of the 47th IEEE
Vehicular Technology Conference (VTC ’97), vol. 2, pp. 825–
829, Phoenix, Ariz, USA, May 1997.
[13] D. Plets, W. Joseph, L. Verloock, et al., “Influence of reception
condition, MPE-FEC rate and modulation scheme on perfor-
mance of DVB-H,” IEEE Transactions on Broadcasting, vol. 54,
no. 3, pp. 590–598, 2008.
[14] W. Joseph, D. Plets, L. Verloock, et al., “Procedure to optimize
coverage and throughput for a DVB-H system based on field
trials,” IEEE Transactions on Broadcasting,vol.54,no.3,pp.
347–355, 2008.
[15] Y. Zhang, C. Zhang, J. Cosmas, et al., “Analysis of DVB-H
network coverage with the application of transmit diversity,”
IEEE Transactions on Broadcast ing, vol. 54, no. 3, pp. 568–577,
2008.
[16] ITU-R Recommendation SM.1708, “Field-strength measure-
ments along a route with geographical coordinate registra-
tions,” 2005.
[17] ITU-R Recommendation P.1546, “Method for point-to-area
predictions for terrestrial services in the frequency range 30
MHz to 3000 MHz,” 2003-2005.
[18] POSC Specification, “Lambert Conic Conformal Projection,”
/>2/DataModel/ExamplesofUsage/
eu
cs34e.html.
[19] T. Owens, C. Zhang, T. Itagaki, et al., “Deliverable 6.1: radio
spectrum, traffic engineering and resource management,”
Tech. Rep., Brunel University Research Archive, Uxbridge, UK,
September 2005, .