Báo cáo hóa học: "Research Article Towards a Performance Boundary in Calibrating Indoor Ray Tracing Models" pptx
Bạn đang xem bản rút gọn của tài liệu. Xem và tải ngay bản đầy đủ của tài liệu tại đây (5.19 MB, 8 trang )
Hindawi Publishing Corporation
EURASIP Journal on Wireless Communications and Networking
Volume 2009, Article ID 532474, 8 pages
doi:10.1155/2009/532474
Research Article
Towards a Performance Boundary in Calibrating
Indoor Ray Tracing Models
Jaouhar J emai
1
and Thomas K
¨
urner
2
1
Ubise nse AG, Development and Services, 80637 Munich, Germany
2
Institut f
¨
ur Nachrichtentechnik, Technische Universit
¨
at Carolo-Wilhelmina Braunschweig, 38106 Braunschweig, Germany
Correspondence should be addressed to Jaouhar Jemai, jaouhar
Received 27 July 2008; Revised 18 December 2008; Accepted 20 February 2009
Recommended by Jun-ichi Takada
This paper investigates the performance boundaries of a calibrated deterministic indoor channel model. From a propagation
modeling point of view, this process allows to assess the weakness of ray tracing and sets the boundary conditions for a such
modeling method. The principle of the deterministic model calibration used in this work focuses upon the estimation of optimal
material parameters by means of a few pilot measurements and a simulated annealing method. This technique improves the
accuracy of the prediction model for all measurement positions including those not considered by the calibration. The performance
of the calibrated ray tracing model and the sensitivity of the calibration to the number of pilot measurements have been
investigated. For this investigation, a measurement campaign has been conducted within an indoor office building at 2.45GHz
with 100 MHz bandwidth. Furthermore, the model performance has been compared to empirical indoor models.
Copyright © 2009 J. Jemai and T. K
¨
urner. This is an open access article distributed under the Creative Commons Attribution
License, which permits unrestricted use, distribution, and reproduction in any medium, provided the original work is properly
cited.
1. Object ive and Introduction
The blind prediction, based on a priori approximate
knowledge of material parameters, often shows an obvious
mismatch with the measurements. Even if predicted path loss
values are accurate enough like, for example, in [1], time dis-
persion parameters could show a significant mismatch. Ray
tracing-based conventional deterministic modeling methods
use geometrically accurate data and rely on tabulated values
for the electrical parameters of the building materials. For
instance, the authors in [2] made direct measurements of
the building materials. However, the material parameters
remain approximate and impossible to define accurately for
each building, especially when the building materials are a
heterogeneous mixture of unknown components, for which
no electromagnetic measurement values are available. There-
fore, a calibration of these material parameters, reducing
the mismatch between the model and the measurements, is
required. The issue of deterministic modeling calibration has
been addressed in very few works. In [3], only the dielectric
constant of each wall have been tuned separately and the
gradient method is used to estimate the solution. However,
using the gradient method in conjunction with this tuning
provides generally a local minimum and does not necessarily
provide the optimal solution.
As the relation between power taps and material param-
eters is a nonlinear combinatorial relationship, the simulated
annealing approach used in this paper provides the general
optimal solution by simultaneously changing the dielectric
constant and loss tangent of all material parameters with
a changing step at each range of iterations. The method
proposed converges to a global solution and avoids to be
dropped into a local minimum as the gradient method
does. The performance and robustness of this calibration
procedure is analyzed in this paper by means of an indoor
measurementcampaignwithinanoffice building.
This paper is organized as follows. Section 2 presents
the ray tracing model. Section 3 investigates the calibration
process and the calibration algorithm. Subsequently, the
conducted measurement campaigns and the calibration
results for an indoor office environment are highlighted in
Section 4. Finally, Section 5 addresses the sensitivity of the
calibration to the measurements and assesses the boundary
of the modeling methods.
2 EURASIP Journal on Wireless Communications and Networking
2. The Wideband Semideterministic
Prediction Model
The prediction model has been presented earlier by the
authors in [4–6]. It has been derived by means of two core
components; a geometric engine and an electromagnetic
engine. While the geometric engine derives the propagation
paths based on the accurate information of the 3D building
database, the electromagnetic engine computes the prop-
agation mechanisms and integrates the antenna radiation
patterns.
The model requires an accurate 3D indoor database with
detailed information describing the scattering objects (walls,
doors, and windows), their thickness and their dielectric
properties. The required building parameters introduced in
the database are the relative dielectric constant ε
r
and the loss
tangent tan δ. According to their electromagnetic material
properties, the structures of the building are classified
into N different classes with common dielectric material
parameters.
Besides free-space propagation, the propagation tool
computes the Fresnel equations, considering multiple
reflections and transmission through walls. Depending
on whether the antennas is horizontally or vertically
polarized, the system considers the corresponding reflec-
tion/transmission coefficients and also the angle of departure
(AoD) and angle of arrival (AoA) corresponding to each
path. Interactions up to the 3rd order reflection have
been considered. Many simulations have confirmed that
this order provides a compromise between the accuracy of
channel parameter (path loss and delay dispersion) and the
reasonable computation time, which is also in accordance
with [7].Thetoolsupportsasmuchtransmissionsasthe
wave encounters in its propagation path. It accounts for the
single diffraction using the uniform theory of diffraction
(UTD) [8].
Thus, the channel model could be represented as a power
delay profile (PDP) expressed by
h(τ)
=
L
p
k=1
α
k
δ
τ − τ
k
,(1)
where P is the number of taps, α
k
and τ
k
are the power
and time of arrival (ToA) of the kth tap. The deterministic
channel modeling provides channel characteristics with an
infinite bandwidth. Hence, an infinite discrete time resolu-
tion is achieved, enabling all MPCs to be resolved. However,
as the measurement bandwidth is generally limited, the
resolution of the measurement equipment could not enable
the detection of all multipath components. Each group of
closely spaced MPCs has been represented with a particular
tap delay L
p
, the power of which is the sum of these MPCs
power. The PDP could then be written as
h(τ) =
L
p
k=1
k
n
n=1
α
k
n
δ
τ − τ
k
,(2)
whereby k
n
is the number of MPCs clustered together to form
the kth tap.
Since typically only 2D radiation patterns (horizontal
and vertical) are available, the developed model derives the
3D antenna radiation pattern through a bilinear interpo-
lation knowing the measured 2D patterns in E- and H-
planes [9]. Moreover, for a better accuracy, the system model
integrates also 3D measured antenna patterns within an
anechoic chamber.
3. Model Calibration
The calibration consists in extracting relevant multipath
components (MPCs), for instance once reflected paths,
simultaneously from the model and measurement. After-
wards, the simulated annealing is performed to optimize the
material parameters.
3.1. Extraction of Parameters for Calibration. The measured
and predicted PDPs h
meas
and h
mod
are given by
h
meas
(τ) =
Lp
meas
k=1
α
k
meas
δ
τ − τ
k
,
h
mod
(τ) =
Lp
mod
k=1
α
k
mod
δ
τ − τ
k
.
(3)
After identifying the direct path, according to the arrival
time corresponding to the distance separating Tx and Rx,
particular P power taps (e.g., once reflected paths) with a
power above the noise threshold have been extracted from
the measurement and the model simultaneously. The noise
threshold is computed from each measurement based on
a dynamic noise clipping. Hence, two vectors of power
taps have been formed which are [[(α
k
)
meas
]
P
n
=1
]
T
and
[[(α
k
)
mod
]
P
n
=1
]
T
. The calibration uses the electromagnetic
engine, the power tap matrices and the involved building
structures to optimize the material parameters incorporated
by the deterministic model.
3.2. Simulated Annealing Algorithm: Practical Implementa-
tion for Material Parameters Est imation. The “Simulated
Annealing” is analogous to the phenomenon of heating
a material and letting it cool gradually until reaching a
steady state. By the cooling process, the material reaches
a global optimum, for which a global minimum energy
crystalline structure is dissipated. Starting with an initial
solution s (set of material parameters for the N classes) at
a relatively high chosen temperature T
0
, a neighbor solution
s
is afterwards generated as a next solution for which the
evolution in cost, ΔE(s, s
) = E(s
) −E(s), is evaluated. If the
cots decreases, the generated neighbor solution becomes the
current one, otherwise the algorithm decides with a certain
probability whether s remains or s
becomes the current
solution. The probability of accepting a transition, causing
adecreaseΔE(s, s
) in the cost, is called the acceptance
function and is set to e
−ΔE/T
. T is the parameter that
corresponds to temperature in the analogy with the physical
annealing process. The algorithm runs L steps with the same
EURASIP Journal on Wireless Communications and Networking 3
Table 1: Simulated annealing algorithm parameters.
Notation
Meaning
s
A random solution as a set of material parameters
E(s)
Objective function
T
0
Initial temperature of the stepped geometric decrease
A
Geometric decrease coefficient
L
Number of steps running with constant temperature
ST
Maximum steps the algorithm runs without many
changes
temperature. Afterwards, the changing step of the parameters
is decreased geometrically with the factor A towards zero.
The process is stopped after ST steps if the objective function
remains unchanged. The final solution is considered as the
absolute optimum. The four configuration parameters (T
0
,
A, L, and ST ) considered by the algorithm are described in
Ta bl e 1 .
The initial material properties are defined using tab-
ulated values available in literature and knowledge of the
construction material category. The electromagnetic prop-
erties of some different conventional building materials, for
example, at the WLAN frequencies can be found in literature
[2, 10, 11]. However, some materials are a mixture of
unknown components, for which no electromagnetic mea-
surement values are available. Therefore, the optimization
process starts from a common value for all these materials,
corresponding, for example, to the concrete (ε
r
= 4.95,
tan δ
= 0.01) at ambient temperature as measured in [11].
The optimized objective (cost) function is defined as the root
mean square error between the measured and the predicted
tap powers for all M measurements with P
m
propagation
paths each. A total of 990 indoor planes (walls) of the
building have been grouped into 20 different classes of
structures. Starting from an initial set of material parameters
as initial solution for structure classes, the initial objective
function is computed at each new iteration i as
C
i
=
1
M
M
m=1
1
P
m
P
m
n=1
α
mn
mod
−
α
mn
meas
2
i
,(4)
where M is the number of conducted measurements, P
m
is
the number of paths within the measurement m,andα
mn
are the power taps from (1). The parameters (α
mn
)
mod
and
(α
mn
)
meas
denote the predicted and measured powers of the
MPCs, respectively.
4. Measurement Campaign and
Calibration Results
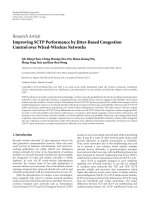
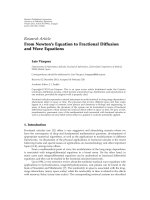
4.1. Measurement Campaign. The measurements have been
conducted within an indoor office building environment,
for which the antenna placements are depicted in Figure 2.
In the frequency domain, a vector network analyzer is
connected through a GPIB connection to a notebook. It
sweeps the channel with a bandwidth of 100 MHz around the
central frequency 2.45 GHz. The channel impulse response
Rx
Tx
(a)
(b)
Figure 1: (a) A measurement configuration within an office room
with (b) a 3D ray tracing.
in the time domain is obtained by the inverse fast Fourier
transform (ifft) of the measured complex channel transfer
function. In order to overcome the leakage problem of side
lobes, while preserving a reasonable pulse width within
the channel impulse response, a Hamming window is
applied. Two identical WLAN directional antennas, with
14 dBi gain and a half-power beam width of 30
◦
,havebeen
connected to the ports of the VNA via two cables of 10 m
length each. The corresponding radiation patterns have been
measured in 3D in an anechoic chamber at the frequency
of 2.45 GHz and have been introduced into the model.
Both antennas can be directed in azimuth and elevation
in the range 0–350
◦
with steps of 10
◦
and are positioned
at a height level of 1.25 m. Using directional antennas is
favorable for focusing the reception on a specific direction
targeting a better identification of reflections impinging
from the surrounding environment. The performance has
been investigated in terms of RMS delay spread (σ
τ
[ns]),
maximum excess delay (τ
max
[ns]) and path loss (L [dB]),
which is computed considering the sum over all MPCs
powers above the noise threshold. The channel parameters
have been computed considering a noise clipping. A total
number of 38 measurements corresponding to 4 transmitter
locations, associated with 20 receiver positions on the second
floor have been conducted, whereby different antenna tilts
(with steps of 90
◦
) have been considered at some positions.
These locations are shown in Figure 2. The building database
4 EURASIP Journal on Wireless Communications and Networking
Tx1
Tx2
Tx3
Tx4
1
2
3
4
5
1
2
1 m
1
2
3
1
1.01
1.011.011.01 1.01
1.011.01
1.01
2.51
2.51
2.51 2.51
2.51
2.512.512.512.51
1.091.091.091.091.09
1.091.09
1.01
2.51
1.091.09
1.01
2.51
1.091.09
1.01
2.51
1.141.04
1.01
2.51
1.141.04
1.01
2.51
1.091.09
1.01
2.51
1.045
2.79
125
125
1.01
2.25
1.01
115
1.76
2.25
625
115
1.01
245
2.135
6
2.79
1.01
1.02
1.135
2.08
2.57
1.135
1.15
5.99
255
05
05
8
8
8
2
20 97
115 1151.26
20
50 491.01
2.135
3.42 15 1.02
1.02
5.99
255
8
8
8
2
05
05
1.01
125
125
2.01
858
2.01
858
50
475
975
49
50
1.01
2.135
1.031.09
1.091.091.091.091.091.091.091.09
4.98
Measurement position
Position for calibration
Figure 2: Indoor transmitter and receiver locations.
gathers 900 elementary planes constituting the structures
(walls, doors, windiws, cupboards, bookshelves, and tables),
as shown in Figure 1.
The offices where the measurements have been con-
ducted are representative of the entire institute building and
gather most of the building structures. Moreover, 9 aligned
measurements starting at 3 m from the transmitter have been
conducted on the floor (as depicted in Figure 2)duetoits
characteristics enabling LOS conditions and wave-guiding
effects.
4.2. Calibration Performance. Thecalibrationhasbeenper-
formed using a set of three measurements for LOS (Tx2-
Rx1, Tx2-Rx2) and for NLOS (Tx1-Rx5) as presented in bold
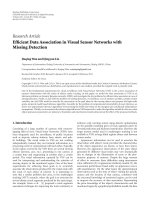
squares in Figure 2. Figure 3 displays the PDP (before and
after calibration).
The positions Tx2-Rx1 is included in the calibration,
Tx1-Rx2 in the neighbor room, and Tx4-Rx1 situated on
the corridor are both not used as calibration data. The
initial cost function prior to calibration amounts to 5.2 dB,
whereas the one after calibration is 1.3 dB. The PDPs have
been normalized referring to the direct path power. The good
match of the model is resumed in Tab le 2 regarding channel
parameters.
Though initially not included in the calibration, the
measurements Tx1-Rx2 and Tx4-Rx1 show a good match
with the calibrated model. As expected, the measurement
Tx2-Rx1 shows a better match than the other measurements
not included in the calibration. However, the advantage
of the model resides in providing globally more accurate
parameters at any location within the environment without
need of huge measurement campaigns to cover the whole
Table 2: Summary of results for the three positions.
Position Parameter Measurement Uncalibrated Calibrated
Tx2-Rx1
σ
τ
[ns] 10.3 2.8 8.1
τ
max
[ns] 170 60 160
L [dB] 42.9 44.5 42.2
Tx1-Rx2
σ
τ
[ns] 16 5.5 13.8
τ
max
[ns] 170 70 120
L [dB] 41.2 43.8 40.4
Tx4-Rx1
σ
τ
[ns] 11.8 1.3 7.9
τ
max
[ns] 160 40 170
L [dB] 28.8 28.3 28.7
building. This is an advantage over the statistical modeling
as presented, for example, in [6].
4.2.1. Overall Analysis. An overall improvement of the cali-
brated model compared to the uncalibrated one is obviously
noticeable in most cases. The delay dispersion parameters are
considerably improved as the power taps are calibrated. This
is demonstrated in Tab l e 3 showing the overall improvement
by the new calibrated model in terms of prediction error over
all measurements, where the mean, the standard deviation,
the minimum, and the maximum error are denoted by
Δ, Δ
σ
,
Δ
min
,andΔ
max
. Hence, the calibrated model delivers globally
a significant improvement in characterizing the channel. A
mean prediction error of 1.5 dB and a standard deviation of
4 dB are provided by the calibrated model. At a few positions,
channel parameters did not improve due to the presence
EURASIP Journal on Wireless Communications and Networking 5
−60
−50
−40
−30
−20
−10
0
Path loss (dB)
0 50 100 150 200 250 300
Excess delay time (ns)
Power delay profile
(a)
−60
−50
−40
−30
−20
−10
0
Path loss (dB)
0 50 100 150 200 250 300
Excess delay time (ns)
Power delay profile
(b)
−60
−50
−40
−30
−20
−10
0
Path loss (dB)
0 50 100 150 200 250 300
Excess delay time (ns)
Measurement
Uncalibrated model
Calibrated model
Propagation paths
Power delay profile
(c)
Figure 3: PDP for the measurements (a) Tx2-Rx1 (used as
calibration data), (b) Tx1-Rx2 (not used as calibration data), and
(c) Tx4-Rx1 (not used as calibration data).
Table 3: Overall prediction error of the model before and after
calibration.
Parameter Statistics Uncalibrated Calibrated
σ
τ
[ns]
Δ 84
Δ
σ
5.1 4.7
Δ
min
1.5 −5.6
Δ
max
22.8 18.1
τ
max
[ns]
Δ 46 11.9
Δ
σ
48.1 30.1
Δ
min
−40 −30
Δ
max
140 80
L [dB]
Δ 1.6 1.3
Δ
σ
9.1 4
Δ
min
−23.5 −10.5
Δ
max
21.1 7.3
Table 4: Path loss prediction error statistics of COST 231 models
and calibrated ray tracing.
Model OSM MWM Ray tracing
Δ −5.3 −4.1 1.3
Δ
σ
10.5 9.2 4
Δ
max
26.8 17.8 7.3
Δ
min
−14.8 −17.4 −10.5
of other objects with different materials or due to other
propagation mechanisms not considered by the model.
4.2.2. Performance Over COST 231 Models. COST 231
models (one slope model and multiwall model) [12]are
narrowband indoor prediction models. These models have
been fitted using the same measurements used for the ray
tracing. These models are given by the following equations
L
OSM
= 50.7+17.3log(d) [dB], (5)
whereas the MWM model is given by
L
MWM
= 40 + 20 log(d)+c +
w
L
w
k
w
[dB], (6)
where the constant loss c
=−6.7 dB and the wall loss L
w
=
15.7 dB have been determined by calibration. A comparison
of the results of the calibrated model performance over the
conventional COST 231 models for all 38 measurements
are summarized in Tabl e 4 . It is obvious that the calibrated
model outperforms the two empirical models. An average
error of 1.3 dB is achieved by the ray tracing model, whereas
the ones of OSM and MWM remain between
−6and−4dB.
Compared to the COST 231 models, which have a standard
deviation between 11 and 9 dB, the calibrated ray tracing
model achieves a smaller standard deviation of 4 dB.
Originally, empirical models provide less accuracy com-
pared to ray tracing models, as they only consider the
direct path between the transmitter and the receiver. This
is the main cause of their weakness especially within a rich
multipath indoor environment.
6 EURASIP Journal on Wireless Communications and Networking
0
1
2
3
4
5
6
7
8
9
10
E (dB)
0 5 10 15 20 25 30 35 40
Measurement
Figure 4: Cost function using one measurement.
5. Sensitivity of the Calibration to
the Measurements
Analyzing the performance of the calibration reveals some
investigations to be dealt with comprehensively. In this
section, the degree of the model performance improvement
added by the calibration is assessed as a function of the
calibration set size. First, the effect of one measurement
is investigated. Subsequently, the impact of increasing the
calibration set size has been analyzed.
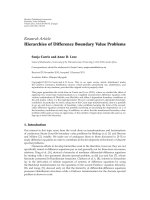
5.1. Single Measurement-Based Calibration. The optimiza-
tion on a single measurement is useful to provide an insight
into the degree of improvement to be expected with an
adequate choice of material parameters. Each of the 38
measurements has been used for calibration of the model
and the cost function for this measurement as well as
the modeling error are computed for all measurements.
Obviously, by virtue of their representative locations in the
building, some measurements perform better than others
when used for calibration. For instance, measurements 10
and 20 provide the best match with a cost of 1.2to1.5dB
(see Figure 4), whereas other measurements (2, 13, and 31)
deliver the worst match with an error between 5 and 7 dB.
Each measurement of the 38 has been used singularly
for calibration. The overall results of the improvement using
one measurement are shown in Figure 5,where
ε denotes
the absolute average prediction error between the model and
the measurements for the complete set of 38 measurements,
expressed by
ε =
1
38
38
i=1
Δ
i
,(7)
where Δ
i
is the prediction error for the ith measurement.
The uncalibrated plot (dashed line) is constant as it is
the difference between the measurement and prediction for
all the set of data before calibration. It is noticeable that the
average error reaches an optimum of 3 dB. However, at some
0
5
10
15
ε (dB)
0 5 10 15 20 25 30 35 40
Measurement number
(a)
0
2
4
6
8
10
ε (ns)
0 5 10 15
20
25 30 35 40
Measurement number
(b)
0
20
40
60
80
ε (ns)
0 5 10 15 20 25 30 35 40
Measurement number
Calibrated
Uncalibrated
(c)
Figure 5: Average error for all measurements with a calibration set
of one measurement for (a) path loss, (b) RMS delay spread, and (c)
maximum excess delay.
other, less representative locations of the entire building, the
calibration results are rather degraded.
5.2. Measurement Set Size Influence. Inordertokeepthe
computation time reasonable with the increasing number of
possible combinations, all possible combinations from the
first 15 measurements have been considered (n
= 1, , 15).
The remaining 15 measurements have been added to the set
(one each new calibration process) without combination. At
each calibration computation, the resulting cost function is
recorded and plotted versus the calibration set size (number
of measurements) in Figure 6. The cost function undergoes
an exponential decay with the variation trend given by the
equation in the figure.
Figure 7 shows the average of the errors between the
measurements and the calibrated model for all combinations
of the 30 measurements, when the number of measurements
used to optimize the floor plan is increased.
ε denotes
the absolute average prediction error for all measurements
together. At each calibration process, the calibration set size
is incremented by one measurement and the calibration
error for all positions is computed. All combinations of
measurements have been considered to derive the average
EURASIP Journal on Wireless Communications and Networking 7
1
1.5
2
2.5
3
3.5
4
4.5
5
5
E (dB)
0 5 10 15 20 25 30
Calibration set size
Cost value
Exponential decay
y
= e
−0.043x+1.2
Figure 6: Cost function with increasing size of the calibrating
measurement set.
error. The overall degree of improvement in terms of time
dispersion and path loss parameters is illustrated in Figure 7.
Henceforth, the remarkable fact which flows from these
results is that the error diminishes as the calibration set
size increases. This error reaches a fluctuation status around
the number of 10, where the modeling error starts to
fluctuate around a constant value. This reveals effectively
the performance boundary of this deterministic model. It is
noteworthy that the prediction error of path loss and time
dispersion parameters exhibits a general decay trend with
increasing calibration set size. However, a judicious calibra-
tion requires a compromise between a best performance and
a lower computation time and complexity.
6. Conclusions
This paper addresses the subject of a new deterministic
model calibration technique based on simulated annealing,
which improves the model performance by means of a few
pilot measurements.
The basic facts that emerge from this paper are mainly the
model performance improvement and the performance limit
reached with more measurements. Indeed, the calibrated
model outperforms the standard uncalibrated one with a
mean error of 1.3 dB and a standard deviation of 4 dB.
With an increasing size of the calibration set, the calibration
reaches a steady state for a number of measurements of 10
and starts to deviate around a constant value which shows
the performance limit of the ray tracing modeling method.
The calibration positions should be chosen in a way to cover
the different kinds of rooms in the building in order to enable
the coverage of major structures within the environment.
Besides its advantage of compensating for the tedious
task of manually tuning the building dielectric parameters
plan, the calibration produces an optimized building plan
0
2
4
6
8
10
ε (dB)
0 5 10 15 20 25 30 35
Calibration set size
(a)
0
2
4
6
8
10
ε (ns)
0 5 10 15 20 25 30 35
Calibration set size
(b)
0
20
40
60
80
ε (ns)
0 5 10 15 20 25 30 35
Calibration set size
Calibrated
Uncalibrated
(c)
Figure 7: Average error for all measurements in terms of (a) path
loss, (b) RMS delay spread, and (c) maximum excess delay with
increasing size of the calibrating measurement set.
that works for any conventional ray tracing model. It has
been shown that, though the model accuracy improves with
an increasing number of measurements used for the opti-
mization, it is indeed bounded and tends to a steady state.
The calibration modeling error starts to fluctuate around its
extremum after a certain number of measurements, which
obviously shows the limits of the deterministic modeling by
means of ray tracing.
Directional antennas (as used in this paper) enhance the
signal strength and the impinging waves from a certain direc-
tion. Omnidirectional antennas can also be used as in [6].
The more the structures a floor plan has the bigger
the calibration set size should be in order to optimize all
material parameters. Furthermore, the calibrating measure-
ments should involve main propagation paths reflected on
the structures to be calibrated.
References
[1] G. W
¨
olfle, Adaptive Modelle zur Funknetzplanung und zur
Berechnung der Empfangsqualit
¨
at in Geb
¨
auden, Ph.D. thesis,
Institut f
¨
ur Hochfrequenztechnik der Universit
¨
at Stuttgart,
Stuttgart, Germany, 1999.
[2] S. Y. Seidel and T. S. Rappaport, “Site-specific propagation
prediction for wireless in-building personal communication
8 EURASIP Journal on Wireless Communications and Networking
system design,” IEEE Transactions on Vehicular Technology, vol.
43, no. 4, pp. 879–891, 1994.
[3] J. Beneat and N. Bailey, “Optimization of building mate-
rial properties for accurate indoor ray tracing models,” in
Proceedings of the IEEE Military Communications Conference
(MILCOM ’04), vol. 2, pp. 1010–1014, Monterey, Calif, USA,
October-November 2004.
[4] J. Jemai and T. K
¨
urner, “Calibration of indoor channel
models,” in Proceedings of the ITG/VDE Mobile Radio Con-
ference, Technologies and Applications, pp. 31–36, Osnabr
¨
uck,
Germany, May 2007.
[5] J. Jemai and T. K
¨
urner, “Broadband WLAN channel sounder
for IEEE 802.11b,” IEEE Transactions on Vehicular Technology,
vol. 57, no. 6, pp. 3381–3392, 2008.
[6]J.Jemai,I.Schmidt,andT.K
¨
urner, “UWB channel: from
statistical aspects to calibration-based deterministic model-
ing,” in Proceedings of the German Microwave Conference
(GeMIC ’08), Hamburg, Germany, March 2008, European
Microwave Journal. In press.
[7] R. A. Valenzuela, S. Fortune, and J. Ling, “Indoor propagation
prediction accuracy and speed versus number of reflections in
image-based 3-D ray-tracing,” in Proceedings of the 48th IEEE
Vehicular Technology Conference (VTC ’98), vol. 1, pp. 539–
543, Ottawa, Canada, May 1998.
[8] D. A. McNamara, C. W. I. Pistorius, and J. A. G. Malherbe,
Introduction to the Uniform Geometrical Theory of Diffraction,
Artech House, Boston, Mass, USA, 1990.
[9] F. Gil, A. R. Claro, J. M. Ferreira, C. Pardelinha, and L. M.
Correia, “A 3D interpolation method for base-station-antenna
radiation patterns,” IEEE Antennas and Propagation Magazine,
vol. 43, no. 2, pp. 132–137, 2001.
[10] R. M. Buehrer, A. Safaai-Jazi, W. Davis, and D. Sweeney,
“Ultra-wideband propagation measurements and modeling,”
Final Report, DARPA NETEX Program, Virginia Technology,
Blacksburg, Va, USA, January 2004.
[11] H. C. Rhim and O. B
¨
uy
¨
uk
¨
ozt
¨
urk, “Electromagnetic properties
of concrete at microwave frequency range,” ACI Materials
Journal, vol. 95, no. 3, pp. 262–271, 1998.
[12] E. Damosso, Ed., “Digital mobile radio towards future gener-
ation systems,” Cost 231 Final Report, European Commission,
Bruxelles, Belgium, 1999, />