Báo cáo hóa học: " Research Article Analytical SIR for Self-Organizing Wireless Networks" pptx
Bạn đang xem bản rút gọn của tài liệu. Xem và tải ngay bản đầy đủ của tài liệu tại đây (755.92 KB, 8 trang )
Hindawi Publishing Corporation
EURASIP Journal on Wireless Communications and Networking
Volume 2009, Article ID 912018, 8 pages
doi:10.1155/2009/912018
Research Article
Analytical SIR for Self-Organizing Wireless Networks
Abdurazak Mudesir,
1
Mathias Bode,
1
Ki Won Sung,
2
and Harald Haas
2
1
School of Engineering and Science, Jacobs University Bremen, C ampus Ring 12, 28759 Bremen, Germany
2
Institute for Digital Communications, The University of Edinburgh, The Kings Buildings, Edingburgh EH9 3JL, UK
Correspondence should be addressed to Abdurazak Mudesir,
Received 14 May 2008; Revised 26 April 2009; Accepted 20 May 2009
Recommended by Visa Koivunen
The signal to interference ratio (SIR) in the presence of multipath fading, shadowing and path loss is a valuable parameter for
studying the capacity of a wireless system. This paper presents a new generalized path loss equation that takes into account
the large-scale path loss as well as the small-scale multipath fading. The probability density function (pdf) of the SIR for self-
organising wireless networks with Nakagami-m channel model is analytically derived using the new path loss equation. We chose
the Nakagami-m channel fading model because it encompasses a large class of fading channels. The results presented show good
agreement between the analytical and Monte Carlo- based methods. Furthermore, the pdf of the signal to interference plus noise
ratio (SINR) is provided as an extension to the SIR derivation. The analytical derivation of the pdf for a single interferer in this
paper lays a solid foundation to calculate the statistics for multiple interferers.
Copyright © 2009 Abdurazak Mudesir et al. This is an open access article distributed under the Creative Commons Attribution
License, which permits unrestricted use, distribution, and reproduction in any medium, provided the original work is properly
cited.
1. Introduction
In a wireless communication environment characterized by
dynamic channels, high influence of interference, bandwidth
shortage and strong demand for quality of service (QoS) sup-
port, the challenge for achieving optimum spectral efficiency
and high data rate is unprecedented. One of the bottlenecks
in achieving these goals is modeling of the propagation
environments [1]. The general aim of the work described
in this paper is to assist in the derivation of the statistical
properties of the SIR in a self-organizing wireless system,
where network planning is minimal, without recourse to
Monte Carlo simulations.
In a traditional system capacity studies, the pdf of the
SIR has been determined through time-consuming Monte
Carlo simulation or by only accounting for either the large-
scale path loss [2] or multipath propagations [3], which
are incomplete for studying realistic system deployment
scenarios. This is primarily due to the complicated integrals
involved in the derivation of the pdf of the SIR. Moreover,
these studies usually assume strict hexagonal cell layout
in order to simplify the calculation. The authors in [3]
calculate the capacity of Nakagami multipath fading (NMF)
channels assuming that the carrier-to-noise ratio (CNR) is
gamma distributed. This assumption neglects the effects of
shadowing and large- scale path loss. This paper presents
an “exact” pdf derived from a model which is more closely
related to a realistic deployment scenario.
With the results provided here, it is possible to calculate
more precise capacity figures. Furthermore since the new
path loss model takes into consideration the interaction
of the large-scale path loss with the small-scale fading
in which the cells are irregular shaped and arbitrarily
positioned, this derivation is particularly suited to study the
overall system performance of self-organizing networks. Self-
organizing networks can be independent infrastructureless
ad hoc networks or they can also be an extension to cellular
networks, where different self-organizing mechanisms, such
as intelligent relaying and adaptive cell sizing, are used
to enhance coverage or capacity which are the two most
important factors in wireless system planning [4]. The
study of coverage and capacity relies on channel quality
information. The channel quality can be captured by a single
parameter, namely the received SIR. The SIR between two
communicating nodes will typically decrease as the distance
between the nodes increases, and will also depend on the
signal propagation and interference environment. Hence
modeling the SIR on the assumption of the strict hexagonal
2 EURASIP Journal on Wireless Communications and Networking
cellular structure and the well-known path loss model that
ignores the small-scale fading would not be applicable to self-
configuring systems. Therefore analytical derivation of the
pdf of SIR is a crucial step in constructing efficient system
design.
Te l l am b u r a i n [ 5] uses a characteristic function method
to calculate the probability that the SIR drops below
some predefined threshold (probability of outage) under
the assumption of Nakagami fading. Zhan [6] also uses a
similar characteristic function approach to derive outage
probability for multiple interference scenario. These papers
give a significant advantage in reducing the computational
complexity involved in solving multiple integrals in SIR
computation. But, a major shortcoming of these and other
similar papers [7] is that, only the small-scale fading or large-
scale fading is considered in analytically deriving the SIR
statistics.
To the best of our knowledge, there has not been any
work done to analytically derive the pdf of the SIR using the
three mutually independent phenomena: multipath fading,
shadowing and path loss together.
The rest of this paper is organized as follows. In Section 2
the system model considered is presented and in Section 3
the analytical derivation is described in detail. Section 4
provides the numerical and the simulation results. Section 5
concludes the paper.
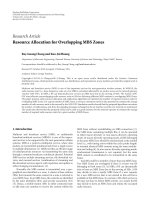
2. System Model and Problem Formulation
For simplicity the cell layout used to derive the pdf of
the SIR assumes circular cells, as shown in Figure 1,with
maximum cell radius R
c
instead of hexagonal cells. The cells
are randomly positioned resulting in potentially overlap-
ping cells. Randomly positioned cells model an important
network scenario, which lacks any frequency planning as
a result of self-configuring and self-organising networks,
cognitive radio and multihop ad hoc communication. A
receiver experiences interference from transmitters within
its accessibility radius, R
ac
. Due to propagation path loss,
a transmitter outside the accessibility region incurs only a
negligible interference. Since the aim is to model a realistic
interference limited environment, the receiver accessibility
radius is taken to be much greater than the cell radius, that is,
R
ac
R
c
. The dashed line in Figure 1 represents the interfer-
ence link between transmitter, Tx y,andreceiver,Rxz while
the solid line shows the desired link between transmitter
Tx x and receiver Rx z and vise versa. Throughout the paper
omni directional antennas with unity gains are considered.
The pdf is calculated assuming one interfering user. The
results obtained can be extended to multiple interfering users
by using laguerre polynomials to approximate the multiple
integration resulting from the multiple interfering users. The
analytical derivation of SIR for multiple interference is under
study.
3. Analytical Derivation of the pdf of the SIR
In an interference limited environment, the received signal
quality at a receiver is typically measured by means of
Tx
y
R
ac
R
c
Rx
z
d
xz
Tx
x
d
yz
Figure 1: Model to drive the pdf of the SIR from a single
neighboring cell.
achieved SIR, which is the ratio of the power of the wanted
signal to the total residue power of the unwanted signals.
let P
t
and P
r
denote the transmit and received power
respectively. Let G denote the path gain and G
yz
is the link
gain between the interfering transmitter y and the receiver
z. For the purpose of clarity, unless otherwise stated, a single
subscript x, y or z specifies the node, and a double subscript
such as xz specifies the link between node x and node z.A
node is any entity, mobile station (MS) or base station (BS),
that is, capable of communicating. For a single interfering
user y depicted in Figure 1:
SIR
z
=
P
t
x
G
xz
P
t
y
G
yz
. (1)
Assuming fixed and constant transmit powers, P
t
x
= P
t
y
=
const, (1) simplifies to:
SIR
z
=
G
xz
G
yz
,(2)
L
=
1
G
=⇒ SIR
z
=
L
yz
L
xz
(3)
where L
xz
, L
yz
are the path losses between transmitter Txx
and receiver Rx z and Tx y and Rx z respectively.
Like the gain parameter G, the loss parameter L incor-
porates effects such as propagation loss, shadowing and
multipath fading.
The generalized path loss model for the cross-layer
environment is given by
L
= C
d
d
0
γ
e
(
βξ
)
large-scale path loss
·
1
H
f
small-scale path loss
(4)
where C
=
C/
C is an environment specific constant,
C
the constant corresponding to the desired link while
C
corresponds to the interference link. The distance d
0
is a
constant and d is a random variable, γ is the path loss
exponent, ξ is the random component due to shadowing,
EURASIP Journal on Wireless Communications and Networking 3
β
= ln(10)/10 and |H( f )| is a random variable modeling
the channel envelop.
The commonly used path loss equation [2] only accounts
for the large-scale path loss with regular cell deployment
scenarios, which is incomplete for studying self-organizing
networks. The new path loss model proposed in this paper
takes into consideration the interaction of the large-scale
path loss as well as the small-scale fading. This model is
particularly important in studying the performance of self-
organizing self-configuring networks.
For the interference scenario described in the system
model, the path loss for the desired path and the path loss
between the interfering transmitter y and the receiver z
(interfering link) are
L
xz
=
Cd
γ
xz
xz
e
(
βξ
xz
)
1
|H
xz
|
,(5)
L
yz
=
Cd
γ
yz
yz
e
(
βξ
yz
)
1
H
yz
,(6)
where L
xz
is the path loss model for the desired link and L
yz
is the path loss model for the interfering link. d
yz
models
the distance between the interference causing transmitter,
x, and the victim receiver y. γ
yz
and γ
xz
are the path loss
exponents, ξ
xz
and ξ
yz
are Gaussian distributed random
variables modeling the shadow fading with each zero mean
and variances v
2
xz
and v
2
yz
respectively, and |H
xz
| and |H
yz
|
are the channel envelope modeling the channel fading. For
the purpose of clarity, the time and frequency dependencies
are not shown. The channel envelope is assumed to follow the
Nakagami-m distribution. Nakagami distribution is a general
statistical model which encompasses Rayleigh distribution as
a special case, when the fading parameter m
= 1, and also
approximates the Rician distribution very well. In addition,
Nakagami-m distribution will also provide the flexibility
of choosing different distributions for the desired link and
interfering link, such as the Rayleigh for the channel envelope
of the desired link, and Rician for the interfering link, or vice
versa.
Using (3)and(5), the SIR can be given as
SIR
=
Cd
γ
yz
yz
e
(
βξ
yz
)
|H
xz
|
d
γ
xz
xz
e
(
βξ
xz
)
H
yz
. (7)
From (7), the SIR has six random variable components,
Φ
xz
= d
γ
xz
xz
, Φ
yz
= d
γ
yz
yz
, Λ
xz
= e
(βξ
xz
)
, Λ
yz
= e
(βξ
yz
)
, |H
xz
| and
|H
yz
|. In order to analytically derive the pdf of the SIR, the
pdf of the individual components and also their ratios and
products need to be determined first.
The following two formulas provide the basic framework
for the analysis and will be used throughout the derivation.
Given two independent random variables X and Y the pdf of
their product f
Z
(z)whereZ = XY is
f
Z
(
z
)
=
f
X
z
x
f
Y
(
x
)
1
|x|
dx. (8)
Given two independent random variables Y and X the
pdf of their ratio f
Z
(z)whereZ = Y/X is
f
Z
(
z
)
=
f
X
(
x
)
f
Y
(
zx
)
|x|dx. (9)
3.1.pdfoftheRatioofthePropagationLoss. It is assumed
that the distance between the interfering transmitter and
the receiver, d
yz
, is uniformly distributed up to a maximum
distance of R
ac
, and that the distance between an inter-
fering transmitter and intended receiver, d
xz
, is uniformly
distributed up to a maximum distance of R
c
. Therefore Φ
xz
and Φ
yz
are both functions of random variables, and their
pdfs can be derived using the following random variable
transformation [8]:
p
(
θ
)
=
p(δ)
|d(θ)/d(δ)|
δ=F
−1
(
θ
)
, (10)
where θ and δ are random variables with pdfs p(θ)andp(δ)
respectivly, and where θ is a function of F(δ), d(θ)andd(δ)
are the first derivatives of θ and δ respectively.
The mathematical representation of the pdfs of d
xz
and
d
yz
are
f
D
xz
(
d
xz
)
=
2d
xz
R
2
c
,0<d
xz
≤ R
c
,
f
D
yz
d
yz
=
2d
yz
R
2
ac
,0<d
yz
≤ R
ac
.
(11)
Let f
Φ
xz
(φ
xz
)and f
Φ
yz
(φ
yz
) denote the pdfs of Φ
xz
and
Φ
yz
. Then employing the transformation (10), f
Φ
xz
(φ
xz
)and
f
Φ
yz
(φ
yz
)arederivedas
f
Φ
xz
φ
xz
=
2φ
xz
2/γ
xz
−1
R
2
c
γ
xz
0 <φ
xz
≤ R
γ
xz
c
,
f
Φ
yz
φ
yz
=
2φ
yz
2/γ
yz
−1
R
2
ac
γ
yz
0 <φ
yz
≤ R
γ
yz
ac
.
(12)
Using (9), the pdf of the ratio of the propagation loss, Φ
=
Φ
yz
/Φ
xz
,isfoundtobe
f
Φ
φ
=
⎧
⎨
⎩
Υφ
2/γ
yz
−1
,for0<φ≤ σ,
Υφ
−2/γ
xz
−1
,forσ <φ<∞,
(13)
where σ
= R
γ
yz
ac
/R
γ
xz
c
, Υ = 2R
2(γ
xz
/γ
yz
)
c
/R
2
ac
(γ
yz
+ γ
xz
)and
Υ =
2R
2(γ
yz
/γ
xz
)
ac
/R
2
c
(γ
yz
+ γ
xz
).
The next step to derive the pdf of the SIR is to find the
pdf of the ratio of the lognormal shadowing.
3.2. pdf of the Ratio of the Lognormal Shadowing. Given
a normally distributed random variable X with mean μ
and variance σ
2
,andarealconstantc, the product cX is
known to follow a normal distribution with mean cμ and
a variance c
2
σ
2
and e
X
has a log normal distribution. Since
ξ
xz
is normally distributed with mean μ and variance σ
2
,
4 EURASIP Journal on Wireless Communications and Networking
Λ
xz
= e
(βξ
xz
)
is a lognormal distributed random variable with
mean μ
xz
and variance v
2
xz
= β
2
σ
xz
2
expressed in terms of
the normally distributed ξ
xz
, while the mean and variance of
Λ
yz
= e
(βξ
yz
)
are μ
yz
and v
2
yz
= β
2
σ
y
z
2
,respectively,
f
Λ
xz
(
λ
xz
)
=
e
−1/2
(
ln
(
λ
xz
)
−μ
xz
)
2
/v
xz
2
λ
xz
v
xz
√
2π
,0
≤ λ
xz
< ∞,
f
Λ
yz
λ
yz
=
e
−1/2
(
ln
(
λ
yz
)
−μ
yz
)
2
/v
yz
2
λ
yz
v
yz
√
2π
,0
≤ λ
yz
< ∞.
(14)
Since the ratio of two independent lognormal random
variables is itself a lognormal distributed random variable.
Therefore the pdf of Λ
= Λ
yz
/Λ
xz
is
f
Λ
(
λ
)
=
e
−1/2
(
ln
(
λ
)
−μ
)
2
/σ
2
λσ
√
2π
,0
≤ λ<∞, (15)
where
σ
= β
v
xz
+ v
yz
, μ = 0. (16)
The last components remaining from (7) are the random
variables modeling the channel envelop and their ratios.
3.3. pdf of the Ratio of the Channel Envelope. In order
to accommodate different channel fading distributions,
Nakagami-m distribution was used to model the channel
envelope. Nakagami-m distribution is the most general of all
distribution known until now [9].
The Nakagami-m pdf is given by
f
|H
xz
|
(
h
xz
)
=
2
Γ
(
m
xz
)
m
xz
Ω
xz
m
xz
h
xz
2m
xz
−1
e
−m
xz
h
xz
2
/Ω
xz
,
0
≤ h
xz
< ∞
(17)
f
|H
yz
|
h
yz
=
2
Γ
m
yz
m
yz
Ω
yz
m
yz
h
yz
2m
yz
−1
e
−m
yz
h
yz
2
/Ω
yz
,
0
≤ h
yz
< ∞
(18)
where m
≥ 1/2 represents the fading figure, Ω = E(x
2
) is the
average received power and Γ(
·) is the gamma function given
as
Γ
(
m
)
=
∞
0
x
m−1
e
−x
dx. (19)
Using (8)and(9) the pdf of the ratio of Nakagamai channel
evelopes, Ψ
=|H
xz
|/|H
yz
| is
f
Ψ
ψ
= M
ψ
2m
xz
−1
m
yz
/2σ
2
xz
+(m
xz
/2σ
2
yz
)ψ
2
(
m
yz
+m
xz
)
,
0
≤ ψ<∞
(20)
where
M
=
2Γ
m
yz
+ m
xz
Γ
m
yz
Γ
(
m
xz
)
m
yz
Ω
xz
m
yz
m
xz
Ω
yz
m
xz
(21)
for m
xz
= m
yz
= 1 the ratio of the Nakagami-distributed
channel is the same as the ratio of two independent Rayleigh
distributed envelopes.
The final step in the derivation of the pdf of the SIR is
deriving the product of the above obtained pdfs.
3.4. pdf of the SIR. As shown in (7) the pdf of the SIR is the
product of the three individual random variables, Φ, Λ and
Ψ. Using the equations presented so far, the final pdf of the
SIR is presented in (22):
f
SIR
(
ζ
)
= Mζ
2m
xz
−1
×
∞
0
A
1
χ
q
1
erf
2/γ
yz
σ
2
+ln
χ/
(
A
)
/
√
2σ
−
1
(m
yz
/Ω
xz
+ m
xz
/Ω
yz
)
ζ/χ
2
(
m
yz
+m
xz
)
+
B
1
χ
q
2
−
1−erf
−
2/γ
xz
σ
2
+ln
χ/
(
A
)
/
√
2σ
(m
yz
/Ω
xz
+m
xz
/Ω
yz
)
ζ/χ
2
(
m
yz
+m
xz
)
dχ
(22)
where q
1
= (2/γ
yz
) − 2m
yz
− 1, q
2
= (−2/γ
xz
) − 2m
yz
− 1,
and A denotes R
γ
yz
ac
/R
γ
xz
c
:
A
1
=
−
2R
2(γ
xz
/γ
yz
)
c
/R
2
ac
γ
yz
+ γ
xz
2
e
(
2/γ
2
yz
)
σ
2
,
B
1
=
−
2R
2(γ
yz
/γ
xz
)
ac
/R
2
c
γ
yz
+ γ
xz
2
e
(
2/γ
2
xz
)
σ
2
.
(23)
The final equation does not have a closed form solution but it
is possible to solve the integration using numerical methods.
4. Signal to Interference and Noise Ratio
In case of an environment that is is not interference limited,
the (signal to interference and noise ratio) SINR is required
to fully describe the communication channel. SINR can easily
be found by modifying the SIR equation given in (1):
SINR
z
=
G
xz
G
yz
+ N
, (24)
where N is the random variable modeling the Gaussian noise
with mean m
N
= 0 and a standard deviation of σ
N
.By
applying the generalized path loss equation in (4), SINR at
the receiver Rx z is given by:
SINR
z
=
|
H
xz
|/d
γ
xz
xz
e
(
βξ
xz
)
H
yz
/d
γ
yz
yz
e
(βξ
yz
)
+ N
, (25)
where the pdfs of the individual random variables are given
in the previous section. Let Θ
xz
= Φ
xz
Λ
xz
= d
xz
γ
xz
e
(βξ
xz
)
EURASIP Journal on Wireless Communications and Networking 5
which are derived in the previous section. The pdf of Θ
xz
,
f
Θ
xz
(θ
xz
), is given as
f
Θ
(
θ
xz
)
=
f
Φ
θ
xz
λ
xz
f
Λ
xz
(
λ
xz
)
1
|λ
xz
|
dλ
xz
f
Θ
(
θ
xz
)
=
∞
θ
xz
/R
2
c
2
(
θ
xz
/λ
xz
)
2/γ
xz
−1
R
2
c
γ
xz
e
−1/2(β
(
ln
(
λ
xz
)
−μ
)
2
/v
xz
2
)
λ
xz
v
xz
√
2π
×
1
λ
xz
dλ
xz
f
Θ
(
θ
xz
)
= D
⎛
⎝
1 −
erf
2v
xz
2
−γ
xz
m
xz
+ γ
xz
log
θ
xz
/R
γ
xz
c
(
2
)
γ
xz
v
xz
⎞
⎠
(26)
where D
= (e
(2v
xz
2
−2γ
xz
m
xz
)/γ
xz
2
/R
2
c
γ
xz
)θ
xz
2/(γ
xz
−1)
.
The next step in the derivation is to find the pdf of the
path loss of the desired link by utilizing (9)and(17). Let
S
=|H
xz
|/d
γ
xz
xz
e
(βξ
xz
)
be the random variable denoting the
path loss of the desired link. The pdf of S is given as
f
S
(
s
)
= K
∞
0
h
xz
2m
xz
e
−m
xz
h
xz
2
/Ω
xz
×
⎛
⎝
1−
erf
2v
xz
2
−γ
xz
m
xz
+γ
xz
log
sh
xz
/R
γ
z
xz
c
(
2
)
γ
xz
v
xz
⎞
⎠
dh
xz
,
(27)
where K
= (2/Γ(m
xz
))(m
xz
2
/Ω
xz
)D.
The pdf of the path loss of the interference path denoted
by the random variable I
=|H
yz
|/d
γ
yz
yz
e
(βξ
yz
)
is give as
f
I
(
i
)
=
K
∞
0
h
yz
2m
yz
e
−m
yz
h
yz
2
/Ω
yz
×
⎛
⎝
1−
erf
2v
yz
2
−γ
yz
m
yz
+γ
yz
log
ih
yz
/R
γ
yz
rv
(
2
)
γ
yz
v
yz
⎞
⎠
dh
yz
,
(28)
where
K = (2/Γ(m
yz
))(m
yz
2
/Ω
yz
)D.
In order to find the pdf of the interference plus noise,
I +N, it is assumed that interference is independent of noise.
The pdf of the sum of two independent random variables U
and V, each of which has a probability density function, is
the convolution of their individual density functions
f
U+V
(
z
)
=
f
U
(
z
−x
)
f
V
(
x
)
dx, (29)
therefore the pdf of I + N, f
I+N
(z)isgivenby:
f
I+N
(
z
)
=
∞
0
f
I
(
z
−x
)
f
N
(
x
)
dx, (30)
where f
N
(x) = e
−(1/2)(x/σ
N
)
2
/(
√
2πσ
N
). Utilizing (9), the pdf
of the SINR is given by
f
SINR
(
ν
)
=
∞
0
f
I+N
(
z
)
f
S
(
νz
)
zdz. (31)
For the special case where the noise approaches zero, the
pdf of the noise is represented as delta function or also known
as, a unit impulse function, around zero. Therefore (30)can
be rewritten as
f
I+N
(
z
)
=
∞
0
f
I
(
z
−x
)
f
N
(
x
)
dx
=
∞
0
f
I
(
z
−x
)
δ
(
x
)
dx = f
I
(
z
)
.
(32)
Thus
f
SINR
(
ν
)
=
∞
0
f
I+N
(
z
)
f
S
(
νz
)
zdz
=
∞
0
f
I
(
z
)
f
S
(
νz
)
zdz
(33)
by the definition given in (9), the f
SINR
(ν)givenin(33) is the
pdf of the SIR(S/I ). Therefore, when the noise approaches to
zero, the pdf of the SINR given in (31) reduces to the pdf of
SIRgivenin(22).
This sub-section has presented the pdf of the SINR
as an extension to the pdf of the SIR. To validate the
analytically derived SINR pdf, it is important to show
that the core derivation, SIR derivation, is valid. The next
sub-section validates the derivation through comparative
numerical simulations of the SIR. The results presented were
obtained using the adaptive Simpson quadrature numerical
integration of the SIR.
5. Results and Discussion
Monte Carlo simulations are carried out in order to validate
the analytically derived pdf results. Figures 2 and 3 show
plots of the pdf of the SIR f
SIR
(ζ)fordifferent scenarios. The
results presented in Figures 2–4 show that the analytical pdf
is in good agreement with the Monte Carlo simulation. The
parameters used for the shadow fading, channel standard
deviation and path loss exponents reflect a realistic deploy-
ment scenario for users moving at a speed of 25 to 40 km/h
[10]. All simulations assume a channel envelope with a
Nakagami-m distribution with different m parameter, which
corresponds to different fading scenario. These parameters
are summarized in Tables 1, 2,and3.
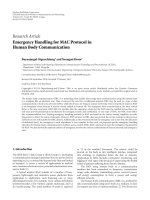
Figure 2 depicts three different plots depending on the
R
ac
/R
c
. As the cell radius R
c
increases there is a significant
cell overlap leading to high mean value of interference which
in turn leads to lower SIR mean value. Therefore, as the ratio
of the cell radius to the accessibility radius approaches to one,
the pdf is skewed towards smaller SIR. These plots show that
the node with the lowest cell radius, R
c
= 100 m, has the
highest SIR mean.
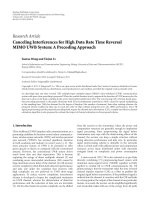
Figure 3 shows the effect of different environments on
the pdf of the SIR. The figure presents plots from an ad hoc
free space outdoor deployment with line of sight scenario
on the desired link, γ
= 2andm = 3, to the most severe
non-line-of-sight scenario of obstructed indoor (in building)
environment, γ
= 4andm = 0.5.Theradiusofthe
cell, R
c
, has been set to 100 m, which is considered a good
6 EURASIP Journal on Wireless Communications and Networking
Table 1: System parameters for Figure 2 (varying cell and access-
ability radius).
Parameter Values
R
c
100 m
R
ac
500 m
v
xz
6dB
v
yz
10 dB
γ
xz
2
γ
yz
4
m
xz
5
m
yz
0.5
Ω
xz
4dB
Ω
yz
6dB
R
c
= 500 m, R
ac
= 500 m
R
c
= 200 m, R
ac
= 500 m
R
c
= 100 m, R
ac
= 500 m
0
0.005
0.01
0.015
0.02
0.025
0.03
0.035
0.04
0.045
0.05
−10 0 10 20 30 40 50 60 70 80
SIR (dB)
Analy
Monte carlo
PdfoftheSIR
Figure 2: Plots of the pdf of the SIR for different values of cell
radius.
configuration example for ad hoc networks. The accessability
radius, R
ac
is assumed to be 500 m. The results illustrate that
the node with the best line-of-sight (LOS) link, γ
xz
= 2and
γ
yz
= 4, has the highest mean SIR value and the biggest
variance or spread. While the node with the most obstructed
inbuilding environment, exhibits the lowest mean and the
smallest variance or spread of all. These can be attributed to
the higher interference contribution of interfering node in
NLOS link than those in LOS condition.
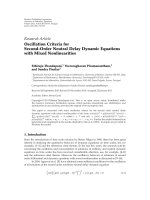
Figure 4 present the cumulative density function of the
SIR. The simulation parameters are summarized in Ta bl e 3.
From Figure 4 it can be observed that for a target SIR of
25 dB, being a reasonable assumption for 64-QAM modu-
lation, the probability that the SIR exceeds the target SIR
in the most severe non-line-of-sight scenario of obstructed
indoor (in building) environment is about 10% resulting
in a high outage probability enforcing the use of lower
order modulation schemes. On the other hand, for the link
Inbuilding obstructed
Outdoor shadowed
urban area
Outdoor
free space
0
0.005
0.01
0.015
0.02
0.025
0.03
0.035
0.04
0.045
0.05
−20 −10 0 1020304050607080
SIR (dB)
Analy
Monte Carlo
PdfoftheSIR
Figure 3: Plots of the pdf of the SIR for different environments.
Inbuilding
obstructed
Outdoor shadowed
urban area
Outdoor
free space
0
0.1
0.2
0.3
0.4
0.5
0.6
0.7
0.8
0.9
1
Cdf
−20 −10 0 1020304050607080
SIR (dB)
Analy
Monte Carlo
Cdf of the SIR
Figure 4: Plots of the pdf of the SIR for different environments .
with best LOS condition of outdoor free space environment
the probability that the SIR exceeds the target SIR is 85%
allowing the use of higher order modulation. Therefore
from the results in Figure 4, it can be deducted that the
analytical work presented in the paper can be used in
determining the boundaries for varying the modulation
order. A similar work of determining the boundaries for
adaptive modulation was presented by Goldsmith et al. and
M S. Alouini [11] assuming Nakagami distribution thus
ignoring the shadowing effect, the pdf presented here can be
used to extend the results presented in [11].
EURASIP Journal on Wireless Communications and Networking 7
Table 2: System parameters for Figure 3.
Parameter Inbuilding obstructed Outdoor shadowed urban Outdoor free space
R
c
100 m 100 m 100 m
R
ac
500 m 500 m 500 m
v
xz
10 dB 8 dB 10 dB
v
yz
10 dB 10 dB 10 dB
γ
xz
434
γ
yz
444
m
xz
310.5
m
yz
0.5 0.5 0.5
Ω
xz
4 dB 4 dB 4 dB
Ω
yz
6 dB 4 dB 6 dB
Table 3: System parameters for Figure 4.
Parameter Inbuilding obstructed Outdoor shadowed urban Outdoor free space
R
c
100 m 100 m 100 m
R
ac
500 m 500 m 500 m
v
xz
10 dB 8 dB 10 dB
v
yz
10 dB 10 dB 10 dB
γ
xz
434
γ
yz
444
m
xz
310.5
m
yz
0.5 0.5 0.5
Ω
xz
4 dB 4 dB 4 dB
Ω
yz
6 dB 4 dB 6 dB
6. Conclusion
The main contribution of this paper is the derivation of
the pdf of the SIR in a self-organizing wireless system,
where network planning is minimal, without recourse to
Monte Carlo simulations. The derivation was carried out
using a generalized path loss model that accounts for both
large and small- scale path loss. The use of Nakagami-m
distribution for the fading channel gives the flexibility to
use Rayleigh or different channel fading models for the
desired and interfering links. The results obtained show
excellent agreement with the Monte Carlo based results. The
SIR derivation was in turn used to derive the pdf of the
SINR. The SINR derivation is important in non-interference
limited environment. These derivations can be further used
in applications where the knowledge of SIR is necessary, such
as link adaptation algorithms and cognitive radio design. The
analytical derivation of the pdf from a single interferer in this
paper lays a solid foundation to calculate the statistics from
multiple interferers.
Acknowledgments
This work is supported by DFG Grant HA 3570/1-2
within the program SPP-1163, TakeOFDM. Harald Haas
acknowledges the Scottish Funding Council’s support of
his position within the Edinburgh Research Partnership
in Engineering and Mathematics between the university
of Edinburgh and Heriot Watt university. This work was
presented in part at the IEEE International Symposium
of Personal, Indoor and Mobile Radio Communications
(PIMRC) 2008, Cannes,France.
References
[1] Z. Yun and M. F. Iskander, “Progress in modeling challeng-
ing propagation environments,” in Proceedings of the IEEE
Antennas and Propagation Society International Symposium
(APS ’04), vol. 4, pp. 3637–3640, Anaheim, Calif, USA, 2004.
[2] T. S. Rappaport, Wireless Communications: Principles and
Practice, Prentice-Hall PTR, Englewood Cliffs, NJ, USA, 2nd
edition, 2001.
[3] M S. Alouini and A. Goldsmith, “Capacity of Nakagami
multipath fading channels,” in Proceedings of the IEEE Vehic-
ular Technology Conference (VTC ’97), vol. 1, pp. 358–362,
Phoenix, Ariz, USA, May 1997.
[4] A. Spilling, A. Nix, M. Beach, and T. Harrold, “Self-
organisation in future mobile communications,” IEE Electron-
ics & Communication Engineering Journal, vol. 12, pp. 133–
147, 2000.
[5] C. Tellambura, “Cochannel interference computation for
arbitrary Nakagami fading,” IEEE Transactions on Vehicular
Technology, vol. 48, no. 2, pp. 487–489, 1999.
[6] Q. T. Zhang, “Outage probability in cellular mobile radio due
to Nakagami signal and interferers with arbitrary parameters,”
IEEE Transactions on Vehicular Technology,vol.45,no.2,pp.
364–372, 1996.
8 EURASIP Journal on Wireless Communications and Networking
[7] M. Zorzi, “On the analytical computation of the interference
statistics with applications to the performance evaluation of
mobile radio systems,” IEEE Transactions on Communications,
vol. 45, no. 1, pp. 103–109, 1997.
[8] A. Papoulis, Probability, Random Variables, and Stochastic
Processes, McGraw-Hill, New York, NY, USA, 3rd edition,
1991.
[9] M. Nakagami, “The m-distribution: a general formula of
intensity distribution,” in Statistical Methods of Radio Wave
Propagation,W.C.Hoffman, Ed., pp. 3–36, Pergamon, New
York, NY, USA, 1960.
[10] I. K. Eltahir, “The impact of different radio propagation
models for mobile ad hoc NETworks (MANET) in urban
area environment,” in Proceedings of the 2nd International
Conference on Wireless Broadband and Ultra Wideband Com-
munications (AusWireless ’07), p. 30, Sydney, Australia, August
2007.
[11] M S. Alouini and A. J. Goldsmith, “Adaptive modulation
over Nakagami fading channels,” Wireless Personal Communi-
cations, vol. 13, no. 1, pp. 119–143, 2000.