Báo cáo hóa học: " Research Article Downlink Coexistence Performance Assessment and Techniques for WiMAX Services from High Altitude Platform and Terrestrial Deployments" pot
Bạn đang xem bản rút gọn của tài liệu. Xem và tải ngay bản đầy đủ của tài liệu tại đây (861.44 KB, 7 trang )
Hindawi Publishing Corporation
EURASIP Journal on Wireless Communications and Networking
Volume 2008, Article ID 291450, 7 pages
doi:10.1155/2008/291450
Research Article
Downlink Coexistence Performance Assessment and
Techniques for WiMAX Services from High Altitude Platform
and Terrestrial Deployments
Z. Yang,
1
A. Mohammed,
1
T. Hult,
1
and D. Grace
2
1
Department of Signal Processing, Blekinge Institute of Technolog y (BTH), 372 35 Ronneby, Sweden
2
Department of Electronics, University of York, York YO10 5DD, UK
Correspondence should be addressed to Z. Yang,
Received 1 November 2007; Revised 30 April 2008; Accepted 6 August 2008
Recommended by Shlomi Arnon
We investigate the performance and coexistence techniques for worldwide interoperability for microwave access (WiMAX)
delivered from high altitude platforms (HAPs) and terrestrial systems in shared 3.5 GHz frequency bands. The paper shows that
it is possible to provide WiMAX services from individual HAP systems. The coexistence performance is evaluated by appropriate
choice of parameters, which include the HAP deployment spacing radius, directive antenna beamwidths based on adopted antenna
models for HAPs and receivers. Illustrations and comparisons of coexistence techniques, for example, varying the antenna pointing
offset, transmitting and receiving antenna beamwidth, demonstrate efficient ways to enhance the HAP system performance while
effectively coexisting with terrestrial WiMAX systems.
Copyright © 2008 Z. Yang et al. This is an open access article distributed under the Creative Commons Attribution License, which
permits unrestricted use, distribution, and reproduction in any medium, provided the original work is properly cited.
1. INTRODUCTION
High altitude platforms (HAPs) are either quasi-stationary
airships or aircraft operating in the stratosphere, 17–22 km
(72 000ft) above the ground and have been suggested as a
way of providing the third generation (3G) and mm-wave
broadband wireless access (BWA) [1–3]. A HAP trial held by
European Union (EU) CAPANINA project has successfully
tested the usage of a HAP to send data via Wi-Fi to a coverage
area 60 km in diameter [4]. HAP systems have many useful
characteristics including high-receiver elevation angle, line
of sight (LOS) transmission, large coverage area and mobile
deployment, and so forth. These characteristics help making
HAPs competitive when compared to conventional terrestrial
and satellite systems, and furthermore they can contribute to
a better overall system performance, greater system capacity,
and cost-effective deployment.
Providing WiMAX from HAPs in sub-11 GHz bands is
an innovative way of providing broadband communication
services. WiMAX is a standard-based wireless technology for
providing high-speed, last-mile broadband connectivity to
homes and businesses for wireless connections ranging from
2 to 66 GHz in frequency band [5]. Related research [6–
8] has been carried out to examine the WiMAX downlink
performance from an individual HAP system and coexisting
with terrestrial systems. Reference [6] has examined the
coexistence performance of a single HAP and a single-
terrestrial base station in terms of modulation techniques.
Reference [7] has examined the performance of an individ-
ual HAP system delivering WiMAX services. A seven-cell
planning module has been adopted in [7]. The outcome
from previous research shows that it is possible to deploy
WiMAX from HAPs with the acceptable quality of downlink
connection.
In this paper, we focus on coexistence techniques and
improvements based on our preliminary results in [8]. The
paper is organized as follows. Section 2 gives a description
of the proposed coexistence system model, propagation and
antenna models for the HAP and terrestrial deployment,
and important system parameters. Criteria employed to
measure the interference and system performance, for exam-
ple, downlink carrier-to-noise ratio (CNR) and downlink
carrier-to-interference plus noise ratio (CINR) are defined.
In Section 3, the system performance is evaluated for fixed
2 EURASIP Journal on Wireless Communications and Networking
Desired signal
Undesired signal
Boresight of HAP antenna
Angle from the boresight
Radius coverage area
Separation distance
T-BS
Te r r e s t r i a l c e l l
Separation
distance
User (x, y)
HAP coverage area
ϕ, θ
R
R
T-BS
SPP
R
HAP
HAP
θ
U
ϕ
H
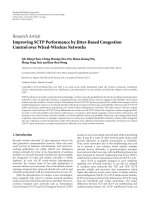
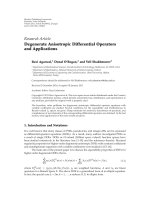
Figure 1: Coexistence model of providing WiMAX from a HAP and
terrestrial base station.
and variable separation distances between the HAP and ter-
restrial cell. In Section 4,animprovedsystemperformance
and analysis is shown under varying the spacing distance
of a single-HAP deployment, testing different antenna
beamwidths, and roll-off factors. Finally, conclusions are
given in Section 5.
2. SYSTEM EVALUATION MODEL AND PARAMETERS
The system model to evaluate the coexistence environment is
shown in Figure 1. It is composed of a HAP-base station (H-
BS), a terrestrial base station (T-BS), and a receiver. The HAP
base station is assumed to be located at an altitude of 17 km
above the ground with a radius of coverage area equal to
30 km. The terrestrial base station is deployed on the ground
with an appropriate separation distance 40 km away from the
sub-platform point (SPP) of the HAP on the ground.
Thereceiver,whichwereferasa“user”shownin
Figure 1, is assumed to be located on the ground on a regular
grid with 1 km separation distance. This allows coverage plot
of performance to be evaluated. After the performance is
evaluated at one point, the user will be moved to the next
point and the same simulation test will be carried out again.
At anytime, only one user from the same system is considered
to be involved in the simulation, so interference between
multiple users is not taken into account. A 1 km separation
distance has been chosen to perform the evaluation because
the CNR or CINR does not change significantly over such
distances, while also ensuring that the computation burden
is not heavy especially when the coverage area is extended
further.
2.1. HAPs and user antenna radiation pattern
The gains of antennas of H-BS A
H
(ϕ)atanangleϕ with
respect to its boresight and the ground receiver antenna
A
U
(θ)atanangleθ away from its boresight are approximated
by a cosine function raised to a power roll-off factor n with
a flat side lobe level. They are represented in (1)and(2),
40383634323028262422
X (dB)
0
0.2
0.4
0.6
0.8
1
Pr (CNR (dB)<X)
CDF of CNR with isotropic and directive
antenna patterns in HAP coverage area
CNR
iso
CNR
directive
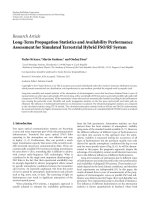
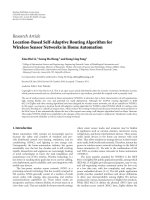
Figure 2: CDF of CNR performance with isotropic and directive
antenna patterns.
respectively [9]:
A
H
(ϕ) = G
H
max
cos(ϕ)
n
H
, s
f
,
(1)
A
U
(θ) = G
U
max
cos(θ)
n
U
, s
f
,
(2)
where G
H
and G
U
are the boresight gain of the H-BS
antenna and receive user antenna, respectively. n
H
and n
U
control the rate of power roll-off of the antenna main lobe
individually. S
f
in dB is a notional flatsidelobe floor. The
boresight of the H-BS antenna points at the center of its
coverage area. A circular symmetric radiation pattern in
[9] is used for simulations. Initially, we specify that the
10-dB roll-off beamwidth of HAP antenna is equal to the
diameter of its coverage area. Therefore, more power can be
centrally radiated inside the HAP coverage area and produce
less interference to the terrestrial WiMAX deployment from
HAPs.
A cumulative distribution function (CDF) of CNR with
different antenna patterns is shown in Figure 2. This figure
represents the CNR performance achieved from adopting
isotropic and directive antenna patterns, respectively, by
assuming that a user is situated at each point inside the HAP
coverage area. It can be seen that adopting a directive antenna
on the HAP, approximately a 3 dB increase is achieved on
average over the entire coverage area. Furthermore, because
the directional antenna points at the center of the coverage
area, the CNR is decreased at the edge of coverage (EOC)
area. Because the HAP produces less interference toward the
adjacent terrestrial system outside the HAP coverage area,
and more power is radiated into the HAP coverage area.
2.2. Pathloss and important parameters
The propagation model used for H-BS is the free space path
loss (FSPL) PL
H
shown in (3), where d is distance from the
transmitter and λ is the signal wavelength. Until now, no
specific propagation model has been established for HAPs
at these frequencies, and therefore FSPL has been widely
used in current research. Propagation models have developed
for HAPs in mm-wave band at 47/48 GHz, but they are not
Z. Yang et al. 3
1
8
1
18
18
20
20
20
20
22
22
22
22
24
24
24
24
24
24
24
24
24
26
26
26
26
26
26
26
26
28
28
28
28
28
28
28
30
30
30
3
0
30
30
32
32
32
32
32
34
34
34
34
36
36
36
3020100−10−20−30
Distance (km)
−30
−20
−10
0
10
20
30
Distance (km)
CINR
H
with interference from T-BS
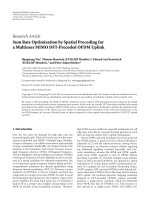
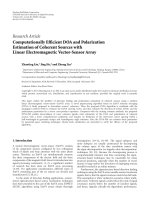
Figure 3: CINR
H
performance contour plot of HAP (marked as
“o”) coverage area.
applicable in the 3.5 GHz frequency band. It should also be
noted that directional user antennas are likely to be installed
at a fixed location with this scenario. High-elevation angles
owing to the relatively small radius of HAP coverage also
mean LOS paths to the HAP are a reasonable assumption.
Therefore, FSPL is used in this article, and diffraction and
shadowing are not explicitly considered, without loss of
general validity.
Furthermore, the time delay of user at the EOC area
of HAP with a radius at 30 km is 0.1 millisecond, which is
broadly comparable to terrestrial systems:
PL
H
=
4πd
λ
2
. (3)
The propagation pathloss model PL
T
is shown in (4)for
terrestrial signal propagation model as presented in [10, 11].
This model corrects the Hata-Okumura model to account
for limitations in communication with lower-base station
antenna heights and higher frequencies
PL
T
= PL
m
+ ΔPL
f
+ ΔPL
h
,(4)
where PL
T
is composed of a median path loss PL
m
,
receiver antenna height correction term ΔPL
h
, and frequency
correction term ΔPL
f
in [10]. The two correction terms
ΔPL
h
and ΔPL
f
are defined to make PL
T
more accurate by
accounting for the antenna heights and frequencies. In this
paper, parameters in the suburban environment (category
Cin[10]) are used for simulations of T-BS deployment
environment. Simulation parameters are shown in Ta ble 1 .
12
12
12
14
14
14
14
14
16
16
16
16
16
16
16
16
18
18
18
18
18
1
8
18
18
20
20
20
20
20
20
20
20
22
22
22
22
22
22
22
24
24
24
24
24
24
26
26
26
26
26
28
2
8
28
28
28
30
30
30
30
30
32
32
32
32
34
34
34
34
36
36
36
6420−2−4−6
Distance (km)
−6
−4
−2
0
2
4
6
Distance (km)
CINR
T
with interference from H-BS
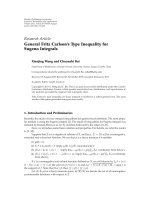
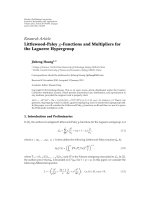
Figure 4: CINR
T
performance contour plot of T-BS (marked as
“x”) coverage area.
Table 1: Important system simulation parameters.
Parameters H-BS T-BS
Coverage radius 30 km (R
H
)7km(R
T
)
Tr an sm i tt er he ig h t 1 7 k m (H
H
)30m(H
T
)
Transmitter power 40 dBm (P
H
)40dBm(P
T
)
Antenna efficiency 80%
User roll-off rate 58 (n
H
)
User boresight gain 18 dBi (G
U
)
Sidelobe level
−30 dB (s
f
)
Bandwidth 7 MHz
Frequency 3.5 GHz
Noise power
−100.5 dBm (N
F
)
2.3. Interference analysis
2.3.1. Terrestrial interferece to HAP system analysis
Based on the coexistence environment in Figure 1,we
propose an interference analysis scenario to evaluate HAP
WiMAX system performance. The test user is assumed to
communicate with the HAP and receive interference from
the terrestrial base station. The system performance could be
determined by CNR in (5) and CINR in (6), respectively [8]:
CNR
H
=
C
N
=
P
H
A
H
(ϕ)A
U
(θ)PL
H
N
F
,
(5)
CINR
H
=
C
N + I
=
P
H
A
H
(ϕ)A
U
(θ)PL
H
N
F
+ P
T
A
T
A
U
(θ)PL
T
,
(6)
4 EURASIP Journal on Wireless Communications and Networking
Desired signal
Undesired signal
T-BS
H-BS
Left edge Right edge
HAP edge
Decreasing the separation distance
Figure 5: EOC area performance evaluation scenario with variable separation distances.
−40−30−20−10010203040
Separation distance (km)
0
5
10
15
20
25
30
CINR (dB)
CINR at the EOC area of H-BS & T-BS
CINR
H
CINR
T
right-edge
CINR
T
left-edge
Figure 6: CINR at the EOC area of H-BS and T-BS with decreasing
separation distance.
where
(i) P
H
is the HAP transmission power.
(ii) P
T
is the interfering T-BS transmission power.
(iii) A
H
(ϕ)andA
T
are the transmission gains of H-BS and
T-BS antenna, respectively.
(iv) A
U
(θ) is the receiver gain of the user antenna
receiving signals from the HAP and interfering T-BS.
(v) N
F
is the thermal noise power.
2.3.2. HAP interference to terrestrial system analysis
Similarly, we assume that the user communicates withthe
terrestrial system and receives interference from HAP system.
The system performancecan be determined by CNR in (7)
and CINR in (8), respectively [8]:
CNR
T
=
C
N
=
P
T
A
T
A
U
(θ)PL
T
N
F
,
(7)
CINR
T
=
C
N + I
=
P
T
A
T
A
U
(θ)PL
T
N
F
+ P
H
A
H
(ϕ)A
U
(θ)PL
H
.
(8)
3. COEXISTENCE PERFORMANCE OF HAP AND
TERRESTRIAL WIMAX SYSTEM
3.1. System performance analysis with fixed
separation distances
In this scenario, the terrestrial base station is deployed on
the ground with an appropriate separation distance 40 km
away from the SPP of the HAP on the ground. The CINR
performance is shown in Figures 3 and 4 to highlight the
interference effects from T-BS.
The CINR
H
curve maintains a circular symmetry, since
the signal from T-BS is heavily attenuated by the sidelobe
of the user’s antenna when it communicates with HAP. In
contrast, the left half coverage area of T-BS, the CINR
T
curve,
shrinks toward the base station under the interference from
H-BS because the signal from H-BS enters into the user’s
antenna main lobe and there is no shadowing effect included,
which results in higher interference. However, on the other
half of the coverage area, the interference signal always
enters into the user antenna’s sidelobe which attenuates
the interference, so here the contours are relatively circular.
In this case, the HAP coverage area is less susceptible to
interference.
3.2. System performance analysis with variable
separation distances
It is important to evaluate the system performance in
different separation distance situations. This step will help
justifying deployment of WiMAX broadband from T-BS
and H-BS at the same time in an appropriate service area.
This case is modeled in Figure 5. The separation distance
is initially assumed to be 40 km, then we decrease the
separation distance which brings the T-BS coverage area
closer to the H-BS coverage area. When the separation
distance becomes negative, the two coverage areas start to
overlap. In this scenario, performance is only evaluated at the
right- and left-EOC area of T-BS and the left-EOC area of H-
BS.
The CINR
H
curve in Figure 6 varies slowly until the
separation distance decreases to zero. When the terrestrial
system coverage area starts to overlap the edge of H-BS
coverage area (where separation distance is equal to 0 km),
CINR
H
falls rapidly below 0 dB since the user on the EOC
area of H-BS is much closer to the T-BS and receives much
more interference power. When the coverage area of the
Z. Yang et al. 5
Antenna boresight
Desired signal
Undesired signal
T-BS
H-BS
User (x, y)
One base station cell
HAP coverage area
Spacing
distance
−50 km −20 km
−10 km
0km
SPP
Figure 7: Illustration of changing of HAP spacing radius while keeping the antenna pointing offset at the center of serving area.
403020100−10−20−30−40
Distance from the boresight of HAP (km)
(spacing distance
= 0km)
−20
−10
0
10
20
Gain (dB)
HAP antenna gain with different spacing
distance and beamwidth
−3
−10
−30
EOC EOC
(a)
403020100−10−20−30−40
Distance from the boresight of HAP (km)
(spacing distance
=−10 km)
−40
−20
0
20
Gain (dB)
−3
−10
−30
EOC EOC
(b)
403020100−10−20−30−40
Distance from the boresight of HAP (km)
(spacing distance
=−20 km)
−40
−20
0
20
Gain (dB)
−3
−10
−30
EOC EOC
BW rolloff
=−3dB
BW rolloff
=−10 dB
BW rolloff
=−30 dB
(c)
Figure 8: HAP antenna gain with different spacing distance (0 km,
−10 km, −20 km) and different beamwidth (BW) roll-off (−3dB,
−10 dB, −30 dB).
45403530252015105
X (dB)
0
0.1
0.2
0.3
0.4
0.5
0.6
0.7
0.8
0.9
1
Pr (CINR)<X(dB)
CDF of CINR performance in the HAP coverage area
BW
= 121 degree; BW rolloff =−3dB
BW
= 72 degree; BW rolloff =−10dB
BW
= 43 degree; BW rolloff =−30dB
Figure 9: CINR
H
performance under different HAP antenna
beamwidths.
terrestrial WiMAX system is totally contained inside the
coverage area of H-BS, the CINR
H
(at the EOC area of H-BS)
rapidly rises to the same level as before. For the EOC area of
T-BS, CINR
T
on the right of the EOC always behaves better
than the CINR
T
on the left of the EOC until the separation
distance decreases to
−7 km, which means the T-BS is just
located in the left EOC area of H-BS. It is because the signal
from H-BS enters into the test user’s antenna main lobe on
the left EOC which results in higher interference and lower
CINR.
4. COEXISTENCE TECHNIQUES OF HAP AND
TERRESTRIAL SYSTEMS
Based on the coexistence model proposed in Section 2, dif-
ferent coexistence and deployment techniques for reducing
6 EURASIP Journal on Wireless Communications and Networking
9080706050403020100
Antenna beamwidth (deg) specified by the roll off
10
20
30
40
50
60
70
Mean CINR (dB)
Mean CINR
H
inside the HAP coverage area against
variable user antenna beamwidth
User antenna rolloff
=−3dB
User antenna rolloff
=−10 dB
User antenna rolloff
=−15 dB
Figure 10: CINR
H
performance against increased user antenna
beamwidth.
interference from HAPs to terrestrial WiMAX system are
investigated in this section.
4.1. Varying HAP spacing radius
In the previous investigations, we assume that SPP of the
HAP is in the center of the HAP coverage area and it has
been shown to exhibit good system performance. Since a
directional antenna is used on the HAP, it could allow HAPs
to be deployed in the different parts of sky while keeping the
boresight of antenna pointing at the desired coverage area
[2, 12]. Furthermore, in practice it is hard to keep HAPs
absolutely stationary above the center of the coverage area,
and we need to consider the system performance under the
changeable HAP spacing distance, which means that the SPP
of HAP is not always overlapping the center of its service
area. The location of the T-BS is fixed at 50 km away from the
center of the HAP coverage area. This scenario is illustrated
in Figure 7.
As the HAP antenna is not pointing at the SPP of HAP
coverage area due to the variable HAP spacing distance,
the antenna gain across the HAP coverage area will change
accordingly. From Figure 8, we could see the antenna gain
with different spacing distances. It shows that curves fall
more rapidly to the sidelobe level with the wider spacing
distance on the left side of the coverage area, for example,
when the spacing radius is equal to
−20 km, the signal from
the left edge of the coverage area will enter into its sidelobe
level. In this case, if the T-BS is deployed on the left side of
the HAP coverage area as shown in Figure 8, users outside the
HAP coverage area will receive an interfering signal coming
from the side lobe of the HAP antenna rather than the
main lobe. Interference signals coming from terrestrial base
stations are also suppressed by the HAP antenna sidelobe. On
the right side of the HAP coverage area, the HAP antenna
curve falls more slowly compared with the zero spacing
distance case, which will provide the higher gain with better
performance to the users using HAP services. Interference
signals coming from terrestrial base stations are decreased
since they undergo a longer distance to the HAP antenna
with a higher pathloss. Considering the efficient utilization
of the antenna payload, this technique could be used in a
multiple HAP deployment to serve multiple cells from HAPs
by suppressing interfering signals into the sidelobe of the
HAP antenna.
4.2. Varying HAP antenna beamwidth
The antenna beamwidth is a parameter affecting system
performance. It determines the directivity of the antenna
and hence controls the footprint on the ground. As shown
in Figure 8, we can see a narrow beamwidth can bring a
high-peak gain and rapid roll-off over the coverage area.
At the edge of the HAP coverage area, the antenna gain
is decreased to an appropriate level to create an acceptable
coexistence environment with terrestrial WiMAX communi-
cation deployment.
Different antenna beamwidths are investigated in
Figure 9 to show an improvement, which can be achieved
by decreasing the HAP antenna beamwidth. When the
beamwidthisnarrowedto43degrees,lessthan90%
coverage area achieves a CINR of 35 dB and less than 10%
area achieves a CINR of 10 dB at the EOC area. Compared
with the 43-degree beamwidth performance, a 72-degree
beamwidth antenna, which is adopted for simulation,
gives 50% area inside the HAP coverage a higher CINR of
25 dB and a higher CINR at the edge of coverage area. The
72-degree beamwidth will also provide a capability to extend
the HAP coverage area by offering better link budgets at the
edge of coverage.
4.3. Varying the user antenna beamwidth
Similar to changing the HAP antenna beamwidth, varying
the user antenna beamwidth is also an effective means to
improve the system performance as shown in Figure 10.We
can see that with a narrower antenna beamwidth of the
receiver, the CINR performance will be improved gradually.
For example, the 17-degree beamwidth selected in the
simulation achieves a mean CINR of 23 dB inside the HAP
coverage area, when we specify that it is equal to its half-
power beamwidth (roll-off at
−3 dB). If we consider the
movements of HAPs and receivers, a narrower beamwidth
of the user antenna will require a higher-antenna pointing
accuracy.
5. CONCLUSIONS
In this paper, we presented the results of delivering WiMAX
at 3.5 GHz band from HAPs in shared frequency bands with
terrestrial WiMAX deployments. Coexistence performance
was evaluated in the fixed and variable separation distance
Z. Yang et al. 7
cases between coverage areas of the HAP and terrestrial
base stations. It was illustrated that delivering WiMAX
from HAPs was effective and stable under the interference
from terrestrial WiMAX deployments in our coexistence
scenario. Different coexistence techniques for the downlink
performance were proposed and evaluated. These techniques
included varying the HAP spacing radius, HAP antenna
beamwidth, and the user antenna beamwidth. Simulation
results have shown that efficiently utilizing these parameters
can achieve a better HAP system performance, while at the
same time coexisting with the terrestrial WiMAX system.
REFERENCES
[1] J J. Huang, W T. Wang, and H W. Ferng, “Uplink capacity
enhancement for an integrated HAPS-terrestrial CDMA sys-
tem,” IEEE Communications Letters, vol. 11, no. 1, pp. 10–12,
2007.
[2]D.Grace,J.Thornton,G.Chen,G.P.White,andT.C.
Tozer, “Improving the system capacity of broadband services
using multiple high-altitude platforms,” IEEE Transactions on
Wireless Communications, vol. 4, no. 2, pp. 700–709, 2005.
[3] G. M. Djuknic, J. Freidenfelds, and Y. Okunev, “Estab-
lishing wireless communications services via high-altitude
aeronautical platforms: a concept whose time has come?” IEEE
Communications Magazine, vol. 35, no. 9, pp. 128–135, 1997.
[4] BBC, “Broadband net goes stratospheric,” 2005, http://news
.bbc.co.uk/1/hi/technology/4354446.stm.
[5] IEEE Standard 802.16-2004, June 2004.
[6] P. Likitthanasate, D. Grace, and P. D. Mitchell, “Coexistence
performance of high altitude platform and terrestrial systems
sharing a common downlink WiMAX frequency band,”
Electronics Letters, vol. 41, no. 15, pp. 858–860, 2005.
[7] B. T. Ahmed, “WiMAX in high altitude platforms (HAPs)
communications,” in Proceedings of the 9th European
Conference on Wireless Technology (ECWT ’06), pp. 245–248,
Manchester, UK, September 2006.
[8] Z. Yang, D. Grace, and P. D. Mitchell, “Downlink performance
of WiMAX broadband from high altitude platform and
terrestrial deployments sharing a common 3.5 GHz band,” in
Proceedings of the IST Mobile and Wireless Communications
Summit, Dresden, Germany, June 2005.
[9] J. Thornton, D. Grace, M. H. Capstick, and T. C. Tozer,
“Optimizing an array of antennas for cellular coverage from
a high altitude platform,” IEEE Transactions on Wireless
Communications, vol. 2, no. 3, pp. 484–492, 2003.
[10] IEEE Standard 802.16a-2003, “Modifications and additional
physical layer specifications for 2-11GHz,” March 2003.
[11] V. Erceg, L. J. Greenstein, S. Y. Tjandra, et al., “An empirically
based path loss model for wireless channels in suburban envi-
ronments,” IEEE Journal on Selected Areas in Communications,
vol. 17, no. 7, pp. 1205–1211, 1999.
[12] G. Chen, D. Grace, and T. C. Tozer, “Performance of
multiple high altitude platforms using directive HAP and user
antennas,” Wireless Personal Communications,vol.32,no.3-4,
pp. 275–299, 2005.