Báo cáo hóa học: " Research Article A Study of Gas and Rain Propagation Effects at 48 GHz for HAP Scenarios" doc
Bạn đang xem bản rút gọn của tài liệu. Xem và tải ngay bản đầy đủ của tài liệu tại đây (3.33 MB, 7 trang )
Hindawi Publishing Corporation
EURASIP Journal on Wireless Communications and Networking
Volume 2008, Article ID 734216, 7 pages
doi:10.1155/2008/734216
Research Article
A Study of Gas and Rain Propagation Effects at
48 GHz for HAP Scenarios
S. Zvanovec, P. Piksa, M. Mazanek, and P. Pechac
Department of Electromagnetic Field, Faculty of Electrical Engineering, Czech Technical University in Prague, Technicka 2,
166 27 Prague 6, Czech Republic
Correspondence should be addressed to S. Zvanovec,
Received 31 October 2007; Accepted 18 March 2008
Recommended by Marina Mondin
The atmosphere and rainfall significantly limit the performance of millimeter wave links and this has to be taken into account,
particularly, during planning of high altitude platform (HAP) networks. This paper presents results from the measurement and
simulation of these phenomena. A simulation tool from our previous analyses of terrestrial point-to-multipoint systems has been
modified for HAP systems. Based on a rainfall radar database and gas attenuation characteristics as measured by a Fabry-Perot
resonator, the performance of a simple link, two-branch diversity links, and more complicated HAP scenarios are discussed.
Copyright © 2008 S. Zvanovec et al. This is an open access article distributed under the Creative Commons Attribution License,
which permits unrestricted use, distribution, and reproduction in any medium, provided the original work is properly cited.
1. INTRODUCTION
Several features in the atmosphere greatly limit system
performance in the millimeter-wave band. This is true
mainly for HAP systems working at a frequency of 48 GHz.
Rain drops and atmospheric gas influence the propagation of
electromagnetic waves in many ways, causing an undesirable
decrease in the system’s service availability.
The work presented here is partly based on our pre-
vious research, which was focused on terrestrial point-
to-multipoint systems [1], where a terrestrial point-to-
multipoint system outage improvement probability was
derived as a function of rainfall and system parameters. A
new method was proposed to classify the spatial properties
of a rain event. The aim is to validate the applicability
of the approach to HAP scenarios, where route diversity
is applied. Rather than generating diversity gain statistics,
system performance during a rain event is simulated in both
time and space.
In order to support system performance analyses with
appropriate input parameters, a gas attenuation measure-
ment and a rainfall radar database are utilized.
The paper is organized along the following pattern. In
the first part of the paper, the gas attenuation aspects are
discussed. Measurement and simulation results together with
an enhancement of the Fabry-Perot resonator measurement
technique are then introduced. The next section deals with
the utilization of rainfall radar data during simulations of
HAP systems. The following part reveals simulation results
for a single link, two-branch diversity links, and a HAP
system network, when the gas attenuation and the rainfall
radar database are introduced. The paper concludes with a
brief summary.
2. GAS ATTENUATION MEASUREMENTS
The atmosphere limits the performance of millimeter-
wave systems. Many papers introducing gaseous attenuation
measurements can be found in the literature (e.g., [2–4]).
Most of the measurements performed to date are based on
the radiometric approach, which uses a radiometer pointed
at a satellite. Together with the attenuation, additional
atmospheric properties such as temperature, pressure, and
gas composition and humidity are collected. The attenuation
introduced by atmospheric gases can either be described
using an accurate physical model, such as Liebe’s model [5]
for frequencies ranging from 1 GHz up to 1 THz, or it can be
approximated by probabilistic models such as the ITU-R P.
676 [6] or Salonen’s models [7]. The ITU-R P.676 includes
two models for the calculation of gaseous attenuation:
(i) a complete line-by-line method, which sums the
contributions from 44 oxygen lines and 30 water-
vapor lines below 1000 GHz,
2 EURASIP Journal on Wireless Communications and Networking
(a)
Antenna
Lens
Lens
Coupling
foil
Spherical
mirror
Gas
feeder
Mirror
adjustment
Spherical
mirror
Antenna
Evacuation
(b)
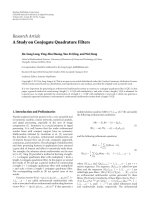
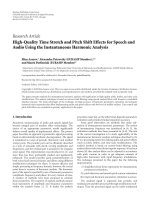
Figure 1: Fabry-Perot resonator for gas attenuation measurements: (a) equipment, (b) schematic.
(ii) simplified algorithms based on a curve-fitting to the
line-by-line calculation.
Nevertheless, in the HAP scenario, several different situa-
tions can be observed from the gas attenuation point of
view. Atmospheric properties are different for inter HAP
connections when compared to the classical HAP to ground
user links. A support measurement system is advisable for a
proper investigation of atmospheric attenuation.
The main aim of this section is to introduce a measure-
ment system with the Fabry-Perot resonator (see Figure 1)
and to discuss the results of both simulations and laboratory
measurements of gas attenuation. The equipment itself was
designed at the Czech Technical University in Prague . Several
aspects of the experiments described below supplement the
millimeter-wave high resolution spectroscopy measurement
campaign [8], which has been accomplished in cooperation
with the Institute of Chemical Technology in Prague.
2.1. Enhancements of the measurement technique
The principal virtue of laboratory measurements of atmo-
spheric gases lies in the possibility of adjusting the gas
medium in terms of the homogeneity of a particular gas
composition, and in terms of the proper distribution,
temperature, and pressure, a situation which can never be
truly achieved in the case of open range measurements.
Spectroscopy cavities, Fabry-Perot resonators [9], or very
long tubes introducing extremely precise tools compared to
the statistically-based measurements in open areas, where the
variability of the atmosphere cannot be adequately defined.
A Fabry-Perot resonator (Figure 1(a)) working from
18 GHz up to hundreds of GHz was developed for the gas
attenuation measurements. The main layout of the resonator
is depicted in Figure 1(b). It comprises a tube-shaped cavity,
two spherical mirrors positioned to set particular resonances,
and a dielectric foil placed inside a cavity. One mirror is
placed in a fixed position, while a second mirror can be
adjusted in 1 μm steps. The foil accomplishes the transition
of electromagnetic waves via dielectric lenses into and from
the perpendicularly placed feeders.
The sensitivity of the Fabry-Perot resonant cavity is
the result of its very high-quality factor. In this case, the
absorption measurement is based on the measurement and
consequential evaluation of the quality factor of the empty
and gas-filled resonator.
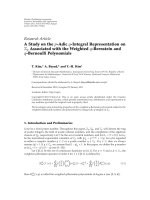
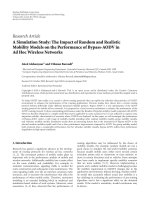
The Fabry-Perot resonator was simulated via the FEKO
electromagnetic simulator [10] using a method of moments
in frequency domain with approximations of the multilevel
fast multipole method (MLFMM) on metallic mirrors and
the uniform theory of diffraction (UTD) on dielectric
foil. The simulated resonator deployment can be seen
in Figure 2(a). In order to simplify the simulations, only
mirrors (shown squared in the direction of the x-axis) and
a coupling foil were considered. The electromagnetic field is
fedtowardthez-axis (in a downwards direction).
The data of the near field obtained from the simulation
were thereafter analysed in Matlab. The main objective was
to obtain a frequency dependence of the transferred power.
Based on these simulations, the parameters of the resonator
were derived in order to reach the highest possible quality
factor values. Performance of the Fabry-Perot resonator in
terms of the radiation pattern (i.e., scattering of energy from
the center of the coupling foil in specific directions), as sim-
ulated in FEKO, is depicted in Figures 2(b) and 2(c). In the
case of an arbitrary nonresonant frequency (see Figure 2(b)),
almost all energy is transmitted through the resonator. On
the contrary, during the resonance (Figure 2(c)), in this
particular graph at the frequency of 30 GHz, part of energy is
absorbed into the resonator, and part is reflected back to the
transmitter.
Losses observed in the Fabry-Perot resonator comprise
the measured attenuation of an inserted medium, an addi-
tional undesirable diffraction, reflection losses at the mirrors,
and coupling loss due to the dielectric foil. To properly design
the measurement equipment, these additional frequency
dependent losses have to be eliminated as much as possible.
The first of the losses, the reflection loss, was decreased
during system tuning by the 5
·10
−5
m thick golden layer
on the mirrors, which fully met the required depth of
penetration for the gold of 0.59
·10
−6
m at the lowest working
S. Zvanovec et al. 3
Spherical
mirror
Point source
with cos
24
pattern
Coupling
foil
EH near field
Y
X
Z
(a)
X
Y
Z
−10
−6.9
−3.9
−0.8
2.2
5.3
8.4
11.4
20.6
17.6
14.5
Y
X
Z
Gain (dB)
(b)
X
Y
Z
−10
−6.6
−3.2
0.2
3.6
7
10.4
24.1
20.7
17.3
13.8
Y
X
Z
Gain (dB)
(c)
Figure 2: Performance of the Fabry-Perot resonator: (a) configu-
ration, (b) results in terms of the radiation pattern as simulated
in FEKO for the nonresonant frequency, (c) as simulated for the
resonant frequency.
frequency of the resonator (18 GHz). The diffraction loss,
introducing a spilling over of electromagnetic wave at the
mirrors, was accompanied by a proper relation between the
distance and curvature of the mirrors. A stainless steel tube-
shaped cavity with a length of 0.555 m and diameter of
0.189 m, and two positioned spherical mirrors with 0.455 m
radius of curvature were utilized. The confocal deployment
of mirrors was chosen in order to meet a stability criterion for
the Fabry-Perot resonator. The last negative loss, introduced
by the coupling loss, was found to be dependent on the
thickness and material parameters of the dielectric coupling
foil. A 0.1 mm thick dielectric polythene coupling foil (see in
Figure 2(a)) was inserted inside the resonator cavity in order
−32
−30
−28
−26
−24
−22
Power (dBm)
48.106 48.108 48.11 48.112 48.114
Frequency (GHz)
Measurement
Modelling
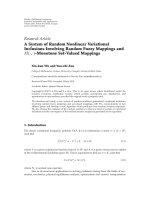
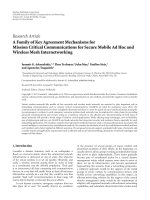
Figure 3: Comparison of measured and simulated received signal
levels at a resonant frequency of 48 GHz.
to accomplish the transition of electromagnetic waves into
and from the perpendicularly placed feeders.
It should be emphasized that the developed Fabry-Perot
resonator is suitable for a frequency range from 18 GHz
(lower frequencies are limited by diffraction losses at the
mirrors) to 400 GHz, where coupling losses at the dielectric
foil predominate.
Energy is led into and out of the resonator via dielectric
lenses (placed in the two opposite side windows of the
resonator; one of these windows can be seen in Figure 1),
whose parameters had to be derived using CST microwave
studio [11] simulations. It has to be emphasized that this
software was used because a horn antenna and dielectric
lens can be simulated more effectively in CST in the time
domain (only a single simulation needed for the broadband
response) than in FEKO in the frequency domain (above
discussed simulations). The main demands were to ensure
the best Gaussian distribution of the electromagnetic field
coupling into the resonator, to keep a uniform waveform
inside the resonator, and to avoid saturation of the measured
gas due to the improper focusing of the energy. The optimal
field distribution on the coupling foil and the position of the
feeding antenna in front of the lens were also optimized (in
accordance with [12]). Teflon (PTFE) with ε
r
= 2.02 and
tgδ
= 0.003 was utilized for the lenses. The optimal lens
shape, having a spherical inner surface and an elliptical outer
surface, was derived.
2.2. Gas attenuation measurement results
Measurements of the gas attenuation were accomplished
with the Fabry-Perot resonator. The comparison of the
measured and simulated received signal levels of Fabry-
Perot resonator filled with standard laboratory air at the
resonant frequency of 48 GHz is shown in Figure 3. Although
both the measured and the simulated resonance have similar
4 EURASIP Journal on Wireless Communications and Networking
shape and the same resonant frequency, an undesired slight
difference in the peaks at the resonant frequency can be
observed in the graph. It is caused by the fact that it was
impossible to get exact properties of the air medium for the
simulation tool in this test measurement.
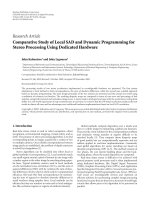
A comparison of measured gas attenuation and the
attenuation derived by ITU-R P.676 [6] for the standard
atmosphere at a temperature of 293.15 K, a pressure of
1013 MPa, and a water vapor density of 7.5 g/m
3
is depicted
in Figure 4. In this case, the gas attenuation was measured
in the frequency range from 47.9 GHz to the 48.2 GHz
assigned for HAP downlink connections (ITU-R F.1550
[13]). Differences between the measured and calculated
values can be caused by additional gas molecules in the
measured gas medium, which are not considered in ITU (it
comprises oxygen and water-vapor lines only). For example,
the resonance of an asymmetric molecule of H
2
Scanbe
observed near the frequency 48 GHz [14].
3. RAINFALL RADAR DATA
Rain events can affect the propagation of electromagnetic
waves in the millimeter wave band much more significantly
than gas attenuation. For a proper assessment of the rain’s
influence, it is crucial not to limit oneself only to statistics
valid for a single earth station to HAP link. Time and spatial
dependences should also be taken into account. Rainfall
radardataforagivenregion[15] were used as input for
the simulations. Data were taken from a modern weather
radar network (CZRAD) consisting of two state-of-the-art
Doppler C-band weather radars, which cover the entire area
of the Czech Republic with volume scans of up to 256 km in
range [16]. The principle of Doppler radars is based on the
transmission of electromagnetic energy into the atmosphere
(hundreds of pulses per second) and the reception of
backscattered energy. Doppler radars provide measurements
not only of the radar reflectivity but also of the frequency
change of the backscattered signal, which can be used to
determine the radial velocity of atmospheric precipitation.
For specific purpose, radar images with dimensions of 50
×
50 km, a 1 km grid, and 1-minute time steps were generated.
Areas of up to 150
× 150 km can be analyzed from these
rainfall radar scans.
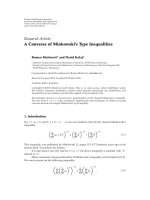
A rain event database containing over 1.5 million radar
images for the Czech Republic for the period from 2002–
2004 was created for the simulations [1]. One of the rain
scans from the middle of the rain event in 2003 is depicted in
Figure 5. Three significant intensive rain cells with rain rates
higher than 60 mm/hour were observed.
4. HAP PERFORMANCE SIMULATION
In order to fully analyze propagation issues for HAP systems
at the frequency of 48 GHz, a propagation simulation tool
was developed. The core of the tool was incorporated from
our previous work [1] dealing with terrestrial point-to-
multipoint networks. Several modifications had to be made
in order to adapt the computation models to HAP scenarios.
The possibility of specifying the positions and distributions
0
0.05
0.1
0.15
0.2
0.25
0.3
0.35
0.4
0.45
0.5
Gas attenuation (dB/km)
47.947.95 48 48.05 48.1
48.15
48.2
Frequency (GHz)
Measured
ITU
Figure 4: Comparison of the measured gas attenuation to [6].
5
10
15
20
25
30
35
40
45
50
Distance (km)
5101520253035404550
Distance (km)
20
40
60
80
100
120
140
Figure 5: Rain distribution (contours) in mm/hour during a rain
event.
of both ground users and HAP stations, respectively, can be
emphasized as the main feature from a scenario deployment
point of view. This tool includes the essential parameters
for investigation of wave propagation in the millimeter-wave
band:
(i) rain characteristics—either statistically described pa-
rameters based on [17] or the above-mentioned rain-
fall radar data,
(ii) gas attenuation—this measurement was discussed in
the previous section.
Based on input parameters, several HAP propagation fea-
tures, ranging from simple link statistics up to complex
HAP network performance, can be analyzed. Results from
propagation analyses will be discussed in the following
sections.
S. Zvanovec et al. 5
4.1. Single link and two diversity links deployment
Single HAP to a ground user link suffers from temporal rain
attenuation. To combat this phenomenon, suitable rain fade
margins are set during an assessment of the link budget or
fade mitigation techniques, like power control and adaptive
coding, are implemented [18]. Nevertheless, this solution is
not always possible, particularly, for services requiring high
availability. The cumulative distribution function of rain
attenuation as analyzed for a 10 km (ground distance) link
from the user to the HAP, which was set in the attitude of
20 km, is depicted in Figure 6. The curve is valid for the
annual rain evolution over Prague, Czech Republic, in 2002.
An outage of a connection to the main HAP can be
mitigatedifusersaffected by the rain could reconnect to
another station using route diversity (the principal scenario
ofroutediversitycanbeseeninFigure 7). This is especially
true for distant users, whose links to the main HAP could
lead through a rainy area, even though these particular
users are not themselves experiencing the rain event. The
improvement in performance in dB between the single
link attenuation and the joint two links attenuation at a
given probability level is often referred as the diversity gain.
The improved availability of particular user when route
diversity is utilized can be evaluated or measured by the
joint attenuation statistics. Many researches in a similar
field have already been carried out dealing with earth-space
diversity [19] and with diversity for terrestrial point-to-
multipoint systems (e.g., [20, 21]). In [22], a method to
establish the joint site attenuation statistics for a HAP station
connected with two earth stations was developed based on
combinations of satellite earth and terrestrial approaches. An
analysis of the proper deployment of two diversity terminals
received from a single HAP station was presented. The
optimal diversity user separation has been found to be 10
to 20 km, providing 99.9% availability. A similar approach
(although more in-depth), which considered correlations of
rain attenuation distributions, was derived in [23].
The comparison of complementary cumulative distribu-
tion functions of rain attenuation for the above-discussed
single HAP to user link at 48 GHz and, newly, for two-
branch diversity links, where a user is able to connect to two
HAPs, can be seen in Figure 6 In the latter case, one of the
two diversity links was identical (d
main
= d
diversity
) to the
standalone link and the second was angularly separated by
ϕ
= 120
◦
; both links had land distance of 10 km.
The diversity gain is expressed in Tab le 1 .Itcanbeclearly
seen that a diversity gain of 1.5 dB for 99.9% availability
can be achieved using route diversity. The diversity gain has
a tendency to increase with the required availabilities (e.g.,
7.1 dB for 99.99%).
The graph we referred to above only gives an illustrative
example of the application of route diversity. The diversity
gain is dependent on link length ratios, angular separations,
and availabilities.
4.2. Utilization of route diversity in HAP systems
A more sophisticated approach involves an analysis of the
whole system within a given area. The performance of the
10
−3
10
−2
10
−1
10
0
10
1
10
2
Probability (rain attenuation > abscia) (%)
0102030405060
Rain attenuation (%)
Single link
Two diversity links
Figure 6: CDFs of rain attenuation for a single link and two-branch
diversity links with the angular separation of 120 degrees and a
ground link distance is 10 km.
Main HAP
Diversity HAP
User
d
diversity
d
main
ϕ
Figure 7: Basic scenario of the route diversity.
HAP system can be assessed in terms of outage probability
in relation to the total number of operated links. The case
discussed above, with two joined links, is now spread over
a particular area based on the assumption that each user
has the possibility of choosing another HAP station in the
event of a link outage due to rain attenuation. In this way,
HAP system performance can be studied simultaneously. In
[24], different system outages during two storms with similar
characteristics common for single links, but with different
spatial features were analyzed.
To analyze system performance, an outage improvement
probability P(%)—a parameter taken from terrestrial point-
to-multipoint system analyses [1]—was utilized. The outage
6 EURASIP Journal on Wireless Communications and Networking
Table 1: Diversity gain of two diversity links with an angular
separation of 120 degrees and a ground link distance of 10 km.
Availability (%) Diversity gain (dB)
99.000 0.4
99.900 1.5
99.950 2.0
99.970 2.5
99.990 7.1
99.995 20.5
99.997 27.9
99.999 34.4
improvement probability is defined as the percentage of users
with a successfully established diversity link out of the total
number of users receiving a signal level from the nearest HAP
below the threshold due to the rainfall. It can be expressed as
[1]follows:
P
=a
const
·
1−
ϑ −π
π −b
const
1 −
d
main
/d
div
2
·
d
main
d
div
c
const
,
(1)
where ϑ (rad) and d
main
/d
div
(–) stand for the angle
separation and the ratio of the main and diverse link lengths,
respectively. a
const
, b
const
,andc
const
are empirical parameters,
that were derived [1] to be dependent on maximum rain
rate, the rain fade margin, and the rain spatial parameter
(useful for rain spatial classification according to rain impact
on system performance).
The results of the analyses of HAP system performance
were compared to the outage improvement probability statis-
tics valid for a terrestrial system with the same parameters
[25]: transmitter power 30 dBm, HAP antenna gain 29 dBi,
ground terminal station antenna gain 39 dBi, and rain
margin 24 dB. The particular example of the comparison of
outage improvement probabilities as a function of the link
length ratio (d
main
/d
diversity
) and the angular separation (ϕ)is
for the particular rain scan as shown in Figure 8. For the sake
of clarity, specific values from Figure 8 are given in Ta ble 2 .
It can be concluded that when route diversity is utilized
a better performance improvement can be observed during a
rain event in the HAP network than in the case of a terrestrial
point-to-multipoint system. In our example, over 2.6% of
mean outage improvement probability can be obtained (up
to a peak of 5.5%; for angular separation ϕ near 180 degrees
and a main to diverse link length ratio d
main
/d
diversity
= 1/2).
5. CONCLUSION
In this paper, propagation issues related to HAP systems
working at 48 GHz were presented and their specific features
were analyzed. A Fabry-Perot resonator-based measurement
system was introduced, and simulation and measurement
results were discussed. This method can be used to study
additional gas attenuation for specific HAP to ground links
0
50
100
150
200
250
300
350
Angular separation (deg)
1/12/31/22/51/3
Main to diverse link length ratio (
−)
0
0.5
1
1.5
2
2.5
3
3.5
4
4.5
5
5.5
Figure 8: Comparison of outage improvement probabilities for
HAPandaterrestrialnetworkfortherainscanfromFigure 5.
Table 2: Specific differences between outage improvement proba-
bilities Δ(%)from Figure 8.
Link length ratio (–) Angular separation (deg) Δ(%)
1/1 90 3.0
2/3 90 1.8
2/3 180 4.9
1/2 45 2.3
1/2 90 2.6
1/2 180 5.0
and inter HAP connections in higher layers of the earth’s
atmosphere.
The rain attenuation was also analyzed taking into
account single link availability as well as the system per-
formance for more complex HAP scenarios. Simulations
of HAP system performance using route diversity during
a rain event indicated that a higher outage improvement
probability can be reached in a HAP system, when compared
to a terrestrial point-to-multipoint system.
ACKNOWLEDGMENTS
The research is a part of the activities of the Department
of Electromagnetic Field of the Czech Technical University
in Prague within the framework of the research Project of
the Ministry of Education, Youth, and Sports of the Czech
Republic no. LC06071 Centre of Quasi-Optical Systems and
Terahertz Spectroscopy.
REFERENCES
[1] S. Zvanovec and P. Pechac, “Rain spatial classification for
availability studies of point-to-multipoint systems,” IEEE
Transactions on Antennas and Propagation, vol. 54, no. 12, pp.
3789–3796, 2006.
[2] J. H. van Vleck, “The absorption of microwaves by oxygen,”
Physical Review, vol. 71, no. 7, pp. 413–424, 1947.
S. Zvanovec et al. 7
[3] J. H. van Vleck, “The absorption of microwaves by uncon-
densed water vapor,” Physical Review, vol. 71, no. 7, pp. 425–
433, 1947.
[4]H.J.Liebe,G.G.Gimmestad,andJ.D.Hopponen,“Atmo-
spheric oxygen microwave spectrum—experiment versus the-
ory,” IEEE Transactions on Antennas and Propagation, vol. 25,
no. 3, pp. 327–335, 1977.
[5] H. J. Liebe, “Modeling attenuation and phase of radio waves
in air at frequencies below 1000 GHz,” Radio Science, vol. 16,
no. 6, pp. 1183–1199, 1981.
[6] International Telecommunications Union, “Attenuation by
Atmospheric Gases,” ITU-R Recommendation, pp. 676-6,
2005.
[7] E. Salonen, S. Karhu, P. Jokela, et al., “Study of Propagation
Phenomena for Low Availability,” Final Report, ESA/ESTEC
Contract 9455/91/NL/LC(SC), 1994.
[8]P.Kania,L.St
ˇ
r
´
ıtesk
´
a, M.
ˇ
Sime
ˇ
ckov
´
a, and
ˇ
S. Urban, “Pressure
shifts of acetonitrile ground state parameters,” Journal of
Molecular Structure, vol. 795, no. 1–3, pp. 209–218, 2006.
[9] E. P. Valkenburg and V. E. Derr, “A high-Q Fabry-Perot
interferometer for water vapor absorption measurements in
the 100 Gc/s to 300 Gc/s frequency range,” Proceedings of the
IEEE, vol. 54, no. 4, pp. 493–498, 1966.
[10] “The FEKO,” o/.
[11] “The CST,” />[12] T. A. Milligan, Modern Antenna Design, Wiley-IEEE Press,
New York, NY, USA, 2nd edition, 2005.
[13] International Telecommunications Union, “Preferred Charac-
teristics of Systems in the Fixed Service Using High Altitude
Platforms Operating in the Bands 47.2–47.5 GHz and 47.9–
48.2 GHz,” ITU-R Recommendation F.1500, 2000.
[14] S. N. Ghosh and H. D. Edward, “Report No. 82,” Geo-Physics
Research Directorate, Airforce Cambridge Research Centre,
1956.
[15] Z. Sokol, “The use of radar and gauge measurements to
estimate areal precipitation for several Czech River Basins,”
Studia Geophysica et Geodaet ica, vol. 47, no. 3, pp. 587–604,
2003.
[16] P. Novak and J. Kracmar, “New data processing in the Czech
weather radar network,” in Proceedings of the 2nd European
Conference on Radar in Meteorology (ERAD ’02), vol. 1 of
ERAD Publication Series, pp. 328–330, Delft, The Netherlands,
November 2002.
[17] L. F
´
eral, H. Sauvageot, L. Castanet, and J. Lemorton,
“HYCELL—a new hybrid model of the rain horizontal distri-
bution for propagation studies: 1. Modeling of the rain cell,”
Radio Science, vol. 38, no. 3, 2003.
[18] A. Maurolagoitia, J. M. Riera, P. Garcia, and A. Benarroch,
“Performance of fade mitigation techniques in a fixed 48 GHz
HAPS network,” International Journal of Wireless Information
Networks, vol. 13, no. 1, pp. 19–30, 2006.
[19] COST 255, “Radiowave Propagation Modelling for New
Satellite Communication Services at Ku-Band and above,”
Final Report, Brussels, Belgium, 2002.
[20] K. S. Paulson, R. J. Watson, and I. S. Usman, “Diversity
improvement estimation from rain radar databases using max-
imum likelihood estimation,” IEEE Transactions on Antennas
and Propagation, vol. 54, no. 1, pp. 168–174, 2006.
[21] K. S. Paulson, “Prediction of diversity statistics on terrestrial
microwave links,” Radio Science, vol. 38, no. 3, 2003.
[22] T. Konefal, C. Spillard, and D. Grace, “Site diversity for high-
altitude platforms: a method for the prediction of joint site
attenuation statistics,” IEE Proceedings: Microwaves, Antennas
and Propagation
, vol. 149, no. 2, pp. 124–128, 2002.
[23] A. D. Panagopoulos, E. M. Georgiadou, and J. D. Kanellopou-
los, “Selection combining site diversity performance in high
altitude platform networks,” IEEE Communications Letters,
vol. 11, no. 10, pp. 787–789, 2007.
[24] S. Zvanovec and P. Pechac, “Wave propagation simulations at
48 GHz for HAPs using rainfall radar data,” in Proceedings of
the 1st COST 297—High Altitude Platforms for Communica-
tions and Other Services Workshop (HAPCOS ’06),York,UK,
October 2006.
[25] FP6—CAPANINA, “Deliverable 14—Mobile Link Propaga-
tion Aspects, Channel Model and Impairment Mitigation
Techniques,” April 2005.