Báo cáo hóa học: "Research Article Multiresolution with Hierarchical Modulations for Long Term Evolution of UMTS" pot
Bạn đang xem bản rút gọn của tài liệu. Xem và tải ngay bản đầy đủ của tài liệu tại đây (1.35 MB, 11 trang )
Hindawi Publishing Corporation
EURASIP Journal on Wireless Communications and Networking
Volume 2009, Article ID 240140, 11 pages
doi:10.1155/2009/240140
Research Article
Multiresolution with Hierarchical Modulations for
Long Term Evolution of UMTS
Am´ rico Correia,1, 2 Nuno Souto,1, 2 Armando Soares,2 Rui Dinis,1 and Jo˜o Silva1, 2
e
a
1 Instituto
2 Instituto
de Telecomunicacoes (IT), Av. Rovisco Pais, 1 Lisboa 1049-001, Portugal
¸˜
Superior de Ciˆncias do Trabalho e da Empresa (ISCTE ), Av. das Forcas Armadas, Lisboa 1649-026, Portugal
e
¸
Correspondence should be addressed to Am´ rico Correia,
e
Received 30 July 2008; Revised 10 December 2008; Accepted 26 February 2009
Recommended by Lingyang Song
In the Long Term Evolution (LTE) of UMTS the Interactive Mobile TV scenario is expected to be a popular service. By using
multiresolution with hierarchical modulations this service is expected to be broadcasted to larger groups achieving significant
reduction in power transmission or increasing the average throughput. Interactivity in the uplink direction will not be affected by
multiresolution in the downlink channels, since it will be supported by dedicated uplink channels. The presence of interactivity
will allow for a certain amount of link quality feedback for groups or individuals. As a result, an optimization of the achieved
throughput will be possible. In this paper system level simulations of multi-cellular networks considering broadcast/multicast
transmissions using the OFDM/OFDMA based LTE technology are presented to evaluate the capacity, in terms of number of TV
channels with given bit rates or total spectral efficiency and coverage. multiresolution with hierarchical modulations is presented
to evaluate the achievable throughput gain compared to single resolution systems of Multimedia Broadcast/Multicast Service
(MBMS) standardised in Release 6.
Copyright © 2009 Am´ rico Correia et al. This is an open access article distributed under the Creative Commons Attribution
e
License, which permits unrestricted use, distribution, and reproduction in any medium, provided the original work is properly
cited.
1. Introduction
Third-generation (3G) wireless systems, based on wideband
code-division multiple access (WCDMA) radio access technology, are now being deployed on a broad scale all over
the world. However, user and operator requirements and
expectations are continuously evolving, and competing radio
access technologies are emerging. Thus it was important for
3GPP to start considering the next steps in 3G evolution, in
order to ensure 3G competitiveness in a 10-year perspective
and beyond. As a consequence, 3GPP has launched the study
item evolved UTRA and UTRAN, the aim of which was to
study means to achieve further substantial leaps in terms of
service provisioning and cost reduction. The overall target
of this long-term evolution (LTE) of 3G was to arrive at
an evolved radio access technology that can provide service
performance on a parity with current fixed line access. As
it is generally assumed that there will be a convergence
towards the use of Internet Protocol (IP)-based protocols
(i.e., all services in the future will be carried on top of
IP), the focus of this evolution was on enhancements for
packet-based services. 3GPP aimed to conclude the evolved
3G radio access technology in 2008, with subsequent initial
deployment in the 2009-2010 time frame. At this point
it is important to emphasize that this evolved RAN is an
evolution of the current 3G networks, building on already
made investments. 3GPP community has been working on
LTE and various contributions were made to implement
MBMS in LTE [1].
Orthogonal frequency division multiplexing/orthogonal
frequency division multiple access OFDM/OFDMA [2–4],
used in the physical layer (downlink connection) of LTE,
is an attractive choice to meet requirements for high data
rates, with correspondingly large transmission bandwidths
and flexible spectrum allocation. OFDM also allows for a
smooth migration from earlier radio access technologies
and is known for high performance in frequency-selective
channels. It further enables frequency-domain adaptation,
provides benefits in broadcast scenarios, and is well suited
for multiple-input multiple-output (MIMO) processing.
2
EURASIP Journal on Wireless Communications and Networking
The possibility to operate in vastly different spectrum
allocations is essential. Different bandwidths are realized by
varying the number of subcarriers used for transmission,
while the subcarrier spacing remains unchanged. In this way
operation in spectrum allocations of 1.4, 3, 5, 10, 15, and
20 MHz can be supported.
For MBMS support within a certain cell coverage area
for a given coverage target, the (Modulation and Coding
Scheme) MCS of the MBMS transport channel typically
has to be designed under worst-case assumptions. Apart
from cell-edge users experiencing large intercell-interference,
users with better channel conditions (closer to the base
station) could receive the same service with a better quality
(e.g., video resolution), as their receiving SNR would allow
usage of a higher-rate MCS. Hierarchical modulation [5–
8], which has been specified for broadcast systems like
(Digital Video Broadcast Terrestrial) DVB-T or MediaFLO,
is one way of accounting for unequal receiving conditions.
Here, a signal constellation like 16QAM, with each symbol
being represented by four bits, is interpreted in a sense that
the two first bits belong to an underlying QPSK alphabet.
This enables the use of two independent data streams with
different sensitivity requirements. In the example above, the
so-called high priority stream employs QPSK modulation
and is designed to cover the whole service area. The lowpriority stream requires the constellation to be demodulated
as 16QAM, and provides an additional or refined service via
the two additional bits. These may transport an additional
MBMS channel with a different type of service, or an
enhancement stream that, for example, leads to enhancing
the resolution of the base stream. A design parameter that
determines the constellation layout allows the control of
the amount of distortion that the enhancements symbols
add to the baseline constellation, and can be used to
control the ratio of coverage areas or service data rates.
Theoretical evaluation of this type of modulations where it is
explicitly shown the dependence of the individual bit streams
performance on the constellation design parameter has been
previously presented in [9, 10].
Introducing multiresolution in a broadcast system
mainly affects two parts, source coding and distribution/signalling. Until recently the source coding has been
aimed toward achieving the highest compression ratio
possible [11]. With the development of cellular phones
to competent multimedia terminals and integration of the
cellular networks with the Internet, the result is a more
heterogeneous network with regard to terminal capabilities
and connection speed.
In this work it is assumed that scalable source coders
are used and scalability is done in layers. It consists of
one basic layer to encode the basic quality and consecutive
refinement or enhancement layers for higher quality. The
source coder can generate a total of L layers. For simplicity it
is also assumed that all layers require the same data rate and
target bit error rate. Specifically for broadcast and multicast
transmissions in a mobile cellular network, depending on
the communication link conditions, some receivers will have
better signal-to-noise ratios (SNR) than others and thus the
capacity of the communication link for these users is higher.
Hierarchical constellations and MIMO (spatial multiplexing [12, 13]) are methods to offer multiresolution.
The authors of this paper have previously analyzed and
evaluated these two forms of multiresolution considering
the WCDMA technology in [14–16]. In OFDMA-based
networks, the transmission of different fractions of the total
set of subcarriers (chunks) depending on the position of
the mobiles is another way to offer multiresolution. Any
of these methods is able to provide unequal bit error
protection. In any case there are two or more classes of bits
with different error protection, to which different streams
of information can be mapped. Regardless of the channel
conditions, a given user always attempts to demodulate
both the more protected bits and the other bits that carry
the additional resolution. Depending on its position inside
the cell more or less blocks with additional resolution will
be correctly received by the mobile user. However, the
basic quality will be always correctly received independently
of the position of any user, within the 95% coverage
target.
For increasing distance between terminals and base
station decreasing bit rates are correctly received due to the
decrease of SNR. Adaptive Modulation and Coding (AMC) is
a technique that maximizes the total throughput for unicast
transmissions. The decrease of SNR with the distance is
common to unicast or broadcast/multicast transmissions.
However for broadcast/multicast the same video content
is transmitted and AMC is not possible without personal
uplink feedback. With the introduction of multiresolution
techniques the maximization of the total throughput is
the goal to achieve. System-level simulations for broadcast/multicast with multiresolution are necessary to evaluate
the achievable throughput gain compare to single resolution
systems.
In this paper Section 2 refers to the objectives and
requirements, in Section 3 the evaluation methodology and
simulation assumptions are presented. In Section 4 the
system level results are presented, and finally in Section 5 the
summary and conclusions are presented.
2. Objectives and Requirements
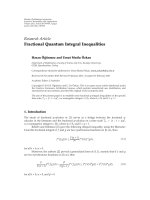
The introduction of hierarchical modulation in a broadcast
cellular system requires a scalable video coded as shown in
Figure 1 [11, 14], where the base layer transmission provides
the minimum quality, and one or more enhancement layers
offer improved quality at increasing bit/frame rates and
resolutions. This method significantly decreases the storage
costs of the content provider compared to the simulcast
distribution where for a single video sequence excessive
video sequences must be stored at the server to enable its
distribution to different customers with different terminal
capabilities. Besides being a potential solution for content
adaptation, scalable video schemes may also allow an efficient
usage of radio resources in enhanced MBMS.
According to Release 6 of 3GPP the single resolution
scheme corresponds to transmission of QPSK with more
than 95% coverage. The assignment of the fraction of the
EURASIP Journal on Wireless Communications and Networking
3
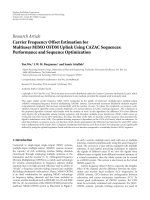
Simulation
parameters
System level
simulator SNR
SNR
Base layer
Node B
Link level
simulator BLER
BLER
BLER
UE2
Results
SNR
Figure 2: Interaction between link level simulator and system level
simulator.
UE1
Base layer +
enhanced layer
Figure 1: Scalable video transmission.
total transmission power reserved for MBMS has implications in the coverage and average throughput of the
multiresolution based on the hierarchical 16-QAM scheme.
The multicell interference distribution has also strong impact
in the coverage and throughput. An interesting design
parameter is the channel bit rate (and its coding rate)
associated to the multiresolution scheme. An optimization
of this parameter has also strong impact in the achievable
coverage and average throughputs.
Regardless of the channel conditions and user location, a
given user always attempts to demodulate both the base layer
and the enhancement layer carrying additional resolution.
For good multiresolution design, the basic information will
be always correctly received independently of the position
of any user, within the 95% coverage target. However,
depending on its position inside the cell more or less blocks
with additional resolution will be correctly received by the
mobile user.
The objective of this work is the design of multiresolution schemes in different scenarios, namely, multicell
with intercell interference without and with macrodiversity
support, and to measure the corresponding multiresolution
gain of total throughput compared to the reference total
throughput of the single resolution scheme based on the
QPSK transmission.
3. Evaluation Methodology and
Simulation Assumptions
Typically, radio network simulations can be classified as
either link level (radio link between the base station and
the user terminal) or system level (several base stations with
large number of mobile users). A single approach would be
preferable, but the complexity of such simulator (including
everything from transmitted waveforms to multicell network) is far too high for the required simulation resolutions
and simulation time. Therefore, separate but interconnected
link and system level approaches are needed.
The link level simulator is needed for the system simulator to build a receiver model that can predict the receiver
(Block Error Rate/Bit Error Rate) BLER/BER performance,
taking into account channel estimation, interleaving, modulation, receiver structure, and decoding. The system level
simulator is needed to model a system with a large number of
mobiles and base stations, and algorithms operating in such
a system.
As the simulation is divided in two parts, an approach
of linking between the two simulators must be defined.
Conventionally, the information obtained from the link level
simulator is inserted in the system level simulator through
the utilization of a specific performance parameter (BLER)
corresponding to a determined signal to interference plus
noise ratio (SNR) estimated in the terminal or base station.
In Figure 2 is shown the simulators interaction.
3.1. Link-Level Simulator Design. The link-level simulator
(LLS) was developed in Matlab and took into account the
specifications of 3GPP MBMS Release 7 [17] regarding to
the signal processing of transport and physical channels and
satisfying two essential requirements:
(i) serve as reference for all the link level simulations
with multiresolution and parameters estimation,
(ii) serve as a platform to the different multiresolution
improvements tested and quantified.
Typical time interval of each link level simulation is 0.5
seconds (as shown in Table 1). The entire OFDMA signal
processing at the transmitter was included in the LLS as well
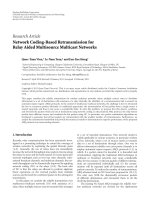
as several different receiver structures. To achieve reliable
channel estimation and data detection we employ a receiver
capable of jointly performing these tasks through iterative
processing. The structure of the iterative receiver is shown
in Figure 3 (see also [18]).
The receiver structure for additive white Gaussian noise
(AWGN) channel is less complex (only a few turbo-decoder
iterations and no channel estimation nor channel equalization required).
4
EURASIP Journal on Wireless Communications and Networking
De-interleaver
Rk,l
DFT
Channel
equalization
Demodulator
log2 M
parallel chains
2
De-interleaver
Hk,l
Channel
decoder
(q)
Sk,l
Channel
estimator
Channel
decoder
Decision
device
Transmitted signal
rebuilder
Decision
device
Figure 3: Iterative receiver structure.
Multipath Rayleigh fading channels were considered in
the simulator due to the sensitivity of hierarchical high-order
QAM modulations to the channel parameters estimation.
As indicated the receiver structure is nonlinear, iterative,
and includes channel parameters estimation for the analyzed
multipath Rayleigh fading channel [19]. This explains why
we used a different approach for the link level simulations
compared to the typical 3GPP methodology which maps
against coded AWGN curves for various transport formats.
3.2. Radio Access Network System Level Simulator. For the
purpose of validating the work presented in this section,
it was developed a system level simulator in Java, using
a discrete event-based philosophy, which captures the
dynamic behavior of the Radio Access Network System.
This dynamic behavior includes the user (e.g., mobility
and variable traffic demands), radio interface and (Radio
Access Network) RAN with some level of abstraction.
The system level simulator (SLS) works at Transmission
Time Interval (TTI) rate and typical time interval of each
simulation is 600 seconds. Table 1 shows the simulation
parameters. It presents the parameters used in the link and
system level simulations based on 3GPP documents [20–
23].
The channel model used in the system level simulator
considers three types of losses: distance loss, shadowing loss
and multipath fading loss (one value per TTI). The model
parameters depend on the environment. For the distance
loss the Okumura-Hata Model from the COST 231 project
was used (see [24]). Shadowing is due to the existence of
large obstacles like buildings and the movement of UEs in
and out of the shadows. This is modelled through a process
with a lognormal distribution and a correlation distance. The
multipath fading in the system level simulator corresponds
to the 3GPP channel model, where the ITU Vehicular A
(30 km/h) (see [19] Annex B) environment was chosen as
reference. The latter model was also used in the link level
simulator but at much higher rate. Vehicular A (with velocity
v = 30 km/h) channel model was chosen because it is an
important test channel in 3GPP specifications also, it allows
for direct comparison with previous system level simulations
done by the authors [25]. In OFDM systems the important
parameter is the maximum delay of the multipath profile
and its relation with the duration of the time guard between
OFDM symbols to avoid intersymbol interference. 3GPP has
specified a short time guard with about 4.75 μs and a long one
with 16.67 μs. The long-time guard was considered in this
paper, making the performance less sensitive to the chosen
propagation channel. However, there is a reduction of the
transmitted bit rates.
In the radio access network subsystem system level
simulator only the resulting fading loss of the channel model,
expressed in dB, is taken into account. The fading model
is provided by the link level simulator through a trace of
average fading values (in dB), one per Transmission Time
Interval (TTI) or Subframe duration. For each environment
the mobile speed is the same and several traces of fading
values are provided for each pair of antenna. A uniform
distribution of mobile users is generated at the beginning
of each simulation. Typical number of users chosen for each
simulation run was 20 per sector. Each mobile has random
mobility with the specified 30 km/h.
Dynamic system level simulators like the one presented
in this paper are very accurate, the main limitation is
the hypothetical urban macrocellular test scenario that is
different from any real one.
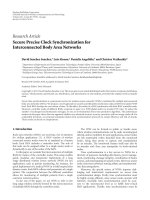
Figure 4 illustrates the cellular layout (trisectorial
antenna pattern) indicating the fractional frequency reuse
of 1/3 considered in the system level simulations. 1/3 of
the available bandwidth was used in each sector to reduce
the multicell interference. As indicated in Figure 4, the
identification of the sources of multicell interference, that
is, use of the same adjacent subcarriers (named physical
resource blocks or chunks), is given by the sectors with
the same colour/number, namely, red/one, green/two, or
yellow/three.
EURASIP Journal on Wireless Communications and Networking
5
Table 1: Link and system level simulation parameters for urban macrocellular scenario.
Transmission bandwidth
Cyclic prefix size
FFT Size
Carriers space (kHz)
Available bandwidth
Sample time (ns)
Max Tx Power (dBm)/sector
Number of used subcarriers/sector
Number of used subcarriers/cell
Freq. Reuse
Subframe duration (ms)
Interfering cells transmit with % of Max Power
Cell Radius (m)
InterSite Distance (m)
Cellular layout
Sectors
Number of cell sites
Antenna gain of the base station
Width of beam of the antenna at −3 dB
Front/Back ratio of the antenna
Antenna pattern radiation of the base station
Propagation Model
Downlink thermal noise
Cable Loss
Fade out standard deviation due to shadowing
2
1
3
1
3
2
1
3
2
1
3
2
1
3
2
1
2
1
3
Figure 4: Cellular layout including the frequency reuse of 1/3
(colours/numbers of the cells).
For 16-QAM hierarchical constellations two classes of
bits with different error protection are used. The blue colour
around the antennas only indicates the approximate coverage
of the weak bits blocks, while the other colours indicate the
coverage of the strong bits blocks.
This is the case for the scenario to be analyzed with
one radio link between the mobile and the closest base
10 MHz
72
1024
15
9 MHz
130
46
200
600
1/3
0.5
90
750
1500
Hexagonal
3 sectors/cell
19
17.5 dBi
70 degrees
20 dB
Gaussian
Okumura-Hata
−100 dBm
3 dB
10 dB
station. It is not assumed any time synchronism between
the transmissions from different base stations with the same
colour resulting in interference from all but one cell with the
same colour. However, in the scenario with macrodiversity
combining the two best radio links, it is assumed that
there is time synchronization between the two closest base
station sites with the same colour. In this case the multicell
interference is reduced because only the other base station
sites with the same colour remain unsynchronous and
capable to interfere.
Figure 5 illustrates the time and frequency division
of the physical resource blocks (PRBs) considering that
there are three sectors per cell. To combat the frequency
selective fading adjacent PRBs should belong to different
sectors as indicated in Figure 5. In each sector the total
bandwidth should be available in 1/3 of each subslot of
0.5 ms, in addition, the allocation of the physical resource
blocks by the sectors should be dynamic instead of fixed.
For the system level simulation results presented in the
paper what matters is the identification of the interfering
PRBs. Fixed or variable positions of PRBs within the same
Subframe, only matters if there is no coordination between
adjacent base-stations to avoid intercell interference. We
have assumed that this interference avoidance coordination
exists. Variable positions of PRBs within one Subframe
are better to combat fast fading effects due to multipath
channels.
6
EURASIP Journal on Wireless Communications and Networking
Frequency
1 2 3
0.5
1 2 3
Time (ms)
0.5
3
1 2 3
1 2 3
1 2
1 2 3
1 2 3
1 2 3
3
1 2 3
1 2 3
1 2
1 2 3
1 2 3
0.5
1 2 3
3
1 2 3
1 2 3
1 2 3
1 2
Figure 5: Time and frequency division of the physical resource blocks.
4. System-Level Performance Results
To study the behavior of the proposed OFDM multiresolution schemes, several simulations were performed for 16QAM hierarchical modulations.
16-QAM hierarchical constellations are constructed
using a main QPSK constellation where each symbol is in
fact another QPSK constellation, as shown in Figure 6.
The main parameter for defining one of these constellations is the ratio between d1 and d2 as shown in Figure 6:
d1
= k,
d2
where 0 < k ≤ 0.5.
(1)
Two classes of bits with different error protection were used.
Each information stream was encoded with a block size
of 2560 bits per Subframe duration of 0.5 ms. One third
of the total physical resource blocks (PRB) are transmitted
in each sector. This corresponds to an instantly occupied
bandwidth of 3 MHz, where we have considered 20 PRBs
each with 150 kHz of adjacent bandwidth (corresponding
to 10 subcarriers with frequency spacing of 15 kHz). The
number of adjacent subcarriers in each PRB was a study item
in 3GPP by the time we started our simulation work. We have
considered PRBs with 10 adjacent subcarriers instead of 12
as currently specified by 3GPP. However this change in the
size of the PRBs does not change our simulation results for
the propagation channels and velocity chosen. We have also
chosen PRBs of this size to have an integer number of TV
channels (i.e., PRBs) each with bit rate of 256 kbps for the
chosen fractional frequency reuse of 1/3. Otherwise it would
not be possible to compare directly the OFDM/OFDMA
results with those obtained previously with the WCDMA
technology. All the parameters used for OFDM during these
simulations were based on 3GPP documents [20–23].
We have considered that three different coding rates are
used, namely, 1/2, 2/3 and 3/4. This leads to total transmitted
information bit rates per cell sector of 5120 kbps, 6825 kbps,
and 7680 kbps, respectively. Considering that each PRB
carries a different TV program channel this corresponds
to channel bit rates of 256 kbps, 341 kbps and 384 kbps,
respectively. We have evaluated in the link level simulations
the hierarchical 16-QAM with different values of k for these
three-channel bit rates. In Figures 7 and 8 we present the
BLER versus Es /N0 for the channel bit rates 256 kbps and
384 kbps, respectively.
In the legend H1 denotes the strong bits block and H2
the weak bits. H1, k = 0.1 corresponds to the most left curve
requiring the minimum Es /N0 and H2, k = 0.1 is the most
right curve requiring the maximum Es /N0 . H1, k = 0.5 and
H2, k = 0.5 correspond to the two inner curves that almost
overlap (same Es /N0 ) in the two figures. k = 0 corresponds
to QPSK and its BLER performance is presented only in
Figure 7. As expected, QPSK has a better coverage than any
of the H1 blocks but obviously its bit rate is half of the set
H1+H2 for each k = 0.
/
Comparison between these two figures indicates that
considering any BLER and in particular the reference BLER
of 1%, higher channel bit rates require higher SNR) to
offer any given BLER, resulting in less coverage. However,
higher channel bit rates can provide higher maximum
throughputs. For k = 0.1 the coverage of the strong blocks
is the maximum, however the coverage of the corresponding
weak blocks is the minimum. As a result the resulting
total throughput of both types of blocks is the smallest.
Notice that k = 0.5 corresponds to the 16QAM uniform
constellation, where the strong bits are the standard bits of
QPSK modulation, however their coverage is less than the
QPSK. The coverage of the corresponding weak blocks (k =
0.5) is the maximum resulting in the highest total throughput
of both types of blocks.
For the reference BLER of 1%, the spread in Es /N0
values for different k values is much higher for weak blocks
compared to strong blocks. As a result, we observe a small
coverage gain for smaller k values but associated to high
loss of total throughput (strong + weak blocks). This can be
observed in Figure 9 where the difference, related to QPSK,
in required SNR is presented versus k, taking the reference
BLER of 1%.
We have chosen the k = 0.5 curves for the system
level simulations because in this case there is the minimum
difference between the BLER performance of H1 and H2,
which is expected to assure the best combination of coverage
and throughput.
EURASIP Journal on Wireless Communications and Networking
I
01
7
I
00
0101 0100
01
Q
11
00
11
10
I
d1
0001 0000
=
Q
10
0011 0010
1101 1100
1001 1000 Q
1111 1110
+
0111 0110
1011 1010
Enhancement
Basic
d2
Figure 6: Signal constellation for 16-QAM hierarchical modulation.
256 kbps
100
24
20
10−2
16
ΔSNR (dB)
BLER
10−1
10−3
12
8
10−4
−5
0
5
10
15
Es /N0 (dB)
QPSK, k = 0
H1, k = 0.1
H1, k = 0.2
H1, k = 0.3
H1, k = 0.4
H1, k = 0.5
20
25
30
0
H2, k = 0.5
H2, k = 0.4
H2, k = 0.3
H2, k = 0.2
H2, k = 0.1
384 kbps
BLER
10−1
10−2
10−3
10−4
0
5
10
15
20
25
30
35
Es /N0 (dB)
H1, k = 0.1
H1, k = 0.2
H1, k = 0.3
H1, k = 0.4
H1, k = 0.5
0
0.1
0.2
0.3
k
0.4
0.5
0.6
H1
H2
Figure 7: BLER versus Es /N0 for hierarchical 16-QAM varying k,
Rb = 256 kbps, VehA 30 km/h.
100
4
H2, k = 0.5
H2, k = 0.4
H2, k = 0.3
H2, k = 0.2
H2, k = 0.1
Figure 8: BLER versus Es /N0 for hierarchical 16-QAM varying k,
Rb = 384 kbps, VehA 30 km/h.
Figure 9: ΔSNR versus k for hierarchical 16-QAM, 256 kbps, VehA
30 km/h.
In the system level simulations mobile users receive
strong and weak bits blocks transmitted from base stations.
Each block undergoes small- and-large scale fading and
multicell interference. In terms of coverage or throughput the
SNR of each block is computed taking into account all the
above impairments and based on the comparison between
the reference SNR at a BLER of 1%, and the evaluated SNR
it is decided whether the block is or not correctly received.
This is done for all the transmitted blocks for all users in all
sectors of the 19 cells, during typically 10 minutes.
Figure 10 presents the coverage versus the fraction
of the total transmitted power (Ec /Ior ), for the multicell
interference scenario where there is interference only from
1/3 of the sectors due to the frequency reuse of 1/3 (see
Figure 4). All interfering sites transmit with the maximum
power of 80% according to the parameters indicated in
Table 1. The cell radius is 750 m, and we have separated
strong blocks (H1) from weak blocks (H2) without including
macrodiversity combining. The multicell interference is 90%
of the maximum transmitted power in each site. For Ec /Ior
= 50% and channel bit rate 256 kbps the coverage of H1 is
EURASIP Journal on Wireless Communications and Networking
110
100
90
80
70
60
50
40
30
20
10
0
Multi-cell interference scenario, 750 m
0
10
20
30
40
50
60
70
80
90
100
Average UE throughput (kbps)
Average coverage (%)
8
180
135
90
45
0
Multicast channel Ec /lor (%)
H1 (256 kbps)
H2 (256 kbps)
H1 (341 kbps)
20
30
40
50
60
70
Average coverage (%)
20
30
40
50 60
70
Multicast channel Ec /lor (%)
80
90
80
90
100
1RL (384 kbps)
2RL (341 kbps)
1RL (341 kbps)
Figure 12: Throughput versus Ec /Ior , R = 750 m, k = 0.5.
Average UE throughput (kbps)
10
10
2RL (256 kbps)
1RL (256 kbps)
2RL (384 kbps)
Multi-cell interference scenario, 750 m
0
0
H2 (341 kbps)
H1 (384 kbps)
H2 (384 kbps)
Figure 10: Average coverage (%) versus Ec /Ior , 1 Radio Link, k =
0.5.
110
100
90
80
70
60
50
40
30
20
10
0
Multi-cell interference scenario, 750 m
405
360
315
270
225
405
360
315
270
225
180
135
90
45
0
Multi-cell interference scenario, 750 m
0
100
200
100
300
400
500
Distance to BS (m)
600
700
800
Multicast channel Ec /lor (%)
Figure 11: Average coverage (%) versus Ec /Ior , 2 Radio Links, k =
0.5.
95% and for H2 is 85%. For the same Ec /Ior , but 384 kbps
data rate, the coverage values of H1 and H2 are 39% and
30%, respectively. In both cases there is a difference of about
10% between the coverage of H1 and H2 due to the chosen
k = 0.5.
Figure 11 present the coverage versus Ec /Ior separating
strong blocks (H1) from weak blocks (H2) with macrodiversity combining of the best two radio links. For Ec /Ior =
20% regardless of the channel bit rate and the type of blocks
the coverage is always above 95%. However, for 384 kbps the
coverage values of H1 and H2 are different from each other.
Only for Ec /Ior = 50% the coverage of strong blocks is
above or equal to 95% for 384 kbps, but for 256 kbps the
coverage value for strong blocks is above 95% for Ec /Ior =
5%. This indicates that as long as there is macrodiversity
combining of the two best links it is possible to increase
the channel bit rate or increase the number of transmitted
channels keeping the same bit rate.
1RL (341 kbps)
2RL (384 kbps)
1RL (384 kbps)
2RL (256 kbps)
1RL (256 kbps)
2RL (341 kbps)
H2 (341 kbps)
H1 (384 kbps)
H2 (384 kbps)
Figure 13: Throughput versus distance between UEs and BS, k =
0.5.
Average coverage (%)
H1 (256 kbps)
H2 (256 kbps)
H1 (341 kbps)
110
100
90
80
70
60
50
40
30
20
10
0
Multi-cell interference scenario, 750 m
0
10
20
30
40
50
60
70
80
90
100
Multicast channel Ec /lor (%)
H1 (256 kbps)
H2 (256 kbps)
H1 (341 kbps)
H2 (341 kbps)
H1 (384 kbps)
H2 (384 kbps)
Figure 14: Average coverage (%) versus Ec /Ior , 2 Radio Links, k =
0.4.
Average coverage (%)
EURASIP Journal on Wireless Communications and Networking
100
90
80
70
60
50
40
30
20
10
0
Multi-cell interference scenario, 750 m
0
10
20
30
40
50 60
70
Multicast channel Ec /lor (%)
80
90
100
H2 (341 kbps)
H1 (384 kbps)
H2 (384 kbps)
H1 (256 kbps)
H2 (256 kbps)
H1 (341 kbps)
Figure 15: Average coverage (%) versus Ec /Ior , 2 Radio Links, k =
0.1.
Multi-cell interference scenario, 750 m
Average UE throughput (kbps)
405
360
315
270
225
180
135
90
45
0
0
10
20
30
40
50
60
70
80
90
100
90
100
Multicast channel Ec /lor (%)
1RL (384 kbps)
2RL (341 kbps)
1RL (341 kbps)
2RL (256 kbps)
1RL (256 kbps)
2RL (384 kbps)
Average UE throughput (kbps)
Figure 16: Throughput versus Ec /Ior , k = 0.4.
Multi-cell interference scenario, 750 m
405
360
315
270
225
180
135
90
45
0
0
10
20
30
40
50
60
70
80
Multicast channel Ec /lor (%)
2RL (256 kbps)
1RL (256 kbps)
2RL (341 kbps)
1RL (341 kbps)
2RL (384 kbps)
1RL (384 kbps)
Figure 17: Throughput versus Ec /Ior , k = 0.1.
9
Figure 12 considers the throughput distribution as function of the Ec /Ior for multicellular network with and without
macrodiversity for the cell radius of 750 m. We observe a
considerable gain in throughput when macrodiversity (2RL)
is considered compared to the single radio link case. This is
particularly true for the high bit rate 384 kbps. For the low
bit rate the macrodiversity gain is not so substantial as the
throughput performance is already good for a single radio
link.
Figure 13 considers the throughput distribution as function of the distance between UEs and BS for the Ec /Ior = 90%,
with and without macrodiversity for the same cell radius of
750 m. For the chosen Ec /Ior , macrodiversity (2RL) assure
almost the maximum throughput for 256 kbps, however it
is more obvious the decrease in throughput for 384 kbps and
mobile users at the cell borders. It is obvious that without
macrodiversity (1RL case), only for the 256 kbps channel,
the throughput is almost the maximum regardless of the
distance. For the high bit rate 384 kbps a single radio link
only offers high throughput for users close to the base station.
Based on these results for the 16QAM multiresolution
scheme in the multicellular network with macrodiversity
combining (compared to one radio link) it is possible to
increase the channel bit rate keeping the same number of
channels or increasing the number of channels keeping the
same bit rate per channel. In terms of broadcasting mobile
TV channels it might be important to increase the InterSite
distanced to 1500 m to reduce the number of sites.
In Figures 14 and 15 the coverage performance curves for
k = 0.4 and k = 0.1, versus Ec /Ior , are presented and should
be compared to the corresponding figure with k = 0.5,
Figure 11. As expected the difference of coverage between
H1 and H2 blocks increases with decreasing k, this is more
noticeable for small k values such as k = 0.1 where even with
macrodiversity combining the coverage of H2 blocks is rather
low.
In Figures 16 and 17 the throughput performance versus
Ec /Ior , for k = 0.4 and k = 0.1 are presented and should
be compared to Figure 12. With or without macrodiversity
combining there is about the same throughput for k =
0.5 and k = 0.4. However, there is a substantial decrease
in throughput for k = 0.1 without and especially with
macrodiversity combining, independently of the channel bit
rate.
To get the 16QAM multiresolution gain compared to
the single resolution with QPSK we should compute the
aggregate throughput in all the cell area with multiresolution
and divide by the single resolution aggregate throughput
in the cell area. As the coverage of QPSK blocks is the
same of strong bits blocks of hierarchical 16QAM due to
macrodiversity combining the comparison of the aggregate
throughput is based on the different coverage of the weak bits
blocks.
From Figures 12 and 16 it is clear that the smallest
throughput gain is achieved for coding rate = 1/2 (256 kbps).
For this case, the throughput gain is two, remember that
the single resolution throughput of QPSK is 128 kbps. The
highest throughput gain is achieved for coding rate = 3/4
10
EURASIP Journal on Wireless Communications and Networking
Table 2: Capacity values for 16QAM hierarchical multiresolution
OFDMA.
QoS
No. of channels
256 kbps
30
QoS
No. of channels
384 kbps
20
Spectral efficiency ISD Bandwidth
0.768 bps/Hz/cell 1500 m 10 MHz
Spectral efficiency ISD Bandwidth
0.768 bps/Hz/cell 1500 m 10 MHz
Table 3: Capacity values for QPSK single resolution, CDMA
scheme for 5 MHz bandwidth.
QoS
No. of channels Spectral efficiency ISD Bandwidth
256 kbps
7
0.358 bps/Hz/cell 1000 m 5 MHz
(384 kbps). For this case, the throughput gain is almost three
(for k = 0.5 the throughput of 384 kbps is achieved up to
600 m far from the base station (BS) as shown in Figure 13).
However for k = 0.1 the throughput gain never reaches two
(see Figure 17). So it is important to choose k values between
[0.4,0.5] to achieve the highest multiresolution gain.
5. Summary and Conclusions
We have studied and evaluated the use of QAM hierarchical
constellations in an OFDM system as a multiresolution
scheme for the enhanced MBMS network. Scenarios based
on multicell networks without and with macrodiversity
combining were evaluated using multiresolution based on
16QAM hierarchical modulation.
We can conclude that multiresolution works fine with
any of the analyzed scenarios, multicell networks without or
with macrodiversity combining. Indeed it works better with
multicell with macrodiversity than with multicell without
macrodiversity. In multicell networks without macrodiversity due to the higher sensitivity to the channel bit rate of
higher-order constellations we can increase the channel bit
rate of each TV channel for users close to the base station. In
multicell scenario with macrodiversity, the multiresolution
schemes become less sensitive to the used channel bit rates.
In multicell without macrodiversity to achieve higher
multiresolution gain it is suggested to use the channel bit rate
of 256 kbps, that is, the channel coding rate of 1/2. As long as
there is previous recording of link quality information in the
cell, it is recommended that a few different groups should be
formed with different channel bit rates in order to increase
the levels of multiresolution. One way to achieve this is the
combination of hierarchical QAM modulations with MIMO
2 × 2.
It was concluded that to achieve the highest multiresolution gain is important to choose k values between (0.4,0.5)
and avoid smaller k values.
For the high channel bit rate 384 kbps, the spectral
efficiency achieved per cell sector considering that 20
TV channels are transmitted simultaneously in the total
bandwidth of 10 MHz is 0.768 bps/Hz/cell. This value of
spectral efficiency is valid for users at the cell border. The
InterSite-distance (ISD) associated to this spectral efficiency
is 1500 m. Alternatively, 30 TV channels with 256 kbps could
be transmitted at the same time as indicated in Table 2.
Table 3 shows the capacity of MBMS single resolution
taking into account results for the standard MBMS normalized in Release 6 and as presented in [25] for the same
scenario with macrodiversity of two radio links.
The comparison between Tables 2 and 3 is not straightforward due to the difference of bandwidth and ISO.
However it is possible to draw a capacity gain of at least two
between hierarchical 16QAM and QPSK (notice that higher
ISD is an advantage for broadcasting).
In the future we will study and evaluate the use
of 64QAM hierarchical constellations and MIMO (spatial
multiplexing) in an OFDM/OFDMA system as other multiresolution schemes for the enhanced MBMS network. The
scenario based on the use of single-frequency network (SFN)
with the Multimedia Broadcast over SFN (MBSFN) channel
will be also evaluated for 16QAM hierarchical modulation
and compared with the present work.
References
[1] “Feasibility study on improvement of the multimedia broadcast multicast service (MBMS),” Tech. Rep. 25.905 version
7.2.0 Release 7, 3GPP, Sophia Antipolis Cedex, France, June
2007, .
[2] H. Sari, Y. Levy, and G. Karam, “An analysis of orthogonal
frequency-division multiple access,” in Proceedings of IEEE
Global Telecommunications Conference (GLOBECOM ’97), vol.
3, pp. 1635–1639, Phoenix, Ariz, USA, November 1997.
[3] I. Koffman and V. Roman, “Broadband wireless access
solutions based on OFDM access in IEEE 802.16,” IEEE
Communications Magazine, vol. 40, no. 4, pp. 96–103, 2002.
[4] J. A. C. Bingham, “Multicarrier modulation for data transmission: an idea whose time has come,” IEEE Communications
Magazine, vol. 28, no. 5, pp. 5–14, 1990.
[5] T. Cover, “Broadcast channels,” IEEE Transactions on Information Theory, vol. 18, no. 1, pp. 2–14, 1972.
[6] K. Ramchandran, A. Ortega, K. M. Uz, and M. Vetterli,
“Multi-resolution broadcast for digital HDTV using joint
source/channel coding,” IEEE Journal on Selected Areas in
Communications, vol. 11, no. 1, pp. 6–23, 1993.
[7] H. Jiang and P. A. Wilford, “A hierarchical modulation for
upgrading digital broadcast systems,” IEEE Transactions on
Broadcasting, vol. 51, no. 2, pp. 223–229, 2005.
[8] S. Wang, S. Kwon, and B. K. Yi, “On enhancing hierarchical
modulation,” in Proceedings of IEEE International Symposium
on Broadband Multimedia Systems and Broadcasting (BMSB
’08), pp. 1–6, Las Vegas, Nev, USA, March-April 2008.
[9] P. K. Vitthaladevuni and M.-S. Alouini, “A closed-form
expression for the exact BER of generalized PAM and QAM
constellations,” IEEE Transactions on Communications, vol. 52,
no. 5, pp. 698–700, 2004.
[10] N. Souto, F. A. B. Cercas, R. Dinis, and J. Silva, “On the
BER performance of hierarchical M-QAM constellations with
diversity and imperfect channel estimation,” IEEE Transactions
on Communications, vol. 55, no. 10, pp. 1852–1856, 2007.
[11] M. Vetterli and K. M. Uz, “Multiresolution coding techniques
for digital television: a review,” Multidimensional Systems and
Signal Processing, vol. 3, no. 2-3, pp. 161–187, 1992.
EURASIP Journal on Wireless Communications and Networking
[12] G. J. Foschini, “Layered space-time architecture for wireless
communication in a fading environment when using multielement antennas,” Bell Labs Technical Journal, vol. 1, no. 2,
pp. 41–59, 1996.
[13] G. J. Foschini and M. J. Gans, “On limits of wireless
communications in fading environments when using multiple
antennas,” Wireless Personal Communications, vol. 6, no. 3, pp.
311–335, 1998.
[14] A. Soares, N. Souto, J. Silva, P. Eus´ bio, and A. Correia,
e
“Effective radio resource management for MBMS in UMTS
networks,” Wireless Personal Communications, vol. 42, no. 2,
pp. 185–211, 2007.
[15] A. Soares, J. Silva, N. Souto, F. Leit˜o, and A. Correia, “MIMO
a
based radio resource management for UMTS multicast broadcast multimedia services,” Wireless Personal Communications,
vol. 42, no. 2, pp. 225–246, 2007.
[16] A. Correia, N. Souto, J. Silva, and A. Soares, “Air interface
enhancements for MBMS,” in Handbook of Mobile Broadcasting, B. Furht and S. Ahson, Eds., chapter 17, CRC Press,
Francis & Taylor, New York, NY, USA, 2008.
[17] “Technical specification group radio access network; physical
layers aspects for evolved (UTRA),” Tech. Rep. 25.814 version
7.1.0 Release 7, 3GPP, Sophia Antipolis Cedex, France,
September 2006, .
[18] N. Souto, A. Correia, R. Dinis, J. Silva, and L. Abreu,
“Multiresolution MBMS transmissions for MIMO UTRA LTE
systems,” in Proceedings of IEEE International Symposium on
Broadband Multimedia Systems and Broadcasting (BMSB ’08),
pp. 1–6, Las Vegas, Nev, USA, March-April 2008.
[19] “User equipment radio transmission and reception (FDD),”
Tech. Rep. TS 25.101-version 6.2.0, Release 6, 3GPP, Sophia
Antipolis Cedex, France, October 1999, .
[20] “Feasibility study for evolved universal terrestrial radio
access (UTRA) and universal terrestrial radio access network (UTRAN),” Tech. Rep. 25.912 version 7.1.0 Release
7, 3GPP, Sophia Antipolis Cedex, France, September 2006,
.
[21] “Feasibility study for orthogonal frequency division multiplexing (OFDM) for UTRAN enhancement,” Tech. Rep.
25.892 version 6.0.0 Release 6, 3GPP, Sophia Antipolis Cedex,
France, June 2004, .
[22] “Evolved universal terrestrial radio access (E-UTRA); radio
frequency (RF) system scenarios,” Tech. Rep. 36.942 Release
8, 3GPP, Sophia Antipolis Cedex, France, December 2008,
.
[23] “LTE physical layer framework for performance verification,”
Tech. Rep. R1-070674 TSG-RAN1#48, 3GPP, Sophia Antipolis
Cedex, France, February 2007, .
[24] E. Damosso, Ed., “Digital Mobile Radio Towards Future
Generation Systems,” COST 231, European Commission,
Luxemburg, Germany, 1999.
[25] A. Correia, J. Silva, N. Souto, L. A. C. Silva, A. B. Boal, and
A. Soares, “Multi-resolution broadcast/multicast systems for
MBMS,” IEEE Transactions on Broadcasting, vol. 53, no. 1, pp.
224–233, 2007.
11