Báo cáo hóa học: "Research Article Novel Heuristics for Cell Radius Determination in WCDMA Systems and Their Application to Strategic Planning Studies" potx
Bạn đang xem bản rút gọn của tài liệu. Xem và tải ngay bản đầy đủ của tài liệu tại đây (742.14 KB, 14 trang )
Hindawi Publishing Corporation
EURASIP Journal on Wireless Communications and Networking
Volume 2009, Article ID 314814, 14 pages
doi:10.1155/2009/314814
Research Article
NovelHeuristicsforCellRadiusDeterminationinWCDMA
Systems and Their Application to Strategic Planning Studies
A. Portilla-Figueras,
1
S. Salcedo-Sanz,
1
Klaus D. Hackbarth,
2
F. L
´
opez-Ferreras,
1
and G. Esteve-Asensio
3
1
Depar t amento de Teor
´
ıa de la Se
´
nal y Comunicaciones, Escuela Polit
´
ecnica Superior, Universidad de Alcal
´
a,
Alcal
´
a de Henares, 28871 Madrid, Spain
2
Departamento de Ingenier
´
ıa de Comunicaciones, Universidad de Cantabria, 39005 Santander, Spain
3
Departamento de Investigaci
´
on y Desarrollo, Grupo Vodafone, 18004 Granada, Spain
Correspondence should be addressed to S. Salcedo-Sanz,
Received 24 March 2009; Accepted 20 August 2009
Recommended by Mohamed Hossam Ahmed
We propose and compare three novel heuristics for the calculation of the optimal cell radius in mobile networks based on
Wideband Code Division Multiple Access (WCDMA) technology. The proposed heuristics solve the problem of the load
assignment and cellular radius calculation. We have tested our approaches with experiments in multiservices scenarios showing
that the proposed heuristics maximize the cell radius, providing the optimum load factor assignment. The main application of
these algorithms is strategic planning studies, where an estimation of the number of Nodes B of the mobile operator, at a national
level, is required for economic analysis. In this case due to the large number of different scenarios considered (cities, towns, and
open areas) other methods than simulation need to be considered. As far as we know, there is no other similar method in the
literature and therefore these heuristics may represent a novelty in strategic network planning studies. The proposed heuristics
are implemented in a strategic planning software tool and an example of their application for a case in Spain is presented. The
proposed heuristics are used for telecommunications regulatory studies in several countries.
Copyright © 2009 A. Portilla-Figueras et al. This is an open access article distributed under the Creative Commons Attribution
License, which permits unrestricted use, distribution, and reproduction in any medium, provided the original work is properly
cited.
1. Introduction
Mobile communications field is, nowadays, one of the
most relevant technology research topics. Its fast evolu-
tion, from analog (like Advance Mobile Phone System),
to digital systems (like Global Systems for Mobile (GSM)
Communications or IS-95), and currently to 3G multiser-
vice systems, such as Universal Mobile Telecommunication
Systems (UMTSs) and 4G Long Term Evolution (LTE), has
required the development of new technics, and produced the
convergence of several telecommunication research areas. On
the other hand, the high level of acceptance of the mobile
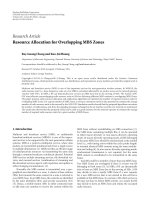
technologies by customers (see Figure 1), and their need of
new and more complex services, is a catalytic element for
doing research to obtain more efficient technics in mobile
communications.
The general architecture of a mobile network may be
described in the same way as the traditional fixed network;
it is formed by an access network and a backbone network.
The access network is named Base Station Subsystem (BSSs)
in 2G systems like GSM, and UMTS Terrestrial Radio Access
Network (UTRAN) in 3G systems like UMTS. The backbone
network corresponds to Network Switching Subsystems in
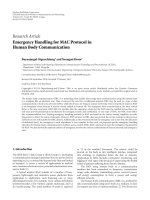
GSM and to the Core Network in UMTS. Figure 2 shows an
example of these architectures.
One critical problem in mobile network design is the
determination of the cell radius [1]. The underestimation
of the cell radius leads to an overestimation of the number
of Base Stations (BTS) required to provide service in an
specific area, and hence excessive deployment investment
costs. This is obviously bad news for the business of the
network operator. On the other hand, an overestimation of
the cell radius results in the installation of fewer BTSs than
needed, and then in shadow areas. This means the network
operator provides bad Quality of Service (QoS) in terms of
coverage, and customers will complain.
2 EURASIP Journal on Wireless Communications and Networking
10
−1
10
0
10
1
10
2
10
3
10
4
Customer millions
2002 2003 2004 2005 2006
Ye a r
GSM
3G
Figure 1: GSM and 3G customer evolution (millions).
Most of second generation systems, like GSM, use Time
Division Multiple Access (TDMA) as radio access technology
and therefore, they can be defined as hard blocking systems,
that is, the number of users in the system is limited
by the amount of hardware installed in the Base Station
(BTS). Therefore, in GSM systems, the cell radius is mainly
determined by the coverage planning (in this paper the term
coverage refers to radio propagation coverage). In case that the
QoS required (expressed as the blocking probability) is not
fulfilled, the network operator must install more electronic
equipment to incorporate more traffic channels to the BTS.
It is a relatively simple task in TDMA systems.
Most of third generation systems, like UMTS, are based
on WCDMA. These are soft blocking systems, where the
number of users is not limited by the amount of channels in
the BTS, but by the interference generated by their own users,
and the users in neighbor cells. The maximum interference
allowed in the system can be measured by a parameter named
interference margin, which is used in the calculation of the
link budget at the coverage planning process, and also to
calculate the maximum number of users in the capacity
planning process. Note that there is a tight relationship
between the capacity and coverage planning processes in
this case. Furthermore, the design of 2G systems is mainly
oriented to the voice service [2], but 3G systems are designed
to handle trafficfromdifferent sources, with different bit
rates and, obviously, different requirements in terms of
Grade and Quality of Service [3]. It is straightforward that
this issue increases the planning complexity.
Cell radius calculation in WCDMA systems has been
extensively studied before in the literature [4–8]. However,
most of these models only consider a single service, which
may result in a nonaccurate estimation of the cell radius
in multiservice environments. In addition the studies of
multiservice environments are usually based on simulation
[9, 10], which requires a large set of input parameters.
Moreover, user and service simulation models are usually
quite complex. As we will see in the body of the paper,
the problem of the cell radius determination in WCDMA
systems is equivalent to a problem of capacity assignment
among different services. Another approach to this complex
problem starts from the cell radius, and finds the optimal
capacity assignment to the services [11] or to study the
maximum throughput.
Currently most operators are deploying their 3G and
beyond networks in order to offer high speed data services
to their customers. Furthermore in developing countries,
or in some rural areas where the 2G deployment is not
completely finished, the operators are studying whether
implement a proper 3G infrastructure or subcontract it to
the dominant operator. Note that a very relevant factor in
this decision will be the price that the dominant operator
establishes, which may be sometimes conditioned by the
National Regulatory Authority (NRA). The determination
of the interconnection, roaming or termination price must
be based on technoeconomic studies under the so-called
Bottom-Up Long Run Incremental Cost model (LRIC) [12,
13] which is recommended by the European Union [14]. The
objective of the LRIC is to estimate the costs incurred by an
hypothetical operator with the same market power of the
operator under study, that tries to implement his network
with the best suitable technology. To do this, a complete
design of the network has to be done at a national level,
that is, to calculate the network equipment for each city,
town, rural area, highway, road, and so on. Based on this,
the mobile operator will have enough information to make
the decision about built or buy, and/or to claim to the NRA
with objective data to obtain better price.
It is straightforward that constructing a LRIC model
requires the calculation of a large number of different
scenarios, where the cell radius of the Nodes B (the 3G
Base Stations), has to be estimated. Therefore the heuristic
model used for this estimation has to be general enough
to be applied to a large set of scenarios with a reduced
set of parameters, so simulation is not valid. Furthermore,
note that obtaining a good LRIC model for a country
involves thousands of B Nodes, so the heuristics applied
must be computational efficient. Thus, modern heuristics
as evolutionary computation are limited approach in this
case. Finally the selected calculation method has to be able
to provide a fair estimation of the cell radius.
This paper proposes several novel algorithmic
approaches to the cell radius determination problem
under the constraints presented previously. Our approach
starts from a multiservice scenario and the maximum
capacity of the cell, and based on the services parameters we
obtain the optimal capacity assignment for each service, and
then, as final objective, we obtain the optimal cell radius.
We propose the following heuristics. First, an iterative load
factor reassignment heuristic is presented, which is able to
solve the problem giving encouraging results. An analytical
algorithm is also proposed and compared with the iterative
heuristic. Finally, a combination of both algorithms is also
tested, where the analytical approach is used to generate
an initial solution for the iterative approach. We will show
EURASIP Journal on Wireless Communications and Networking 3
MS
MS
BSC/RNC
BTS’s/B node
BSS/UTRAN
VLR
G-MSC
MSC
OMC
HLR AUC
EIR
NSS/Core network
Figure 2: Mobile network general architecture.
the performance of our approaches in several test problems
considering WCDMA multiservice scenarios. With the
proposed heuristics we fulfil all the requirements defined in
the paragraph previously, that is, a fast procedure that is able
to provide good estimations of the cell radius using a limited
set of input parameters, and hence easy to use in different
scenarios.
The rest of the paper is structured as follows. Next
section defines the cell radius determination problem in
WCDMA networks. In Section 3 we propose the heuristics
for solving the problem, and in Section 4 we show the
performance of the heuristics proposed by performing some
experiments in WCDMA multiservice scenarios. We also
present the implementations of our heuristics in a software
tool named DIDERO and their applications in different
regulatory projects. Section 6 concludes the paper giving
some final remarks.
2. Cell Radius Determination in
WCDMA Networks
Let us consider a 3G mobile network based on WCDMA
technology, where the mobile operator provides a set of S
services (voice, data 16 kbps, data 64 kbps, etc.) each one
defined by a set of parameters P (binary rate, user density,
quality of service, etc.). The mobile operator needs to have an
estimation of the number of B Nodes in each area and thus it
is required to calculate the cell radius for each B Node. As it
is mentioned in the introduction, cell radius determination
in WCDMA is a complicated process because, opposite to
TDMA, the number of users and the total throughput is
limited by the amount of interference in the radio interface.
Of course, this interference not only limits the capacity of
the system, but also the coverage by propagation, because the
total noise in the system increases as more users are active.
Propagation coverage studies mainly imply two steps.
The first one is to calculate the maximum allowed propaga-
tion loss in the cell, defined here as L
pathloss
, and the second is
to use an empirical propagation method to calculate the cell
radius for this pathloss. Typical methods are the Okumura
Hata COST 231 model, [15], or the Walfish and Bertoni [16].
The value of L
pathloss
is calculated using a classical link
budget equation
P
Tx
+
G −
L −
M − L
pathloss
= R
Sens
,(1)
where P
Tx
is the transmitter power,
G is the sum of all gains
in the chain, transmitter antenna, receiver antenna, and soft
handover gain,
L is the sum of all the losses in cables, body
losses, and in-building losses, R
Sens
is the receiver sensitivity
which includes the required Eb/No, thermal noise, receiver
noise figure, and processing gain, and finally,
M is the
different margins we need to take into account, fast fading
margin, log-normal fading margin, and the interference
margin, M
i
. This interference margin is a very relevant value,
because it measures the maximum interference allowed
in the system due to its own users. Therefore this value
indirectly limits the maximum number of users in the
system. Note that all the parameters in (1) are inputs of
the system and therefore L
pathloss
can be obtained from this
equation.
As it was mentioned before the cell radius by propagation
is obtained applying the L
pathloss
into an empirical propaga-
tion method. In our work we have used the 231-Okumura
Hata model because it is broadly considered as the most
general one in mobile networks applications [17]
L
b
= 46.3+33.9 · Log
f
−
13.82 · Log
(
h
BTS
)
− a
(
h
Mobile
)
+
44.95 − 6.55 · Log
(
h
BTS
)
·
Log
(
R
p
)
+ C
m
,
(2)
where f is the frequency in MHz, h
BTS
is the height of the
Node B in meters, h
Mobile
is the height of the mobile user in
meters, and R
p
is the cell radius by propagation in Km. Note
4 EURASIP Journal on Wireless Communications and Networking
that a(h
Mobile
)andC(m) are parameters defined in the COST
231 specification. They provide the influence of the height of
mobile terminal and the type of city, respectively, and they
aredefinedasfollows:
a
(
h
Mobile
)
=
1.1 · Log
f
− 0.7
· h
Mobile
−
1.56 · Log
f
− 0.8
,
C
m
=
⎧
⎪
⎪
⎪
⎪
⎨
⎪
⎪
⎪
⎪
⎩
0 dB for medium sized cities
and suburban centres,
3 dB for metropolitan centres.
(3)
Note that as the value of Eb/No changes for the different
services, the propagation coverage study has to be done
specifically for each one, and of course for the uplink and the
downlink. Therefore the formulation explained previously,
and the value R
p
, has to be applied for each service i and each
direction (Uplink (UL) and Downlink (DL)) obtaining a set
of two vectors containing, for each service, the cell radius by
propagation, (R
p
UL
and R
p
DL
)
R
p
DL
=
R
p
DL
i
; i = 1, , S
,
R
p
UL
=
R
p
UL
i
; i = 1, , S
.
(4)
Now we focus on capacity studies. As it is done in
propagation studies, cell radius must be calculated inde-
pendently for the uplink and the downlink. The equations
that determines the radius in both directions are quite
similar. Then for simplicity reasons, this paper focuses in the
calculation of the cell radius for the downlink case, since this
is the most restrictive direction [18–20].
The interference margin used in (1) determines the
maximum load of the cell, η
DL
, by means of the following
relation, [18, 21]
η
DL
=
1
10
M
i
/10
− 1.
(5)
This factor indicates the load of the cell. If η
= 0 there is
no user in the system. On the opposite if η
DL
1, the amount
of interference in the system grows to
∞ and hence the system
goes to an unstable state. Therefore typical values of the M
i
are between 3 and 6 dB, which means a load of 0.5–0.75.
Although in the real operation of the system, there is
no capacity reservation between the different services, in the
dimensioning process it is required to allocate part of the
capacity to each service. Therefore the load factor, that is, the
capacity of the cell, must be allocated to the different services,
resulting the load factors of the each service L
To t a l DL i
η
DL
=
S
i=1
L
To t a l DL i
< 1.
(6)
The number of active connections of each service is
calculated by dividing the total load factor of each service
type i over the average individual downlink load factor of the
connections of the service
Nac
DL i
=
L
To t a l DL i
L
DL i
,
(7)
where the downlink load factor is defined by the following
equation:
L
DL i
=
(
Eb/N
0
)
DL i
· σ
i
(
W/V b
i
)
·
1 − φ
+ f
,
(8)
where
φ is the so-called downlink orthogonality factor, Vb
i
is
the binary rate, σ
i
is the so-called activity factor of the service
i,
f is the average intercell interference factor, and W is the
bandwidth of the WCDMA system.
The total offered traffic demand, A
DL i
in Erlangs, is
obtained by using the inversion of the Erlang B Loss formula
[22]. The inputs for this algorithm are the maximum number
of active connections in the cell Nac
DL i
and the Quality
of Service (QoS) of the service expressed by the blocking
probability Pb
i
A
DL i
1+ f
= Erlang B
−1
Pb
i
, Nac
DL i
·
1+ f
.
(9)
Note that in (9) the total offered traffic demand, A
DL i
,
is divided by the factor (1 +
f ) and the maximum number
of active connections, Nac
DL i
, of the service i is multiplied
by it. This is included to considerer the soft blocking feature
inherent to the WCDMA system, [23].
Multiservice traffic in UMTS has been extensively studied
in the literature [24]. However in the strategic planning
mobile operators trend to use simplified models that pro-
vides under estimations of the cell capacity to be in the
safe side when they estimate the number of Node B’s to
provide service to the customers in the area under study,
[25]. Because of the reasons stated in the previous sentence,
in this proposal we use the Erlang B formulation. However it
is and independent part that can be substituted by any other
traffic model formulation.
The number of users in the cell (M
users
DL
i
) is obtained from
the division of the total offered traffic demand for service i,
(A
DL i
in Erlangs), by the individual traffic of a single user
of this service (obtained from the connection rate α
i
and the
mean service time ts
i
):
M
users
DL
i
=
A
DL i
α
i
· ts
i
.
(10)
The cell radius for each individual service is calculated as
a function of the number of sectors in the BTS, N
Sectors
, the
number of users of service i per sector M
users
i
and the user
density ρ
i
as follows (note that a Node B may be divided into
several sectors. Each sector corresponds to a cell):
R
t
DL
i
=
M
users
DL
i
· N
Sectors
π · ρ
i
.
(11)
EURASIP Journal on Wireless Communications and Networking 5
Definition of MI
Outer problem
Calculation of
path loss
Calculation of
cell radius by
propagation (Rp)
Inner problem
Allocation of
capacity to the
different services
Calculation of the
cell radius by traffic
load (R
t
)
for all services
No
No
R
t
i
∼= R
t
j
?
Ye s
R
t
= minR
t
i
Rp ∼= R
t
?
Ye s
End: R
cell
= min(Rp,R
t
)
Figure 3: Inner and outer WCDMA problems in dimensioning process.
Note that this process has to be done also for the uplink
direction (UL). Therefore, at the end we have obtained
another set of two vectors (one for the uplink and one for the
downlink), with the cell radius by capacity of each service:
R
t
DL
=
R
t
DL
i
; i = 1 ···S
,
R
t
UL
=
R
t
UL
i
; i = 1 ···S
.
(12)
Note that the values of R
t
DL
i
and R
t
UL
i
largely depend on
the distribution of the capacity over the different services
by means of the total load factor allocated to each service
L
To t a l UL i
and L
To t a l DL i
. A bad allocation will lead to large
differences in the values of the radius, while an equilibrated
one will produce approximately the same value for all the S
services.
Note that at the end of this process we have obtained a set
of four vectors, R
p
UL
, R
p
DL
, R
t
UL
,andR
t
DL
. The final cell radius,
R
Cell
will be the minimum value between R
p
T
and R
t
T
which
represents the most restrictive cell radius under propagation
and traffic criteria respectively
R
t
T
= Min
R
t
UL
, R
t
DL
,
R
p
T
= Min
R
p
UL
, R
p
DL
,
R
Cell
= Min
R
p
T
, R
t
T
.
(13)
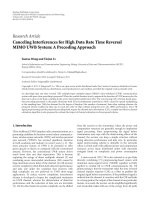
As a conclusion of this section we have identified two
problems in the cell radius dimensioning, that can be named
outer problem and inner problem, as it is shown in Figure 3.
(1) The outer problem is to find the best value for the
Interference Margin, M
i
. This will be the value when
the cell radius by capacity (traffic), R
t
T
, is the same as
by propagation, R
p
T
.
(2) The inner problem that is to find the best capacity
allocation, given a value of the M
i
over the complete
set of services S. With this the cell radius by capacity,
R
t
T
, is maximized.
6 EURASIP Journal on Wireless Communications and Networking
Radius data
144 kbps
Radius data 64
kbps
No optimal capacity allocation (Mi)
results in very different radius
Radius
voice
service
Radius data
144 kbps service
Radius data 64 kbps
Radius voice service
Optimal capacity allocation (Mi) results
invery similar radius
Figure 4: Scheme of the cell radius with optimal and no optimal capacity allocations.
The outer problem is solved just making an iterative
process to equilibrate the value of the cell radius between
the resulting value calculated by propagation studies and the
resulting one calculated by capacity studies. This is done by
means of increasing the value of the interference margin,
M
i
, when the cell radius by propagation is higher than by
capacity or vice versa. The inner problem is much more
complicated because it implies the use of the trafficconcepts
and nonlinear process which underlies to (9)–(12).
This paper focuses on the design of heuristics for solving
the inner problem (from now on we will focus on the
donwlink direction, we therefore do not include the DL
subindex in the formulation since it is assumed). With
the definitions given before, the cell radius determination
problem by capacity criterium can be defined as follows:
Find L
To t a l i
, i = 1, , S, such that
η
=
S
i=1
L
To t a l i
< 1
(14)
which maximizes R
Cell
. Note that we focus on the inner
problem, where the traffic is the most restrictive factor,
therefore, R
Cell
= R
t
T
in this case.
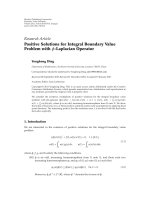
Note that if we allocate optimally the capacity to the
services, by means of the L
To t a l i
values, the cell radius of all
service will have almost the same value, and hence the cell
radius by capacity will be maximized. Note that a suboptimal
allocation leads to very different values of the cell radius of
the different services, and hence to a bad estimation of the
final radius. This situation is shown in Figure 4, where the
dashed red arrow determines the final cell radius.
3. Proposed Heurist ics
3.1. Iterative Load Factor Redistribution Heuristic. This first
heuristic we propose for the cell radius determination
problem starts from an initial load factor assignment, usually
provided by estimations of the network planner [7]. From
this initial assignment L
Tot a l
= [L
To t a l 1
, ,L
To t a l S
], we can
calculate an initial solution for the cell radius using (7)to
(11). If this initial cell radius is not the optimal one, the
only service which is using its total capacity is the one with
minimum value of R
t
i
associated. The following example
shows it in detail.
Let us consider a scenario with three services, S
1
= voice
at 12.2 Kbps, S
2
= data at 64 Kbps and S
3
= data at 144 Kbps.
Let us also consider that a initial load factor assignment is L
=
[0.105, 0.271,0.373]. With this, the values of the cell radius
are R
t
= [343, 976,721] meters. Note that the limiting value
is the cell radius of the first service S
1
, that is 343 meters.
With this value of the cell radius R
t
T
= 343 m, the load factors
that the services are really using are L
= [0.105, 0.56, 0.111].
So it is obvious that the initial load factor assignment is not
correct, because we are not optimizing the cell usage (note
that this example is a hard simplification of the complete
process).
Note that the rest of the services will use less capacity than
they have initially assigned. Let us call this capacity as L
Real i
.
Therefore, there is some remaining capacity, L
rem
defined
as
L
rem
= η −
S
i=1
L
Real i
.
(15)
This remaining capacity has to be redistributed over the
considered services, so that a new cellular radius can be
calculated using (11). This will produce new values of L
Real i
.
This iterative process is followed until the difference between
two consecutive cell radius is less than a given threshold
,
usually
= 0.01.
SeveralprocedurescanbeappliedfortheL
rem
distribu-
tion over the different services. The simplest one is to find
the balanced distribution of L
rem
among all services in the
system. This method leads, however, to suboptimal solutions,
since the service with the most restrictive cell radius in one
EURASIP Journal on Wireless Communications and Networking 7
assignment is kept again as the most restrictive one in the
new assignment. A better distribution can be obtained by
assigning a larger part of the exceeding load factor, L
rem
,to
the service j with most restrictive cell radius, R
t
T
,bymeansof
a prioritizing factor f
assign
(0.5 <f
assign
< 1),andabalanced
division among the rest of services:
L
To t a l j
= L
To t a l j
+ f
assign
· L
rem
,
j
R
t
DL
j
= Min
R
t
DL
i
,
L
To t a l i
= L
To t a l i
+
1 − f
assign
·
L
rem
S − 1
, i
/
= j,
f
assign
>
1 − f
assign
S − 1
.
(16)
The value of the prioritizing factor, f
assign
, depends on
the differences of the values of the cell radius of the different
services. If the difference Max(R
t
DL
i
)-Min(R
t
DL
i
) is large the
value of f
assign
will be near to 1; otherwise, it will be near to
0.5.
The main drawback of this method is the dependency
on the initial solution, that is, the dependency on the initial
load factor assignment. Note also that the convergence of the
algorithms depends on how the remainder capacity (given
by L
rem
) is distributed over the different services. A poor
distribution procedure may result in a high number of
iterations or even may fail to find the solution.
3.2. The Reduced Algorithm. The second approach we pro-
pose to solve the cell radius determination problem is to find
a mathematical model, which calculates an accurate value
of the cell radius, under any service scenario and any initial
conditions, expressed in terms of the load factor η and the
parameters of the services S.
The proposed model is named reduced algorithm, since
it reduces all the services in the system to a single artificial
service to solve the problem. The method starts considering
an arbitrary cell radius, typically R
= 1000. Then, the model
calculates the total trafficdemandoffered to the cell, A
i
,for
each service i, by means of the user density of each service,
ρ
i
, the individual call rate, α
i
, and the mean call duration, ts
i
.
The reduction of the set of services to a unique arti-
ficial/equivalent one is performed by a procedure based
on a proposal of Lindberger for ATM networks [28]. This
proposal is obviously extended to the singularities of the
WCDMA cell design. The artificial service is defined in terms
of equivalent parameters: binary rate, Vb
eq
, call rate, α
eq
,
mean call duration, ts
eq
, blocking probability, Pb
eq
,activity
factor, σ
eq
and user density, ρ
eq
. Following the Lindberger
formulation, the parameters of the artificial service are
calculated on the basis of the traffic, A
i
, and the binary
rate, Vb
i
,ofeachservicei considered in the scenario.
The complete set parameters are defined by the following
equations:
Vb
eq
=
S
i=1
A
i
· Vb
2
i
S
i
=1
A
i
· Vb
i
,
Pb
eq
=
S
i
=1
Pb
i
· A
i
· Vb
i
S
i=1
A
i
· Vb
i
,
α
eq
=
S
i=1
α
i
· A
i
· Vb
i
S
i=1
A
i
· Vb
i
,
ts
eq
=
S
i
=1
ts
i
· A
i
· Vb
i
S
i
=1
A
i
· Vb
i
,
ρ
eq
=
S
i=1
ρ
i
· A
i
· Vb
i
S
i=1
A
i
· Vb
i
,
σ
eq
=
S
i=1
σ
i
· A
i
· Vb
i
S
i
=1
A
i
· Vb
i
,
Eb
No
eq
=
S
i=1
(
Eb/No
)
i
· A
i
· Vb
i
S
i=1
A
i
· Vb
i
.
(17)
Considering this new artificial service, the reduced
method calculates a corresponding value of the cell radius,
R
Reduced
, assigning the whole load factor, η, to the artificial
service. From the obtained R
Reduced
, the load factors for
each individual service, L
Reduced i
, can be calculated inverting
the cell radius calculation process shown in Section 2,see
[18, 21] which is summarized as follows. From the R
Reduced
,
it is possible to calculate the maximum number of users of
each service i per sector, and hence the total trafficoffered
to the system. Using the Erlang formula, with the blocking
probability, Pb
i
, the number of active connections, Nac
i
,
of each service i is obtained. Finally the value L
Reduced i
is
calculated by means of the individual load factor of the
service, L
i
, times the number of active connections, Nac
i
.
The total load factors of each service are obtained by
simple reduction to the whole load factor, η,
L
To t a l i
=
L
Reduced i
S
i
=1
L
Reduced i
· η. (18)
Considering these values of the load factors, a new
solution of the cell radius for each individual service is
calculated following the process in Section 2, obtaining the
solution vector, which minimum value is the cell radius.
3.3. Combined Heuristic. The third heuristic we consider is
to find the hybridization of the two algorithms previously
described. The reduced algorithm, which does not require
an initialization of the load factors, is used for calculating
the starting point for the Iterative load factor redistribution
heuristic. Thus, it is expected a better performance of the
iterative heuristic since it starts from a better initial solution.
8 EURASIP Journal on Wireless Communications and Networking
Table 1: Radio propagation parameters.
Node B parameters Mobile terminal parameters
Height B (m) 50 Height (m) 1.75
Power (W) 10 Power (W) 0.25
Antenna gain (dB) 10 Antenna gain (dB) 0
Cable loss (dB) 3 Skin loss) 3
Noise figure (dB) 5 Noise figure (dB) 7
Frequency (MHz) 1950 Frequency (MHz) 2140
Common parameters
Log normal fading margin (dB) 7.3 Fast fading margin (dB) 2
UL intercell interference ratio 0.88 Soft handover gain 3
DL intercell interference ratio 0.88 Interference margin (dB) 6.02
Sectors 1
Table 2: Service parameters.
P S
1
S
2
S
3
S
4
S
5
S
6
Voice/data Voice Data
Vb 12.2 12.2 64 64 144 384
Us 030300
Eb
N
0
DL
4.4 7.0 2.5 5.3 2.3 2.4
φ 0.5 0.5 0.5 0.5 0.5 0.5
Pb 0.01 0.01 0.05 0.05 0.05 0.05
σ 0.6711111
4. Computational Experiments and Results
In order to validate the heuristics presented in this paper, we
have tested them in several experiments based on scenarios
with different service combinations. Specifically, we have
defined mixtures of two, three and four services, each one
having its own requirements in terms of binary rate, quality
of service, user movement speed and user density in the
area under study. Furthermore we have modified the traffic
figures of the services to consider balanced and unbalanced
traffic. Balanced traffic means that the individual throughput
of each service is similar to the throughput of the other
services.
We have used an interference margin of 6 dB which
means a cell load factor of 0.75. We have also configured the
radio propagation parameters to make the capacity the most
restrictive criteria. This set of radio propagation parameters
is shown in Ta bl e 1 .
The parameters P of the different services S
i
are shown
in Tab le 2 ,withVb being the binary rate, Us the user speed
in Km/h (services in which users have different speeds can
be considered as different services. This is because they have
different values of Eb/N
0
and therefore different values of
individual load factor L
i
), (Eb/N
0
)
DL
the bit energy-to-noise
ratio in the downlink,
φ the orthogonality factor and σ
the activity factor. The quality of service is defined by the
Blocking/Loss probability Pb. The value of the total downlink
load factor, η, is 0.75 according to the M
i
previously defined.
Table 3: Traffic figures for balanced traffic experiments.
P S
1
S
2
S
3
S
4
S
5
S
6
α 111111
ts 180 180 240 240 360 500
ρ 300 84 147 45 90 46
Table 4: Traffic figures for unbalanced traffic experiments.
S
1
S
2
S
3
S
4
S
5
S
6
α 111111
ts 162 162 23.4 23.4 7.92 7.92
ρ 1008 335 80 26 70 35
Finally, the value of the average intercell interference factor f
to 0.88 [29].
As we have mentioned before the complete set of
scenarios are divided into balanced and unbalanced traffic
scenarios. Tables 3 and 4 provides the traffic figures for the
different services in these two general categories. In this case
α and ts are the call attempt rate and the service time in
the business hour, respectively, and ρ is the user density in
the considered area. Tab le 5 shows the combination of the
services involved in each experiment. Note that the third
column in the table shows if the experiment is based on
balanced (B) or unbalanced (U) traffic.
EURASIP Journal on Wireless Communications and Networking 9
0
100
200
300
400
500
600
700
Cell size (m)
1234567 8
Scenarios
Iterative
Reduced
Combined
Figure 5: Comparison of the cell radius obtained by the different
heuristics considered in all scenarios.
Table 5: Experiments definition.
Scenario Services Traffic
Exp-1 S
1
, S
3
B.
Exp-2 S
1
, S
3
U.
Exp-3 S
1
, S
3
, S
5
B.
Exp-4 S
1
, S
3
, S
5
U.
Exp-5 S
1
, S
2
, S
3
, S
4
B.
Exp-6 S
1
, S
2
, S
3
, S
4
U.
Exp-7 S
1
, S
3
, S
5
, S
6
B.
Exp-8 S
1
, S
3
, S
5
, S
6
U.
The results of the different experiments are shown
in Tabl e 6 and Figure 5. For the iterative and combined
algorithms, Ta bl e 6 also shows the number of iterations. The
reduced algorithm obtains the optimal value of the cell radius
in all experiments, excluding those scenarios in which users
are moving at different speeds. This low performance of the
reduced algorithm is due to the fact that the differences in
the individual load factors of a service with different user
speeds are very small. Therefore the algorithm is not able to
distinguish between them.
As it was mentioned in Section 2, the optimum value
of the cell radius is obtained when there are quite small
differences in the cell radius of the different services. We will
illustrate this in Experiment 3. In this experiment, we have
compared the results obtained by the three heuristics pro-
posed against the cell radius calculated with an assignment
done using the binary rate and the user density, let us name
it free assignment (FA) following the equation
L
To t a l i
=
Vb
i
· ρ
i
S
i
=1
Vb
i
· ρ
i
.
(19)
100
150
200
250
300
350
400
450
Cell size (m)
12345678910
Iterations
Iterative
Combined
Figure 6: Number of iterations to convergence for the iterative and
combined heuristics (experiment Exp-5).
The initial values of the load factors L
To t a l i
are L
To t a l 1
=
0.105 for the service S
1
,voice,L
To t a l i
= 0.271 for S
2
,data
64 Kbps and L
To t a l i
= 0.373 for S
3
, data 144 Kbps. The
results for the downlink cell radius per traffic are shown in
Ta bl e 7 .
Note that the cell radius of each service is quite similar in
the three proposed heuristics but in the FA the cell radius of
the S
1
is almost 50% larger than S
3
.
Another interesting point to observe is the final occu-
pancy level of the load factor. In case of an optimal allocation,
the sum of the individual load factors, allocated to the
services after the cell radius is calculated has to tend to the
limit established in the design, in our experiments η
= 0.75.
The results are shown in Ta bl e 8 . Note that the proposed
heuristics use more than 99% of the total available capacity,
while the FA only uses 62%.
Finally note that the combined algorithm always obtains
the optimal value even in scenarios with different users
speeds, and it requires fewer number of iterations than
the iterative algorithm. Figure 6 shows a comparison of the
number of iterations needed to obtain the optimum cell
radius in problem Exp-5. Note that the combined heuristic
obtains the optimum cell radius faster than the iterative
algorithm, since it starts from the result obtained by the
Reduced heuristic.
Finally, regarding the computation time, the three
algorithms we propose in this paper for the cell radius
determination problem obtain the solution to the problem
in less than 1 second. This is a very important point
for the inclusion these algorithms in a strategic network
planning tool, where a large number of scenarios have to be
calculated.
4.1. Validat ion and Limitations of the Proposed Heuristics.
In order to validate our heuristics we have compared the
combined algorithm (the one that yields better results in
10 EURASIP Journal on Wireless Communications and Networking
Table 6: Cell radius (in metres) for each experiment calculated using the proposed heuristics.
Experiment Iterative Reduced Combined
Radius (m)/Iters Radius (m) Radius (m)/Iters
Exp-1 530/4 529 530/2
Exp-2 616/7 616 616/1
Exp-3 322/6 322 323/2
Exp-4 572/9 572 572/2
Exp-5 422/10 400 422/6
Exp-6 532/13 352 532/13
Exp-7 187/6 188 188/1
Exp-8 475/7 466 475/3
Table 7: Cell radius (in metres) for the different services in Experiment 3.
Experiment S
1
(Voice) S
3
(Data 64 Kbps) S
5
(Data 144 Kbps)
Radius (m) Radius (m) Radius (m)
Iterative 324 324 322
Reduced 322 325 322
Combined 325 324 323
FA 335 303 224
Table 8: Resulting load factors for the different services.
Experiment S
1
(voice) S
3
(data 64 Kbps) S
5
(data 144 Kbps) Sum
Iterative 0.074 0.222 0.448 0.744
Reduced 0.072 0.223 0.448 0.743
Combined 0.075 0.222 0.449 0.746
FA 0.047 0.137 0.280 0.464
Table 9: Services mixtures in [26].
Service combination Mix 1 Mix 2 Mix 3
Voice 95 80 10
Data 64 Kbps 3 15 30
Data 144 Kbps 1.5 4 30
Data 384 Kbps 0.5 1 30
Total bandwidth (Kpbs) 557 809 1104
the previous experiments), with the results in [26, 27]. In
[26] the authors study the cell radius with three different
combination of services as it is shown in Ta b le 9 .In
[26] the capacity study is not based on a customer basis
but considering the total bandwidth offered to the cell.
This means that there is no significative impact of service
combination in the cell radius. This is not completely
accurate, because the service combination and the customer
distribution all over the cell have a major relevance in the
cell radius. However, the experimental frame given in [26]
can be useful for benchmarking purposes. Thus, in order to
apply our combine heuristic to the problems in [26]wehave
used the configuration parameters as the ones given in [26],
specifically, the interference margin (M
i
)hasbeenfixedto
4.31 dB.
Table 10: Comparison of the resulting cell radius.
Service combination Value in [26] Combined heuristic
Mix 1 535 552
Mix 2 528 544
Mix 3 527 520
The comparison results are shown in Ta b le 1 0. Note that
in service combination Mix 1 and Mix 2 the combined
heuristic outperforms the result obtained in [26]. In the
service combination Mix 3 the cell radius calculated by
our proposal is slightly lower. The reason for this is that,
as we mentioned in the previous paragraph, the authors
in [26] only use the total bandwidth required from the
cell and do not consider each individual connection. This
makes that the influence of the services mixture is quite
low in their results. However, note that in the formulation
of this paper, we do consider each service individually, and
therefore, the influence of service mixture is much important
in our heuristic, which reflects better the real behavior of a
WCDMA system.
In order to carry out a second comparison, we have
used the evolutive algorithm developed in [27]. Evolutionary
programming is a population based heuristic, which was first
proposed as an approach to artificial intelligence [30]. It
EURASIP Journal on Wireless Communications and Networking 11
Table 11: Result comparison between the combined algorithm and
the EAP in [27].
Experiment EA in [27] Combined
Radius (m) Radius (m)
Exp-1 530 530
Exp-2 616 616
Exp-3 322 323
Exp-4 573 572
Exp-5 425 422
Exp-6 505 532
Exp-7 183 188
Exp-8 475 475
has been successfully applied to a large number of numer-
ical optimization problems including telecommunications
problems [31]. In this case we have used the same set of
experiments as in Section 4, comparing the performance
of the evolutionary algorithm (EA) in [27] against the
combined algorithm proposed in this paper. The results
are shown in Ta bl e 1 1. Note that the differences between
the results of the combined algorithm and the evolutionary
algorithm are quite small (about 1%) in all experiments
but in the Exp-7, where the combined algorithm proposed
obtains a result about 5% better. In this case the EA falls into
a local solution near the optimum solution.
As final remarks for this section, note that the main
limitation of the proposed heuristics in this paper is that they
consider trunk reservation for the capacity assignment. This
means that the capacity allocated to service i is reserved for
this service exclusively, and no other can use it, even when
there is some free capacity. In the practical operation of the
UMTS system, the capacity is available for all services and
only when the system goes to a heavy loaded situation, the
capacity reservation will be activated. This also means that,
in practice, the cell radius will be slightly larger than the one
calculated with the proposed algorithms. However, since the
algorithms provide a conservative estimation, they are valid
to estimate the maximum network investment.
5. Implementation, Application, and Real Cases
5.1. Implementation and Application. The proposed algo-
rithms are implemented in a software tool for the strategic
design of hybrid 2G and 3G networks. An earlier version
software tool named DIDERO, was originally presented in
[32].
Using this tool we present a study carried out for Spain.
The objective of this study is to compare the differences in
the number of Node Bs and in the total network investment
cost using different allocations of the load factors to the
services. We will use the combined heuristic presented before
and three different assignments (A
1
, A
2
, A
3
) for comparison
purposes, based on the binary rate, user density and the
traffic, that are the assignments done by a common network
planner.
The A
1
assignment is done considering the binary rate of
the service, that is, a service with higher binary rate gets more
capacity following the equation
L
To t a l i
=
Vb
i
S
i=1
Vb
i
.
(20)
The assignment A
2
takes into account also the user
density:
L
To t a l i
=
Vb
i
· ρ
i
S
i
=1
Vb
i
· ρ
i
.
(21)
Finally the third assignment A
3
considers also the
individual traffic
L
To t a l i
=
Vb
i
· ρ
i
· a
i
S
i=1
Vb
i
· ρ
i
· a
i
.
(22)
The scenario is composed of the 50 most important
counties in Spain, which corresponds to the capitals of the
50 Spanish provinces. We are considering the main cities and
the surrounding towns under their administrative influence.
The cities, their extension and the number of inhabitants are
shown in Ta bl e 1 2.
For this study we have selected the (Exp-3), Experiment 3
with the same propagation parameters exposed in Section 4.
The values of the market share of the operators, the holding
time ts and the call attempt rate α for the different services
are shown in Ta bl e 1 3.
With these premises, the values of the load factors
calculated from A
1
, A
2
,andA
3
are shown in Ta bl e 1 4,
note that the combined heuristic does not require an initial
assignment. The results of the complete Node B deployment
for all experiments are shown in Ta bl e 1 5. Note that even for
an assignment where several parameters are considered, A
3
,
the resulting number of Node Bs is almost 35% higher than
using the combined heuristic proposed.
The total population of the cities in the considered
scenario is 15 258 049. Current Spanish population is 45.12
million (official data of Spanish National Statistic Service),
therefore we can extrapolate our results to obtain a fair
estimation of the number of Node Bs for the whole country.
Considering that the unit investment cost of a Node B
rounds 135000 euros (C
), and that the investment in the
cell deployment is about 60%, [33] of the total network
investment in a mobile network we can estimate the total
network investment for the four cases presented. These
results are shown in Ta bl e 1 6 .
The most impact result is the big difference in the total
investment in the different cases. Comparing with the second
best, that is, with the scenario A3, the difference is about
547 million (C
). This is equivalent to the 0.05% of the
total Spanish Gross Domestic Product which is 1.12 billion
of euros. This result shows the relevance for the network
operator of an accurate network planning.
12 EURASIP Journal on Wireless Communications and Networking
Table 12: Set of 50 cities considered in the scenario.
City Area Km
2
Inhabitants City Area Km
2
Inhabitants
Vitoria 277 235 622 Logro
˜
no 80 147498
Albacete 1126 171 450 Lugo 9856 99571
Alicante 201 333 250 Madrid 607 3294932
Almeria 296 189 669 Malaga 395 584158
Avila 232 55 433 Murcia 882 446483
Badajoz 1470 152 549 Pamplona 24 203111
Palma de M. 213 388 512 Ourense 85 108421
Barcelona 91 165 2876 Oviedo 187 233453
Burgos 108 175 894 Palencia 95 82195
Caceres 1768 95 834 Palmas de G.C. 101 376116
Cadiz 12 137 138 Pontevedra 117 80441
Castell
´
on 108 181 181 Salamanca 39 163641
Ciudad Real 285 78 642 S.C. Tenerife 151 223406
Cordoba 1252 330 410 Santander 35 184435
Coruna 37 252 542 Segovia 164 57349
Cuenca 954 54 917 Sevilla 141 739016
Girona 39 99 561 Soria 272 38778
Granada 88 249 530 Tarragona 62 144006
Guadalajara 36 76 249 Teruel 438 35253
San Sebastian 61 190 099 Toledo 232 83811
Huelva 149 153 699 Valencia 135 819969
Huesca 15 50 704 Valladolid 198 324334
Ja
´
en 424 125 212 Bilbao 41 355064
Le
´
on 402 136 845 Zamora 11 65025
Lleida 212 131 985 Zaragoza 1059 667781
Table 13: Values for spanish scenario.
S
1
S
3
S
5
Vb 12.2 64 144
α 0.2 0.5 1
ts 180 240 360
MarketShare%25 2 1.5
Table 14: Load factors in the assignments.
A
1
A
2
A
3
S1 0.04 0.39 0.09
S3 0.22 0.14 0.11
S5 0.49 0.23 0.55
Total 0.75 0.75 0.75
5.2. Real Cases. The combined heuristic presented here has
been applied in three regulatory processes with National
Regulatory Authorities for the study of the mobile termina-
tion charges and comparisons between 2G and 3G network
deployments. Specifically it has been applied by a work team
with the University of Cantabria and the German consulting
firm WIK Consult in the following countries.
(1) Peru, with the N.R.A, with the N.R.A. Organismo
Supervisor de Inversi
´
on Privada en Telecomunica-
ciones, (OSIPTEL), [34].
(2) Australia, with the N.R.A. Australian Competition and
Consumer Commission, (ACCC), [33].
(3) Switzerland, with the N.R.A. Bundesamt fr Kommu-
nikation, (BAKOM).
6. Conclusions
This paper proposes three different algorithms for the calcu-
lation of the cell radius under traffic criteria in multiservices
scenarios, named iterative, reduced and combined. We have
shown that the three algorithms are able to solve the
cell radius determination problem, providing good quality
solutions. However, the reduced algorithm is not able to
produce optimal solutions when the users are moving
at different speeds. The iterative and combined heuristics
provides the optimal solution in all the cases studied, but
the combined approach converges faster than the iterative
heuristic.
The combined heuristic has been implemented in exist-
ing strategic planning software tool to calculate the Node B
deployment in a whole country. We have presented a work
scenario in Spain were our proposed heuristic obtains better
EURASIP Journal on Wireless Communications and Networking 13
Table 15: Resulting number of Node B’s.
City Combined A
1
A
2
A
3
City Combined A
1
A
2
A
3
Vitoria 44 108 72 44 Logro
˜
no 23 72 44 44
Albacete 23 72 73 45 Lugo 107 107 107 107
Alicante 44 150 107 73 Madrid 394 973 557 557
Almeria 23 72 72 44 Malaga 72 200 107 107
Avila 9 23 23 24 Murcia 73 150 72 72
Badajoz 23 724445 Pamplona 44 724444
Palma de M. 44 200 107 72 Ourense 23 44 23 23
Barcelona 257 973 557 321 Oviedo 45 72 44 44
Burgos 23 72 72 44 Palencia 24 45 23 23
Caceres 24 44 45 23 Palmas de G.C. 72 107 72 72
Cadiz 23 150 150 44 Pontevedra 24 46 23 23
Castell
´
on 23 72 72 44 Salamanca 23 72 44 44
Ciudad Real 24 44 23 23 S.C. Tenerife 45 72 44 44
Cordoba 44 150 107 73 Santander 23 77 44 44
Coruna 44 150 107 72 Segovia 9 23 24 24
Cuenca 9 23 23 24 Sevilla 109 200 150 150
Girona 23 44 44 23 Soria 9 24 9 9
Granada 44 107 107 44 Tarragona 23 44 45 45
Guadalajara 23 44 23 23 Teruel 9 24 9 9
San Sebastian 45 107 72 44 Toledo 24 45 23 23
Huelva 23 72 44 45 Valencia 107 257 150 150
Huesca 9 44 23 23 Valladolid 44 107 73 73
Ja
´
en 23 73 44 23 Bilbao 72 107 72 72
Le
´
on 23 73 44 23 Zamora 9 44 23 23
Lleida 23 72 44 23 Zaragoza 72 200 107 107
Total number of Node Bs
Combined A
1
A
2
A
3
2396 7297 5283 3219
Table 16: Load factors in the assignments.
Combined heuristic A
1
A
2
A
3
Total number of Node Bs 2396 7297 5283 3219
Node Bs, whole country 7085 21578 15623 9519
Node Bs investment MC
956.51 2913.05 2109.03 1285.06
Total network investment MC
1594.18 4855.08 3515.06 2141.77
Difference 0 3260.89 1920.87 547.58
Node B
solutions in terms of number of Node Bs, which represents a
great investment cost saving. This heuristic has been applied
in several regulatory processes under the supervision of the
corresponding National Regulatory Authority.
Acknowledgments
This work has been partially supported by Comunidad de
Madrid, Universidad de Alcal
´
a and Ministerio de Educaci
´
on
of Spain, through Projects CCG06-UAH/TIC-0460, CCG08-
UAH/AMB-3993 and TEC2006-07010. The authors would
like to thank also the support offered by WIK Consult
GmbH, in the different projects, both with their expertise
and funding.
References
[1] T. Ojanper
¨
a and R. Prasad, Wideband CDMA for Third
Generation Mobile Communications, Artech House, Norwood,
Mass, USA, 1988.
[2] D. Hong and S. S. Rappaport, “Traffic model and performance
analysis for cellular mobile radio telephone systems with
prioritized and nonprioritized handoff procedures,” IEEE
Transactions on Vehicular Technology, vol. 35, no. 3, pp. 77–92,
1986.
14 EURASIP Journal on Wireless Communications and Networking
[3] A. Mendez, M. Panduro, D. Covarrubias, R. Dominguez, and
G. Romero, “Quality of service support for multimedia traffic
in mobile networks using a CDMA novel scheduling scheme,”
Computers and Electrical Engineering, vol. 32, no. 1–3, pp. 178–
192, 2006.
[4] K. Gilhouse, I. Jacobs, R. Padovani, A. Viterbi, and L.
Weaver, “On the capacity of a cellular CDMA system,” IEEE
Transactions on Vehicular Technology, vol. 40, no. 2, pp. 303–
312, 1991.
[5] A. M. Viterbi and A. J. Viterbi, “Erlang capacity of a power
controlled CDMA system,” IEEE Journal on Selected Areas in
Communications, vol. 11, no. 6, pp. 892–900, 1993.
[6] K. Sipil
¨
a, Z. Honkasalo, J. Laiho-Steffens, and A. Wacker,
“Estimation of capacity and required transmission power of
WCDMA downlink based on a downlink pole equation,” in
Proceedings of the 51st IEEE Vehicular Technology Conference
(VTC ’00), vol. 2, pp. 1002–1005, 2000.
[7] S. Burley, “Downlink capacity estimation in a WCDMA
cellular network,” in Proceedings of the 12th IEEE International
Symposium on Personal, Indoor and Mobile Radio Communica-
tions (PIMRC ’01), vol. 1, pp. A26–A30, 2001.
[8] B.T.Ahmed,M.C.Ram
´
on, and L. de Haro Ariet, “Capacity
and interference statistics of highways W-CDMA cigar-shaped
microcells (uplink analysis),” IEEE Communications Letters,
vol. 6, no. 5, pp. 172–174, 2002.
[9] K. Sipil
¨
a, M. Jasberg, J. Laiho-Steffens,andA.Wacker,“Static
simulator for studying WCDMA radio network planning
issues,” Proceedings of the IEEE Vehicular Technology Confer-
ence (VTC ’99), vol. 3, pp. 2436–2440, 1999.
[10] J. Laiho, A. Wacker, T. Novosad, and A. H
¨
am
¨
al
¨
ainen, “Verifica-
tion of WCDMA radio network planning prediction methods
with fully dynamic network simulator,” in Proceedings of the
IEEE Vehicular Technology Conference (VTC ’01), vol. 1, no.
54, pp. 526–530, 2001.
[11] C. Dou and Y. Chang, “Class-based downlink capacity esti-
mation of a WCDMA network in a multiservice context,”
Computer Communications, vol. 28, no. 12, pp. 1443–1455,
2005.
[12] P. Um, L. Gille, L. Simon, and C. Rudelle, AModelforCalcu-
lating Interconnection Costs in Telecommunications,PPIAFand
The World Bank, Washington, DC, USA, 2004.
[13] C. Courcoubetis and R. Weber, Pricing Communication Net-
works, John Wiley & Sons, New York, NY, USA, 2003.
[14] European Commission, “European commission recommen-
dation about interconnections. Second part: cost accounting
and account division,” DOCE L 146 13.5.98, pp. 6–35, April
1998.
[15] European Cooperation in the Field of Scientific and Technical
Research EURO-COST 231, “Urban transmission loss models
for mobile radio in the 900 and 1800 MHz bands,” Revision 2,
The Hague, 1991.
[16] J. Walfisch and H. L. Bertoni, “A theoretical model of UHF
propagation in urban environments,” IEEE Transactions on
Antennas and Propagation, vol. 36, no. 12, pp. 1788–1796,
1988.
[17] N. J. Boucher, The Cellular Radio Handbook, John Wiley &
Sons, New York, NY, USA, 2001.
[18] H. Holma and A. Toskala, WCDMA for UMTS, John Wiley &
Sons, New York, NY, USA, 2001.
[19] V. K. Garg and R. V. Yellapantula, “A tool to calculate Erlang
capacity of a BTS supporting 3G UMTS system,” in Proceedings
of the IEEE International Conference on Personal Wireless Com-
munications (ICPWC ’00), pp. 173–177, Hyderabad, India,
2000.
[20] M. Shabany, K. Navaie, and E. S. Sousa, “A utility-based
downlink radio resource allocation for multiservice cellular
DS-CDMA networks,” EURASIP Journal on Wireless Com-
munications and Networking, vol. 2007, Article ID 76193, 11
pages, 2007.
[21] J. Laihoo, A. Wacker, and T. Novosad, Radio Network P lanning
and Optimisation for UMTS, John Wiley & Sons, New York,
NY, USA, 2002.
[22] D. L. Jagerman, “Some properties of the Erlang loss function,”
Bell System Technical Journal, vol. 53, no. 3, pp. 525–551, 1974.
[23] J. Lee and L. Miller, CDMA Systems Engineering Handbook,
Artech House, Norwood, Mass, USA, 1998.
[24] N. Hegde and E. Altman, “Capacity of multiservice WCDMA
networks with variable GoS,” in Proceedings of the IEEE
Wireless Communications and Networking (WCNC ’03), vol. 2,
pp. 1402–1407, New Orleans, La, USA, March 2003.
[25] Z. Ruzicka and S. Hanus, “Radio network dimensioning in
UMTS network planning process,” in Proceedings of the IEEE
18th International Conference on Applied Electromagnetics and
Communications (ICECom ’05), 2005.
[26] C. Cordier and S. Ortega, “On WCDMA downlink multiser-
vice coverage and capacity,” in Proceedings of the 54th IEEE
Vehicular Technology Conference (VTC ’01), vol. 4, no. 54, pp.
2754–2758, 2001.
[27] A. Portilla-Figueras, S. Salcedo-Sanz, A. Oropesa-Garc
´
ıa, and
C. Bouso
˜
no-Calz
´
on, “Cell size determination in WCDMA
systems using an evolutionary programming approach,” Com-
puters and Operations Research, vol. 35, no. 12, pp. 3758–3768,
2008.
[28] K. Lindberger, “Dimensioning and design methods for inte-
grated ATM networks,” in Proceedings of the International
Teletraffic Conference (ITC ’94), vol. 14, pp. 897–906, 1944.
[29] C. K. D’avila and M. D. Yacoub, “Reuse efficiency for
non-uniform traffic distributions in CDMA systems,” IEE
Electronics Letters, vol. 34, no. 13, pp. 1293–1294, 1998.
[30] L. J. Fogel, J. Owens, and M. J. Walsh, Artificial Intelligence
through Simulated Evolution, John Wiley & Sons, New York,
NY, USA, 1966.
[31] H. S. Lim, M. V. Rao, A. W. Tan, and H. T. Chuah, “Multiuser
detection for DS-CDMA systems using evolutionary program-
ming,” IEEE Communications Letters, vol. 7, no. 3, pp. 101–
103, 2003.
[32] K. Hackbarth and J. A. Portilla, “DIDERO 3G a strategic
network planning tool for 3G mobile networks,” International
Journal of Information Technology and Decision Making, vol. 2,
no. 4, pp. 531–555, 2003.
[33] M. Brinkmann, K. Hackbarth, D. Ilic, W. Neu, K. H.
Neumman, and A. Portilla-Figueras, “Mobile termination cost
model for australia,” Final Report, .
[34] W. Neu, K. Hackbarth, and A. Portilla-Figueras, “Analysis
of Cost Studies presented by Mobile Network Operators,”
.