Waste Water Treatment and Reutilization 2011 Part 17 pot
Bạn đang xem bản rút gọn của tài liệu. Xem và tải ngay bản đầy đủ của tài liệu tại đây (381.37 KB, 14 trang )
Wastewater Minimization in a Chlor-Alkali Complex
421
contaminants can be excluded. Analyzing the quality control items, the water using
operations are sensitive to the PH value and the concentration of Ca
2+
and Mg
2+
(total
hardness). For example, the water used in hydrochloride absorption cannot be alkaline, and
the salt dissolving unit require low concentration of Ca2
+
and Mg
2+
. On the other hand, the
wastewater discharge of the operations mainly contains H
+
, Ca
2+
and Mg
2+
. Consequently,
total hardness is chosen as the chief contaminant that constraints water reuse. PH value is
the assistant constraint. The limiting data is shown in table 11.
Step 4. network design
We analyze and optimize the existing system in two aspects: intra-plant integration and
inter-plant integration. The design methodology is adopted from Liao et al.
[60]
, and the
detailed procedure is omitted here. Figures 12 to 14 represent the obtained intra- and inter-
plant network structures. Note that no reuse happens in plant 3, because plant 3 only
consumes pure water which cannot be replaced by freshwater.
Resin regeneration
Pump sealing
To plant 4
12.5
7.5
Fig. 14. Cross plant water reuse scheme
4. Conclusion
Due to the water shortage and environmental concerns, it is very important to improve the
water using efficiency in traditional chemical industries. We take an chlor-alkali complex as
example to show the applicability and effectiveness of the pinch based water integration
technology. Based on the balanced system water consumption data, evaluation of the
existing system has been established. The analysis and optimization of the whole system are
carried out in cooling water system and process water system respectively.
For the cooling water system, the current cooling tower bottleneck has been relaxed by
sequential arrangement of the coolers. For the process water allocation system, a number of
13 measures has been proposed (as shown in table 12) to save 88 t/h freshwater.
If the following freshwater and wastewater related cost are adopted:
Freshwater cost: 0.4 RMB/t
Pure water cost: 10.00 RMB/t
Circulating cooling water cost: 0.5 RMB/t
Water pumping cost: 0.06 RMB/t
Wastewater discharge cost: 1.20 RMB/t
Then the profit obtained from water saving can be calculated as follows:
1. Circulating cooling water system. The heat load of the cooling tower for chlorine liquid
section has been enlarged by sequential arrangement of the cooling system. This
enlargement breaks down the cooling water bottleneck of the system. Therefore, 208 t/h
of the original direct discharge cooling water is now recycled.
Waste Water - Treatment and Reutilization
422
Water saving profit:
kRMB/Y)208 (1.2 0.06 0.4 0.5) 8000 1930(
×
++−× =
2. Process water allocation system. The proposed 12 projects save freshwater in the
amount of 88t/h. Water saving profit:
kRMB/Y)88 (1.2 0.06 0.4) 8000 1169(
×
++× =
In conclusion, the total saving is 3,099 kRMB per year.
Process (section)
Water
flow
rate(t/h)
measures
Water saving
amount(t/h)
pump cooling(salt dissolving) 10
sent to refining agent
preparing
10
pump cooling(evaporation) 10 sent to brine sludge washing 10
Steam condensate
(evaporation)
14 sent to salt dissolving 14
absorber(white carbon black) 10
sent to hydrochloride
absorber
10
Acid gas absorber(white
carbon black)
6
sent to hydrochloride
absorber
4
Gas cooling (white carbon
black)
5
sent to sodium hypochlorite
section
2
sent to bottle washing 1.5
sent to hot water tank 3.5
sent to the absorber in
perchloravinyl section
2
pump cooling (chlorine
liquid)
42.4
sent to the alkali solution
preparation in
perchloravinyl section
5
Resin
regeneration(electrostenolysis)
15
sent to the bleaching
powder section
12.5
Pump
sealing(electrostenolysis)
7.5
sent to the bleaching
powder section
7.5
Steam condensate (Solid
caustic soda)
6
Sent to the hot water tank in
the perchloravinyl section
6
total 88
Table 12. List of the retrofit projects
Wastewater Minimization in a Chlor-Alkali Complex
423
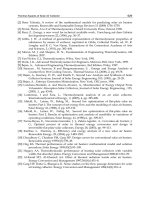
5. References
[1] Bagajewicz, M. A review of recent design procedures for water networks in refineries
and process plants Computers & Chemical Engineering 2000 24(9-10) 2093-2113
[2] Wang, Y.; Smith, R. Wastewater Minimization Chemical Engineering Science 1994 49(7)
981-1006
[3] El-Halwagi, M. M.; Manousiouthakis, V. Synthesis of mass exchange networks AIChE
Journal 1989 35(8) 1233-1243
[4] Wang, Y.; Smith, R. Wastewater minimisation with flow rate constraints Chemical
Engineering Research & Design 1995 73 889-904
[5] Dhole, V.; Ramchandani, N.; Tainsh, R.; Wasilewski, M. Make Your Process Water Pay
for Itself Chemical Engineering 1996 (103) 100-103
[6] Hallale, N. A new graphical targeting method for water minimisation Advances in
Environmental Research 2002 6(3) 377-390
[7] Manan, Z.; Tan, Y.; Foo, D. Targeting the minimum water flow rate using water cascade
analysis technique AIChE Journal 2004 50(12) 3169-3183
[8] El-Halwagi, M.; Gabriel, F.; Harell, D. Rigorous graphical targeting for resource
conservation via material recycle/reuse networks Industrial & Engineering Chemistry
Research 2003 42(19) 4319-4328
[9] Prakash, R.; Shenoy, U. Targeting and design of water networks for fixed flowrate and
fixed contaminant load operations Chemical Engineering Science 2005 60(1) 255-268
[10] Agrawal, V.; Shenoy, U. V. Unified conceptual approach to targeting and design of
water and hydrogen networks AIChE Journal 2006 52(3) 1071-1082
[11] Bandyopadhyay, S. Source composite curve for waste reduction Chemical Engineering
Journal 2006 125(2) 99-110
[12] Bandyopadhyay, S.; Ghanekar, M. D.; Pillai, H. K. Process water management Industrial
& Engineering Chemistry Research 2006 45(15) 5287-5297
[13] Pillai, H. K.; Bandyopadhyay, S. A rigorous targeting algorithm for resource allocation
networks Chemical Engineering Science 2007 62(22) 6212-6221
[14] Alwi, S. R. W.; Manan, Z. A. Targeting multiple water utilities using composite curves
Industrial & Engineering Chemistry Research 2007 46(18) 5968-5976
[15] Foo, D. C. Y. Water Cascade Analysis for Single and Multiple Impure Fresh Water Feed
Chemical Engineering Research & Design 2007 85(8) 1169-1177
[16] Shenoy, U. V.; Bandyopadhyay, S. Targeting for multiple resources Industrial &
Engineering Chemistry Research 2007 46(11) 3698-3708
[17] Alwi, S. R. W.; Manan, Z. A. SHARPS: A new cost-screening technique to attain gost-
effective minimum water network AIChE Journal 2006 52(11) 3981-3988
[18] Foo, D. C. Y. Flowrate targeting for threshold problems and plant-wide integration for
water network synthesis Journal of Environmental Management 2008 88(2) 253-274
[19] Mann, J.; Liu, Y., Industrial water reuse and wastewater minimization. McGraw Hill: New
York, 1999.
[20] Feng, X.; Bai, J.; Zheng, X. S. On the use of graphical method to determine the targets of
single-contaminant regeneration recycling water systems Chemical Engineering
Science 2007 62(8) 2127-2138
[21] Bai, J.; Feng, X.; Deng, C. Graphically based optimization of single-contaminant
regeneration reuse water systems Chemical Engineering Research & Design 2007
85(A8) 1178-1187
Waste Water - Treatment and Reutilization
424
[22] Deng, C.; Feng, X.; Bai, J. Graphically based analysis of water system with zero liquid
discharge Chemical Engineering Research & Design 2008 86(A2) 165-171
[23] Bandyopadhyay, S.; Cormos, C. C. Water management in process industries
incorporating regeneration and recycle through a single treatment unit Industrial &
Engineering Chemistry Research 2008 47(4) 1111-1119
[24] Ng, D. K. S.; Foo, D. C. Y.; Tan, R. R.; Tan, Y. L. Ultimate flowrate targeting with
regeneration placement Chemical Engineering Research & Design 2007 85(A9) 1253-
1267
[25] Ng, D. K. S.; Foo, D. C. Y.; Tan, R. R.; Tan, Y. L. Extension of targeting procedure for
"Ultimate Flowrate Targeting with Regeneration Placement" by Ng et al., Chem.
Eng. Res. Des., 85 (A9): 1253-1267 Chemical Engineering Research & Design 2008
86(10) 1182-1186
[26] Kuo, W.; Smith, R. Effluent treatment system design Chemical Engineering Science 1997
52(23) 4273-4290
[27] Kuo, W.; Smith, R. Designing for the interactions between water-use and effluent
treatment Chemical Engineering Research & Design1998 76(A3) 287-301
[28] Ng, D. K. S.; Foo, D. C. Y.; Tan, R. R. Targeting for total water network. 1. Waste stream
identification Industrial & Engineering Chemistry Research 2007 46(26) 9107-9113
[29] Ng, D. K. S.; Foo, D. C. Y.; Tan, R. R. Targeting for total water network. 2. Waste
treatment targeting and interactions with water system elements Industrial &
Engineering Chemistry Research 2007 46(26) 9114-9125
[30] Olesen, S. G.; Polley, G. T. Dealing with plant geography and piping constraints in
water network design Process Safety and Environmental Protection 1996 74(B4) 273-
276
[31] Olesen, S. G.; Polley, G. T. A simple methodology for the design of water networks
handling single contaminants Chemical Engineering Research & Design 1997 75(A4)
420-426
[32] Castro, P.; Matos, H.; Fernandes, M.; Nunes, C. Improvements for mass-exchange
networks design Chemical Engineering Science 1999 54(11) 1649-1665
[33] Ma, H.; Feng, X.; Cao, K. A rule-based design methodology for water networks with
internal water mains Chemical Engineering Research & Design 2007 85(A4) 431-444
[34] Gomes, J. F. S.; Queiroz, E. M.; Pessoa, F. L. P. Design procedure for water/wastewater
minimization: single contaminant Journal of Cleaner Production 2007 15(5) 474-485
[35] Savelski, M.; Bagajewicz, M. On the optimality conditions of water utilization systems
in process plants with single contaminants Chemical Engineering Science 2000 55(21)
5035-5048
[36] El-Halwagi, M. M., Pollution Prevention Through Process Integration:Systematic Design
Tools. Academic Press: San Diego, 1997.
[37] Prakash, R.; Shenoy, U. V. Design and evolution of water networks by source shifts
Chemical Engineering Science 2005 60(7) 2089-2093
[38] Ng, D. K. S.; Foo, D. C. Y. Evolution of water network using improved source shift
algorithm and water path analysis Industrial & Engineering Chemistry Research 2006
45(24) 8095-8104
[39] Alwi, S. R. W.; Manan, Z. A. Generic graphical technique for simultaneous targeting
and design of water networks Industrial & Engineering Chemistry Research 2008 47(8)
2762-2777
Wastewater Minimization in a Chlor-Alkali Complex
425
[40] Alwi, S. R. W.; Manan, Z. A.; Samingin, M. H.; Misran, N. A holistic framework for
design of cost-effective minimum water utilization network Journal of Environmental
Management 2008 88(2) 219-252
[41] Tan, Y. L.; Manan, Z. A. Retrofit of water network with optimization of existing
regeneration units Industrial & Engineering Chemistry Research 2006 45(22) 7592-7602
[42] Tan, Y. L.; Manan, Z. A. A new systematic technique for retrofit of water network
International Journal of Environment and Pollution 2008 32(4) 519-526
[43] Tan, Y. L.; Manan, Z. A.; Foo, D. C. Y. Retrofit of water network with regeneration using
water pinch analysis Process Safety and Environmental Protection 2007 85(B4) 305-317
[45] Alva-Argaez, A.; Kokossis, A. C.; Smith, R. The design of water-using systems in
petroleum refining using a water-pinch decomposition Chemical Engineering Journal
2007 128(1) 33-46
[46] Koppol, A. R.; Bagajewicz, M. J.; Dericks, B. J.; Savelski, M. J. On zero water discharge
solutions in the process industry Advances in Environmental Research 2004 8(2) 151-
171
[47] Zbontar, L.; Glavic, P. Total site: wastewater minimization - Wastewater reuse and
regeneration reuse Resources Conservation and Recycling 2000 30(4) 261-275
[48] Takama, N.; Kuriyama, T.; Shiroko, K.; Umeda, T. Optimal water allocation in a
petroleum refinery Computers & Chemical Engineering 1980 4 251-258
[49] Yang, Y. H.; Lou, H. H.; Huang, Y. L. Synthesis of an optimal wastewater reuse network
Waste Management 2000 20(4) 311-319
[50] Jacob, J.; Kaipe, H.; Couderc, F.; Paris, J. Water network analysis in pulp and paper
processes by pinch and linear programming techniques Chemical Engineering
Communications 2002 189(2) 184-206
[51] Dilek, F. B.; Yetis, U.; Gokcay, C. F. Water savings and sludge minimization in a beet-
sugar factory through re-design of the wastewater treatment facility Journal of
Cleaner Production 2003 11(3) 327-331
[52] Majozi, T.; Brouckaert, C. J.; Buckley, C. A. A graphical technique for wastewater
minimisation in batch processes Journal of Environmental Management 2006 78(4)
317-329
[53] Ujang, Z.; Wong, C. L.; Manan, Z. A. Industrial wastewater minimization using water
pinch analysis: a case study on an old textile plant Water Science and Technology 2002
46(11-12) 77-84
[54] Zhou, Q.; Lou, H. H.; Huang, Y. L. Design of a switchable water allocation network
based on process dynamics Industrial & Engineering Chemistry Research 2001 40(22)
4866-4873
[55] Forstmeier, M.; Goers, B.; Wozny, G. Water network optimisation in the process
industry - case study of a liquid detergent plant Journal of Cleaner Production 2005
13(5) 495-498
[56] Noureldin, M. B.; El-Halwagi, M. M. Interval-based targeting for pollution prevention
via mass integration Computers & Chemical Engineering 1999 23(10) 1527-1543
[57] Feng, X.; Wang, N.; Chen, E. Water system integration in a catalyst plant Chemical
Engineering Research & Design 2006 84(A8) 645-651
[58] Tian, J. R.; Zhou, P. J.; Lv, B. A process integration approach to industrial water
conservation: A case study for a Chinese steel plant Journal of Environmental
Management 2008 86(4) 682-687
Waste Water - Treatment and Reutilization
426
[59] Jin-Kuk Kim, Robin Smith. Cooling water system design. Chemical Engineering Science,
2001,56: 3641–3658
[60] Z. W. Liao, J. T. Wu, B. B. Jiang, J. D. Wang, and Y. R. Yang, Design Methodology for
Flexible Multiple Plant Water Networks, Ind. Eng. Chem. Res. 2007, 46, 4954-4963
22
Using Seawater to Remove SO
2
in a FGD System
Jia-Twu Lee and Ming-Chu Chen
Department of Environmental Engineering and Science
National Pingtung University of Science and Technology
Taiwan
1.Introduction
1.1 Introduction
Sea water contains significant amounts of HCO
3
-
and other alkaline compounds that help
sulfur dioxide in flue gas dissolve in water. Flue gas desulphurization (FGD) achieves the
goals of this system, for sea-water FGD systems. This study conducts a series of simulations
or experiments using sea-water at a flue gas combustion plant to identify the advantages
and disadvantages of, and related parameters for designing and operating FGD in the
future.
1.2 Research objectives
1. Flue gas from a combustion plant is used in a series of experiments. The pre-water
method has both advantages and disadvantages associated with relevant parameters.
2. To estimate the amount of tail water and solve the problem of disposing of large amounts
of tail-water. To further tail water recycling research and development, one must
simultaneously achieve the dual objectives of FGD and the creation of water resources.
2. Literature review
2.1 Flue gas desulfurization processes
Flue Gas Desulphurization is divided into wet, dry, and semi-dry methods (2). The wet
method is the most efficient and most commonly used method. The wet method uses
absorbent desulfurization processes that differ from other processes, which typically use
lime, limestone, magnesium hydroxide, sodium carbonate, water, and double-base.
2.1.1 The seawater method uses sea-water that contains some Trona and SO
-
2
flue
gas
The alkalinity of seawater is primarily influenced by calcium, magnesium, carbonate, and
other related compounds. The pH of sea-water was 7.5 and 8.5. It can be neutralized with
SO
2
during a reaction.
During seawater desulfurization, water is the primary absorber. Adding a small amount of
NaOH or Mg (OH)
2
increases the effect, or alters the process than the final pH of sulfur
water. The activity of pure water is as follows.
Waste Water - Treatment and Reutilization
428
a. Absorption reaction
Flue gas of SO
2
and water vapor from liquid dissolves into sulfite and hydrogen ions,
resulting in fluid absorption at a pH of roughly 3.
(
)
(
)
22
SO
g
SO L
⇔
(1)
22 3
SO +H O HSO +H
−
+
⇔
(2)
2
33
HSO SO H
−
−+
⇔+
(3)
b. Neutralization reaction
Bicarbonate ions in seawater and hydrogen ions in the carbon dioxide and water reaction,
increase the pH of.
322
HCO +H CO +H O
−
+
⇔
c. Oxidation
22
324
SO +1/2 O SO
−
−
⇔
Although the oxidation reaction at low pH values (roughly ≦ 4.5) of the low efficiency of
water requirement, yet the pH can increase to roughly 5.6. Additionally, aeration functions
can eliminate CO
2
from the water, thereby increasing pH during the neutralization reaction.
d. Total reaction
2
22 2 4
SO +H O+1/2O SO +2H
−
+
→
3
22
HCO +H CO +H O
−
+
→
The seawater treatment process resembles the conventional wet process in that water and
smoke are in contact in the reverse direction. The kinds of the process are filled with
different types, such as the spray-type and layer different types of absorber plate. As water
absorbs SO
2
after the acidic (
pH 3N
), adding large amounts of water before increasing the
pH facilitates the following aeration reaction: SO
3
2-
is oxidized to SO
4
2-
, and discharge the
dissolution of CO
2.
3. Seawater desulphurization process assessment
3.1 Business transfer performance
In the 1970s, the University of California at Berkeley first used seawater to remove SO
2
from
flue gas . In 1978, Fujikasui, a Japanese researcher, used seawater to in an FGD system at a
chemical plant . In 1988, ABB, a company, used seawater in an FGD system at an oil refinery
in Norway(4).
3.2 System evaluation
Packing and orifice-plate systems in a field simulation test verified that pure seawater can
remove up to 90% of SO
2
flue gas from combustion-fired units. The two sulfur tower
designs have different advantages and disadvantages. For example, a packing system
requires an absorber tower with a large volume.
Using Seawater to Remove SO
2
in a FGD System
429
Although the packing system clogs easily happen, the amount of seawater needed is
reduced, resulting in energy savings; conversely, the orifice uses an absorber tower with a
smaller volume and does not clog easily, however, this requires more seawater (4).
4. Experimental method: The seawater FGD process
4.1 The selection of a seawater FGD system simulation
According to the assessment of in Section 3.2, the processes that use different water
desulfurization have both advantages and disadvantages. In this study, the selection of a
seawater FGD orifice plate depends on the following factors.
Although the FGD system electrostatic precipitators (ESP), a small amount of fly ash flows
into the desulfurization tower, such that the desulfurization tower can clog after long-term
operation.
4.2 The orifice-plate type seawater FGD simulation system
The primary component of the system is a desulfurization tower tank, which is divided into
a demisting zone, an SO
2
absorption zone (spray zone), and water oxidation zone. Water
from a pump in the water tank tower into the desulfurization tower at the top of the
absorption zone, and flue gas driven by a fan enters the bottom of the desulphurization
tower tank. Gas from the bottom up, seawater from the top down, Seawater and gas in the
orifice of the perforated plate then contact and SO
2
is absorbed by the seawater, such that
the treated flue gas is emitted from the top side of the demister zone.
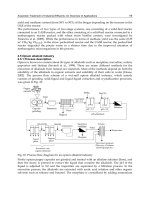
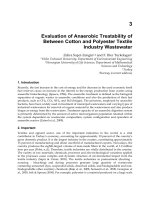
4.3 Desulfurization tests results
The concentration of flue gas SO
2
is controlled at 50-250ppm, The tested seawater is seawater
from the first condenser. Figure 1 shows the simulation device. Figure 2 shows the absorption
area in the orifice-plate. During the test, the flue gas flow rate is 1-3 m
3
/ min: the water flow
rate is 10-40 ft
3
/ min; and the gas-to-liquid G/L ratio is controlled at 5 and 20.
Fig. 1. The orifice-plate style seawater flue gas desulphurization simulation system
Waste Water - Treatment and Reutilization
430
Fig. 2. The situation of gas-liquid mixture in the simulation test of desulfurization tower
4.3.1 Batch seawater desulphurization results
To reduce the amount of seawater used (and reduce pumping energy and the amount of
waste-water), some seawater can be reused. The design cycle typically depends on the
change in seawater pH and desulphurization efficiency. Via the seawater desulfurization
circulation test (a batch test was adopted, and no seawater was discharged), one can identify
the relationship between changes in seawater pH and desulphurization efficiency. Figure 4
and 5 list experimental results from two desulfurization tests (G/L ratio = 10-20).
Experimental results show that desulfurization efficiency and the pH of exiting seawater
decreased as reaction time increased. Experimental results also show that the amount of
alkaline compounds in seawater decreased as reaction time increased. The alkalinity of the
exiting sea-water convert to Fig. 3. Desulfurization efficiency and water pH are positively
correlated. This experimental result indicates that a high residual water pH and large
amounts of alkaline compounds lead to higher desulfurization efficiency. The exiting
seawater can keep desulfurization efficiency at ≥ 90% under a seawater pH ≥ 6.0(Fig. 3).
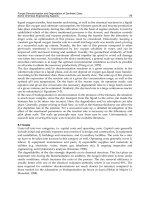
4.3.2 Test results of continuous seawater desulphurization
When the system is operated continuously, the reflux ratio (reflux ratio R = (water flow
recovery / raw water flow) can explain returning water usage. Figure 6 and 7 show the
control loop volume from test results. Experimental results show that as the reflux ratio
increased, the pH of exiting seawater decreased, and the amount of alkaline compounds in
seawater decreased during the reaction. Adding a relatively smaller amount of fresh
seawater reduced desulfurization efficiency; thus, the reflux ratio should not be > during
operation. When the reflux ratio was controlled at
≦ l (inclusive) (Figure 6 and 7), the pH of
Using Seawater to Remove SO
2
in a FGD System
431
Fig. 3. The pH and alkalinity of exit seawater and desulphurization efficiency diagram
Fig. 4. The seawater circulation desulphurization test results
exiting seawater was kept at > 6.0, resulting in a desulphurization efficiency of ≥ 90%.
However, the reflux ratio should be < to reduce seawater usage (which can reduce pump
energy and the amount of wastewater used). In summary, the orifice-plate seawater FGD
system is an effective system.
Waste Water - Treatment and Reutilization
432
Fig. 5. The seawater circulation desulphurization test results
Fig. 6. The results of controlling seawater reflux ratio desulfurization test
Using Seawater to Remove SO
2
in a FGD System
433
Fig. 7. The results of controlling seawater reflux ratio desulfurization test
4.3.3 Tubular seawater desulphurization results
In the tubular (one-through) seawater desulphurization process, original seawater passes
directly through the desulfurization tower instead of being recycled. As the tubular process
is used for fresh seawater desulphurization, all alkaline compounds in seawater are in the
highest state; thus, a good desulfurization result is expected. Table 1 shows simulation test
results. Experimental results confirm that the tubular (one-through) seawater
desulphurization process yields excellent desulphurization results. With a G/L ratio > 13,
the desulphurization rate exceeded 99%. General designs of often recycle seawater, have
G/L ratios of 20 and desulphurization efficiency > 90%.
The entrance
flue gas SO2
PPM
concentration
L / G ratio
The exit flue gas
SO2 PPM
concentration
Desulphurization
efficiency
%
The pH of exit
seawater
150 10 5 96.6 6.5
150 13 1 99 6.4
150 17
< 1 > 99
6.5
150 20
< 1 > 99
6.4
Table 1. The seawater desulphurization tubular (one-through) test results listed as follows
4.3.4 Evaluation and selection of a seawater desulphurization system
The best seawater desulphurization process is orifice-plate type. According to test results,
desulfurization rate of the orifice-plate-type easily reached as high as 99%. However, the
Waste Water - Treatment and Reutilization
434
tubular (one-through) system has a higher desulfurization efficiency, is easier to design, and
has a lower installation cost than other designs. The G/L ratio depends on desulphurization
efficiency. When the G/L ratio was 10, was 95%; conversely, when the G/L ratio was 15,
desulphurization efficiency exceeded 99%.
5. Conclusions
1. The orifice-plate type simulated seawater desulphurization equipment, toward a coal-
fired (EP) unit exit flue gas, proceeding the field simulation tests for seawater
desulphurization. The G/L ratio, desulfurization seawater reflux ratio, number of
porous plate boards, area of the perforated plate, the porous plate before and after
changes in gas pressure, and the influence of changes in the height of the gas-liquid
mixing layer are discussed. After appropriate adjustments, the design achieved a
desulphurization efficiency of 99%. This experimental result can be used as the basis for
designing and seawater desulphurization systems in power plants.
2.
According to test results, the orifice-plate desulphurization system clogs less, has a
better desulfurization efficiency, and requires a smaller desulfurization tower than the
filling. Based on its economic advantages and limited plant area, the orifice-type is the
best seawater desulphurization process for combustion power plants.
6. Acknowledgements
The authors would like to thank the Taiwan Power Company for financially supporting this
study and offering value data. Ted knoy is appreciated for the editorial assistance.
7. References
[1] Intellectual Resources, "FGD Water Recycling Feasibility Study", Taiwan Power
Company report, Republic of China on December 92.
[2] Hermine N Sound, Mitsuru Takeshita “FGD Handbook”,IEA Coal Research,1994 .2.
Hermine N Sound, Mitsuru Takeshita "FGD Handbook", IEA Coal Research, 1994
[3] Xu gold, "Power Plant Flue Gas Desulfurization Project Description", Engineering, 2000.
[4] Katsuo Olikawa, Chaturong yongsiri, Kazuo Takeda Tayoshi Harimoto, “Seawater Flue
Gas Desulfurization: It's Technical Implications and Performance Results”,
Environmental Progress, Vol. 22, No. 1, April 2003.