Báo cáo hóa học: " Research Article Subcarrier Group Assignment for MC-CDMA Wireless Networks" doc
Bạn đang xem bản rút gọn của tài liệu. Xem và tải ngay bản đầy đủ của tài liệu tại đây (1017.59 KB, 12 trang )
Hindawi Publishing Corporation
EURASIP Journal on Wireless Communications and Networking
Volume 2007, Article ID 37091, 12 pages
doi:10.1155/2007/37091
Research Article
Subcarrier Group Assignment for MC-CDMA Wireless Networks
Tallal El Shabrawy
1
and Tho Le-Ngoc
2
1
Faculty of Information Engineering and Technology, German University in Cairo (GUC), Main Entrance,
Al Tagamoa Al Khames, New Cairo, Egypt
2
Department of ECE, McGill University, 3480 University, Montr
´
eal, Qu
´
ebec, Canada H3A 2A7
Received 19 January 2007; Revised 16 August 2007; Accepted 20 November 2007
Recommended by Wolfgang Gerstacker
Two interference-based subcarrier group assignment strategies in dynamic resource allocation are proposed for MC-CDMA wire-
less systems to achieve high throughput in a multicell environment. Least interfered group assignment (LIGA) selects for each
session the subcarrier group on which the user receives the minimum interference, while best channel ratio group assignment
(BCRGA) chooses the subcarrier group with the largest channel response-to-interference ratio. Both analytical framework and
simulation model are developed for evaluation of throughput distribution of the proposed schemes. An iterative approach is de-
vised to handle the complex interdependency between multicell interference profiles in the throughput analysis. Illustrative results
show significant throughput improvement offered by the interference-based assignment schemes for MC-CDMA multicell wireless
systems. In particular, under low loading conditions, LIGA renders the best performance. However, as the load increases BCRGA
tends to offer superior performance.
Copyright © 2007 T. El Shabrawy and T. Le-Ngoc. This is an open access article distributed under the Creative Commons
Attribution License, which permits unrestricted use, distribution, and reproduction in any medium, provided the original work is
properly cited.
1. INTRODUCTION
Multicarrier CDMA (MC-CDMA) [1] has drawn signifi-
cant interest as a major candidate for next generations of
high data rate mobile networks. MC-CDMA is a multicar-
rier transmission technique that might be viewed as a com-
bined OFDM/CDMA communication system [2]. Accord-
ingly, MC-CDMA benefits from advantages of both tech-
nologies. OFDM modulation [3]offersrobustnessagainst
multipath fading characterizing frequency selective channels
by subdividing the wideband system bandwidth into numer-
ous narrowband subcarriers that approximately exhibit flat
fading. On the other hand, CDMA [3] has the advantage of
efficient multiplexing. Multiple transmissions from different
users within the same cell are possible by allocating different
spreading codes.
MC-CDMA systems considered in this study spread the
information symbols in the frequency domain. Each chip is
transmitted over one of the subcarriers after being multi-
plied by the information symbol. Initial proposals for MC-
CDMA systems have adopted spreading over all system sub-
carriers. However, grouped MC-CDMA systems (e.g., [4])
have the potential of enhancing prospective system capac-
ity. Grouped MC-CDMA subdivides system subcarriers into
a set of nonoverlapping subcarrier groups. This opens an
avenue for isolating the received target signal from sources
of intolerably high interference, and potentially resulting in
capacity improvements. It is worth mentioning that in this
paper MC-CDMA and grouped MC-CDMA are used inter-
changeably to indicate the same multicarrier modulation sys-
tem.
Wireless channels in mobile networks are known to dis-
play significant variations across active users’ subcarriers as
well as among subcarriers of the same user. In order to fully
accomplish MC-CDMA aspirations for high throughput, ra-
dio resource management (RRM) must play a key role in ad-
equately adapting to channel dynamics to guarantee efficient
resources utility. RRM in MC-CDMA is governed by two
main functions: subcarriers group assignment and power al-
location. Group assignment depicts selection of appropriate
subcarriers to support information bit streams of individual
users. Power allocation is the scheme by which users share
the power available at the serving base station.
Research on RRM in MC-CDMA systems has been gen-
erally limited to a single-cell environment [2, 5–7]. The RRM
schemes described in such references share a common sub-
carrier group assignment theme. It is primarily based on
allocating transmissions over subcarriers with best channel
2 EURASIP Journal on Wireless Communications and Networking
response from the perspective of corresponding users. How-
ever, in a multicell environment, the use of only channel
response information in subcarrier group assignment over-
looks the severe impact of intercell interference on the qual-
ity and reliability of communications. In other words, signal-
to-interference/noise ratio (SINR) of a given user assigned
on a subcarrier group with adequate channel response might
be restricted by the amount of interference received due to
the power transmitted and large-scale path-loss of intercell
base stations towards the user of interest. Such constraint is
not quite as evident in a single-cell scenario, due to orthog-
onality of codes as well as a result of interference and signal
transmissions sharing a common large-scale path-loss chan-
nel. Therefore, in this paper, interference-based assignment
for MC-CDMA multicell networks is proposed. While there
exists some limited work on MC-CDMA for multicell net-
works in the literature (e.g., [8, 9]), none has addressed the
importance of interference-based assignment.
In this paper, two interference-based subcarrier group as-
signment strategies are introduced for multicell MC-CDMA
systems. In least interfered group assignment (LIGA), users
are assigned to groups experiencing minimum interference.
In best channel ratio group assignment (BCRGA), the user
is assigned to the subcarrier group that holds the best ra-
tio of channel response-to-received interference. Through-
put analysis of interference-based assignment in multicell
networks constitutes a challenging problem. In general, an-
alytical approaches available in the literature assume inde-
pendence of power allocation profiles across base stations of
the network (e.g., [10, 11]). The notion of power allocation
profile independence reflects the assumption that the num-
ber of users per subcarrier group as well as their power al-
location does not depend on the corresponding functionali-
ties at other base stations of the network. Unfortunately, in-
dependence of RRM across base stations may no longer be
considered the case when interference-based assignment is
employed. The distribution of users across subcarrier groups
as well as their transmission powers within a given cell has
a significant effect on how users and power are accordingly
distributed elsewhere in the network. Therefore, in this pa-
per, an iterative framework is devised for throughput anal-
ysis in MC-CDMA multicell networks. In [12], an iterative
framework has been also developed to investigate SIR-based
power control in a CDMA network. The approach intro-
duced in this paper is different from [12] in that it iterates on
the basis of distribution functions rather than statistical pa-
rameters, such as the mean or variance. A simulation model
is also developed for throughput evaluation, which is more
effective for large networks and sophisticated power alloca-
tion schemes. Throughput distribution curves obtained from
both analytical and simulation models for a simple three-
cell network scenario are shown to be in an excellent agree-
ment. This indicates that the results collected from the de-
veloped simulation platform should be considered reliable.
Since the main interest of this paper is throughput distribu-
tion functions, the introduced iterative platform relies only
on Monte Carlo simulations using random variables char-
actering the wireless channel (i.e., large-scale path-loss and
small-scale fading). Accordingly, it is considered to be su-
perior in terms of simulation time compared to extensive
simulations that have to deal with details such as calls ar-
rival/departure, mobile speeds, correlated channel behavior,
and so forth. Performance results confirm that the proposed
interference-based assignment schemes significantly outper-
form best subcarrier assignment techniques. With no con-
straints on the number of users per subcarrier group, LIGA
supports the best throughput performance. However, since
the number of users per assignment group is limited by the
spreading factor of the orthogonal codes, the least interfered
group might not always be feasible for assignment. Results
show that with limited number of codes, LIGA maintains su-
periority for low-load scenarios. BCRGA offers the most su-
perior performance at high loads.
The rest of the paper is organized as follows: In
Section 2, the system model is presented, while in Section 3,
interference-based assignment schemes are proposed for
MC-CDMA multicell networks. Section 4 presents both an-
alytical framework and simulation models for throughput
evaluation. Results and discussions are featured in Section 5.
Finally, conclusions are presented in Section 6.
2. SYSTEM MODEL
Consider an MC-CDMA cellular network where the system
bandwidth, W, is subdivided into N
C
subcarriers. Band-
widthofsubcarriersisselectedsuchthattheyeachap-
proximately exhibit flat fading channel characteristics (i.e.,
W/N
C
≤ B
C
,whereB
C
is the coherence bandwidth). As-
sume for grouped MC-CDMA that each G subcarriers con-
stitute a group over which individual streams will be spread.
As a result of subcarrier grouping, system bandwidth could
be described in terms of a set of subcarrier groups, C
=
{
C
(1)
, C
(2)
, ,C
(j)
, ,C
(N
G
)
},whereN
G
= N
C
/G is the
number of subcarrier groups. Subcarriers belonging to the
same group are selected such that they are G subcarriers apart
to guarantee independence between corresponding fading
channels. For notational convenience throughout the paper,
C
(j)
is used to signify the jth subcarrier group.
A multicell network constituted of B
={1, 2, ,N
B
}
base stations is considered. Subcarrier grouping defined by
the set C is presumed to be the same across all base sta-
tions. Each base station, b
∈ B,iseffectively simultaneously
supporting K active data users. Each base station b operates
under the constraint that it has at its disposal a maximum
amount of power P
MAX
to share among active sessions.
Radio resource management at each base station must
conduct two primal functions for all served users—group as-
signment and power allocation. It is assumed for the analy-
sis presented in this paper that each user may be assigned to
only one group. LIGA and BCRGA proposed in this study
are group assignment strategies and will be discussed in
Section 3. Fair power allocation (FPA) and water-filling [13]
(WFPA) are considered as the most popular power allo-
cation schemes. FPA evenly distributes power across users
to guarantee minimal outage probability, while WFPA al-
locates power with the objective of maximizing total cell-
throughput [14].Powerdedicatedforeachuserassignedtoa
certain group is assumed to be uniformly distributed over
T. El Shabrawy and T. Le-Ngoc 3
subcarriers of such group. In other words, for a user k of
interest allocated with P
(b, j)
k
by base station b over C
(j)
, the
power share per subcarrier of C
(j)
will be evenly distributed
as P
(b, j)
k
/G.Thisisconsideredasalegitimateassumption
since MC-CDMA can benefit from diversity of fading chan-
nels of subcarriers belonging to the same group. Moreover,
varying power across subcarriers disrupts orthogonality of
users’ signals even before being transmitted over the wireless
channel (especially if channel responses are unknown).
1
Next consider the mobile user k of interest served by
base station b that offers the best path-loss for such user. If
it is assumed that the user has been assigned to C
(j)
, then
the total signal power measured in the downlink direction
at the receiver input of user k excluding thermal noise is
ρ
(b, j)
k
= A
G
c=1
[(P
(b, j)
k
/G)H
(b, j)
kb
S
(b, j,c)
kb
]+I
(b, j)
k
,whereA is the
average antenna gain for the transmitted signal relative to
all interferers; H
(z, j)
xy
signifies the large-scale path-loss be-
tween the mobile user x and base station y given that user
x is being served by base station z and assigned to C
(j)
;
S
(z, j,c)
xy
depicts the small-scale fading power for the cth sub-
carrier belonging to C
(j)
defined between the mobile user
x and base station y given that user x is being served by
base station z; I
(b, j)
k
is the total interference measured by user
k served by base station b over C
(j)
, expressed as I
(b, j)
k
=
E
(b, j)
k
+
N
B
b
/= b, b
=1
G
c=1
[(P
(b
,j)
/G)H
(b, j)
kb
S
(b, j,c)
kb
], where E
(b, j)
k
depicts the intracell interference from users assigned within
base station b to the same group as user k; P
(y,j)
is the total
power transmitted by base station y over C
(j)
. In a multicell
environment, it is commonly assumed for intracell interfer-
ence to be negligible when compared to intercell interference
[14]. Furthermore, for a large number of interferers, small-
scale fading variations over interfering paths are presumed to
inflict minimal effects on SINR performance. Under such cir-
cumstances, the average large-scale interference is employed
to represent the interference component in the SINR equa-
tion [15]. Therefore, the equation for interference affecting
user k of interest reduces to
I
(b, j)
k
≈
N
B
b
=1
b
/= b
P
(b
,j)
H
(b, j)
kb
. (1)
Consequently, given that G (number of subcarriers per
group) depicts the equivalent expected processing gain of
MC-CDMA signals, then the SINR Γ
(b, j)
k
experienced by a
given user k served by base station b over C
(j)
could be ex-
pressed as
Γ
(b, j)
k
=
GA
I
(b, j)
k
G
c=1
P
(b, j)
k
G
H
(b, j)
kb
S
(b, j,c)
kb
=
P
(b, j)
k
Ω
(b, j)
k
,(2)
1
In CDMA, two codes (with the same chip levels, e.g., either +1 or −1) are
orthogonal if their cross-correlation is zero. When the chip levels of two
orthogonal CDMA codes are independently scaled by different power co-
efficients, their cross-correlation computation can result a nonzero value,
that is, they are no longer orthogonal.
where Ω
(b, j)
k
= GAH
(b, j)
kb
σ
(b, j)
kb
/I
(b, j)
k
is the normalized signal-
to-interference ratio (SIR) corresponding to a unit of power
allocated to user k and σ
(b, j)
kb
= (1/G)
G
c=1
S
(b, j,c)
kb
is the corre-
sponding effective small-scale fading power between the mo-
bile user k and base station b given that user k is being served
by base station b over C
(j)
.Evidently,σ
(b, j)
kb
assumes that max-
imal ratio combining (MRC) is used at the receiver. Thermal
noise is assumed to be negligible as compared to intercell in-
terference in a multicell network. Such an assumption is con-
venient for the benefit of simplifying the analytical model.
The impact of such approximation on throughput distribu-
tion results is discussed in Section 5 where thermal noise is
incorporated in the developed simulation platform.
The achieved throughput in bits/s/Hz for user k served
by base station b over C
(j)
, R
(b, j)
k
is
R
(b, j)
k
= log
2
1+αP
(b, j)
k
Ω
(b, j)
k
,(3)
where α (0
≤ α<1) represents the performance gap
2
of the
coding/modulation scheme in use, including both its theo-
retical performance and degradation due to practical imple-
mentation, with respect to the Shannon limit [14]. In prac-
tice, an adaptive coding/modulation strategy is used, where
a set of coding/modulation schemes is predetermined and
a particular scheme is dynamically selected from this set
based on the instantaneous SINR level. Accordingly, achiev-
able throughputs R
(b, j)
k
are potentially drawn from a finite
set MCR
={MCR
m
}, m ∈{1, 2, , N
MCR
}. Each index m
characterizes the achievable modulation/coding rate (MCR)
for the corresponding modulation configuration measured
in the number of information bits per symbol. However, for
convenience of analysis in this paper, a continuous through-
put distribution is assumed. Given that K
(b, j)
depicts the
number of users assigned on C
(j)
∈ C by base station b, the
total cell-throughput is R
(b)
=
N
G
j=1
K
(b, j)
k=1
R
(b, j)
k
.
3. GROUP ASSIGNMENT STRATEGIES
In this section, group assignment strategies considered
within this study are discussed. A brief review of simple
schemes consistent with approaches adopted in single-cell
analysis is presented, that is, random group assignment
(RGA) [17] and best subcarrier group assignment (BSGA)
[2, 5–7]. This will be followed by introducing the proposed
interference-based strategies, that is, LIGA and BCRGA.
3.1. Group assignment without
interference consideration
RGA
In RGA, active user k is assigned to subcarrier group C
(j)
in
a random manner, that is, j
= rand(1 : N
G
), where “rand”
2
In illustrative numerical results, we assume α ≈−1.5/ ln(5BER
(b)
k
)for
M-QAM (as suggested in [16]) and the threshold bit-error rate BER
(b)
k
=
10
−7
(for reliable communications) in both analysis and simulation.
4 EURASIP Journal on Wireless Communications and Networking
is a random generator of integers from one to the number of
groups (N
G
) of the system.
BSGA
In BSGA, user k is assigned to subcarrier group C
(j)
if it
offers the best small-scale fading channel response, that is,
C
(j)
= max
C
(l)
σ
(b,l)
kb
. Note that in RGA and BSGA, the selec-
tion of C
(j)
for user k is independent of assignments across
the network as well as within the same cell.
3.2. Interference-based group assignment
LIGA
In a multicell environment, intercell interference inflicts sig-
nificant contribution on attained throughput performance.
Subcarriers with the best small-scale fading channels no
longer have the potential to support the highest transmis-
sion rates since they might coincide with intolerable interfer-
ence power generated from other cells of the network. Conse-
quently, it is provisioned in this paper that LIGA has the po-
tential to outperform BSGA that has been popular for single-
cell scenarios. In LIGA, active user k is assigned to subcarrier
group C
(j)
such that C
(j)
= min
C
(l)
I
(b,l)
k
.
BCRGA
BCRGAisconsideredasacompositegroupassignment
scheme that is based on LIGA and BSGA. The notion “chan-
nel ratio” in BCRGA indicates that the metric used for group
selection is based on the ratio of small-scale fading channel-
to-interference ratio received on a particular group. Accord-
ingly, C
(j)
in BCRGA is selected such that it supports the
best channel ratio, that is, C
(j)
= max
C
(l)
(σ
(b,l)
kb
/I
(b,l)
k
) =
min
C
(l)
(I
(b,l)
k
/σ
(b,l)
kb
).
4. THROUGHPUT ANALYSIS
Throughput depicts a measure of achievable transmission
rates for information streams conveyed over the wireless
medium with high reliability. In the dynamic environment of
cellular networks, attained throughputs for mobile users and
correspondingly aggregate cell-throughput constitute ran-
dom variables that are heavily dependent on instantaneous
(large-scale and small-scale) channel states as well as in-
terference profiles from intercell base stations. As a result,
RRM performance might be best characterized in terms of
the throughput distribution. In the following subsections,
we proceed to present the analytical approach proposed for
throughput analysis in a multicell MC-CDMA network using
interference-based assignment. The difficulty of such type of
analysis is inherent in the interdependency of users’ distribu-
tion and interference profiles across cells of the network.
4.1. Analytical model
From (3), the probability density function f
R
(b, j)
k
(r) character-
izing attainable throughput for an arbitrary user k assigned
by base station b over group C
(j)
could be calculated from
the conditional distribution f
R
(b, j)
k
|P
(b, j)
k
(r) (using transforma-
tion of random variables) and averaging over the distribution
of P
(b, j)
k
, that is,
f
R
(b, j)
k
(r) =
∞
0
f
R
(b, j)
k
|P
(b, j)
k
(r)f
P
(b, j)
k
(p)dp,
f
R
(b, j)
k
|P
(b, j)
k
(r) =
f
Ω
(b, j)
k
(ω)
|∂r/∂ω|
ω=(2
r
−1)/αp
,
∂r
∂ω
=
1
ln2
1
αp
+ ω
−1
.
(4)
Consequently, the probability density function of the ag-
gregate cell-throughput, f
R
(b)
(r), could be evaluated by ap-
plying the convolution of K identically independently dis-
tributed random variables characterized each by f
R
(b, j)
k
(r). For
FPA, all K users served within a given cell b are allocated an
equal share of available power. Therefore, f
R
(b, j)
k
(r)resolvesto
f
R
(b, j)
k
(r) = f
R
(b, j)
k
|[P
MAX
/K]
= f
Ω
(b, j)
k
(ω)(ln2)
K
αP
MAX
+ ω
ω=K(2
r
−1)/αP
MAX
.
(5)
From (5), it is clear that deriving f
Ω
(b, j)
k
(ω) is the crit-
ical step in computing user- and cell-throughput perfor-
mances, f
R
(b, j)
k
(r)andf
R
(b)
(r), respectively. In the following, it
is desirable to evaluate instead the probability density func-
tion f
Ω
(b, j)
k
(ω) for the random variable
Ω
(b, j)
k
depicting the
transformation of normalized SIR Ω
(b, j)
k
in the dB-scale.
Given f
Ω
(b, j)
k
(ω), f
Ω
(b, j)
k
(ω) are easily deduced by employing
the relation
Ω
(b, j)
k
= 10 log
10
(Ω
(b, j)
k
). Conducting the anal-
ysis in the dB-domain is convenient for numerical com-
putations associated with the large-variance of lognormal
random variables that appear quite frequently in different
stages of the analysis. Furthermore, it renders a simple ex-
pression for
Ω
(b, j)
k
= 10 log
10
(GA)+
H
(b, j)
kb
+
σ
(b, j)
kb
−
I
(b, j)
k
in
terms of the summation of independent random variables
where
H
(b, j)
kb
,
σ
(b, j)
kb
,and
I
(b, j)
k
are random variables corre-
sponding to signal large-scale path-loss, effective small-scale
channel (in conjunction with MRC) and intercell interfer-
ence, respectively, defined in the dB-scale such that
H
(b, j)
kb
= 10 log
10
H
(b, j)
kb
,
σ
(b, j)
kb
= 10 log
10
σ
(b, j)
kb
,
I
(b, j)
k
= 10 log
10
I
(b, j)
k
.
(6)
T. El Shabrawy and T. Le-Ngoc 5
For LIGA,
3
f
Ω
(b, j)
k
(ω) is expressed by the convolution
f
Ω
(b, j)
k
(ω) ∝ f
H
(b, j)
kb
(h) ∗ f
σ
(b, j)
kb
(s) ∗ f
I
(b, j)
k
(i). (7)
The distribution functions, f
H
(b, j)
kb
(h), f
σ
(b, j)
kb
(s), are inde-
pendent of RRM;
H
(b, j)
kb
follows a normal distribution (since
large-scale path-loss is usually log-normal distributed) and
σ
(b, j)
kb
is related by (6)toσ
(b, j)
kb
that follows a gamma distri-
bution (since σ
(b, j)
kb
is expressed as the sum of G exponen-
tial random variables for Rayleigh fading channels). On the
other hand, computation of the probability density function
f
I
(b, j)
k
(i) is not necessarily straightforward since
I
(b, j)
k
heavily
relies on RRM operation across the entire network.
Derivations for f
I
(b, j)
k
(i)
The main burden in (7) is the evaluation of the probabil-
ity density function f
I
(b, j)
k
(i) characterizing the intercell inter-
ference affecting user k over designated group C
(j)
.Infact,
the difficulty of throughput analysis for interference-based
assignment schemes in general is mainly due to lack of infor-
mation on the distribution function f
I
(b, j)
k
(i). This might be
explained as follows: as shown in (1), I
(b, j)
k
is a linear com-
bination of aggregate group power P
(b
,j)
for all intercell base
stations b
. The distribution of P
(b
,j)
for any given subcar-
rier group C
(j)
is heavily dependent on RRM decisions at in-
tercell base stations reflected in terms of K
(b
,j)
(the number
of users assigned to C
(j)
at base station b
). In turn, K
(b
,j)
essentially requires knowledge of perceived interference pro-
files I
(b
,l)
k
for all k
,forallb
,forallC
(l)
where user k
is served
at an intercell base station b
. In other words, the interference
perceived by user k
over all groups (not only C
(j)
)affect the
expected outcome of K
(b
,j)
. It is also to be noted that I
(b
,l)
k
for all k
,forallb
,forallC
(l)
are not readily available and
similar to I
(b, j)
k
are derivable from power allocation profiles.
As a result, it is evident that RRM decisions and interference
profiles are coupled across base stations which reinforces the
explanation of the inherent difficulties of deriving f
I
(b, j)
k
(i).
It is worth mentioning that throughout this derivation, the
use of superscript (j)orC
(j)
is strictly reserved to signify the
group nominated for assignment.
Consider a network defined by the set of base stations
B
={1, 2, ,N
B
}.Letb ∈ B denote the serving base station
for the user k of interest and b
∈ B
,whereB
= B −{b} de-
picts the set of (N
B
− 1) base stations constituting sources of
intercell interference. Let us focus on a particular assignment
group C
(j)
selected from C ={C
(1)
, C
(2)
, ,C
(N
G
)
}. Further-
more, define C
(l)
∈ C
where C
= C −{C
(j)
} represents the
set of other subcarrier groups. LIGA will assign session k over
C
(j)
only if
I
(b, j)
k
<
I
(b,l)
k
for all C
(l)
∈ C
.IfK
(b
,j)
depicts the
3
Corresponding analysis for BCRGA is presented in the appendix.
K
(3,1)
K
(3,2)
Cell 3
K
(1,1)
K
(1,2)
Cell 1
K
(2,1)
K
(2,2)
Cell 2
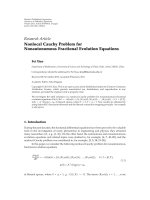
Figure 1: Three-cell network with two assignment groups.
number of sessions assigned over C
(j)
at base station b
,and
given FPA, then
P
(b
,j)
= K
(b
,j)
P
MAX
K
,(8)
where P
MAX
is the available base station power and K is the
number of active sessions per cell. Next, define Q
(b
,j)
(n) =
Pr [K
(b
,j)
= n] as the probability of assigning n users over
C
(j)
by base station b
. It can be anticipated that f
I
(b, j)
k
(i)
might be fully characterized by f
H
(b
,j)
kb
(h)forallb
∈ B
and
Q
(b
,j)
(n)forallb
∈ B
,aswellasQ
(b
,l)
(n)forallb
∈ B
,
for all C
(l)
∈ C
.Inotherwords,f
I
(b, j)
k
(i) is dependent on the
user distribution profile across all N
G
groups (rather than
only the candidate group C
(j)
). The reason Q
(b
,l)
(n)con-
tributes to the density function f
I
(b, j)
k
(i) might be best de-
scribed as a direct consequence of the criterion employed
for group selection (C
(j)
= min
C
(l)
I
(b,l)
k
). This indicates that
the random variable
I
(b, j)
k
(displaying minimum interfer-
ence across groups) is correlated with remaining interference
powers
I
(b,l)
k
for all C
(l)
∈ C
. This point will be reflected in
the analysis to follow.
For illustrative purposes, we will now focus on through-
put analysis in a three-cell network shown in Figure 1.Sys-
tem bandwidth is assumed to be subdivided into two groups,
C
={C
(1)
, C
(2)
}.Letb = 1 denote the base station of inter-
est and b
∈{2, 3}. Since only two groups of assignment are
available, then Q
(b
,1)
(n) = Q
(b
,2)
(K−n).ForLIGAwithFPA,
user k will be assigned on C
(1)
if I
(1,1)
k
<I
(1,2)
k
or alternatively
K
(2,1)
H
(1)
k2
+ K
(3,1)
H
(1)
k3
<K
(2,2)
H
(1)
k2
+ K
(3,2)
H
(1)
k3
=⇒
2K
(2,1)
− K
H
(1)
k2
<
K − 2K
(3,1)
H
(1)
k3
,
(9)
where each base station is supporting K active sessions. It is
important to note that the superscript j has been removed
from H
(z, j)
xy
as the assignment group has not been determined
at this point. Let us define Θ
={θ}, θ = (n
(2,1)
, n
(3,1)
) as the
set of all assignment profiles at intercell base stations.
Note that assignment profiles within each intercell base
station could be fully characterized by the number of
6 EURASIP Journal on Wireless Communications and Networking
users on assignment group C
(1)
since the total number of
users is K and C
={C
(1)
, C
(2)
}.From(9), it is evident
that for each profile θ
= (n
(2,1)
, n
(3,1)
), the joint sam-
ple (h
(1)
k2
, h
(1)
k3
) distributed according to f
H
(1)
k2
, H
(1)
k3
(h
(1)
k2
, h
(1)
k3
) =
f
H
(1)
k2
(h
(1)
k2
)f
H
(1)
k3
(h
(1)
k3
) (or alternatively (
h
(1)
k2
,
h
(1)
k3
) distributed ac-
cording to f
H
(1)
k2
,
H
(1)
k3
(
h
(1)
k2
,
h
(1)
k3
) = f
H
(1)
k2
(
h
(1)
k2
)f
H
k3
(
h
(1)
k3
)) directly
associates user k with C
(1)
or C
(2)
for assignment. Further-
more, (
h
(1)
k2
,
h
(1)
k3
) defines the interference perceived over the
selected group of assignment C
(j)
.Letusdefineafunc-
tion Π
θ
(
h
(1)
k2
,
h
(1)
k3
) that maps a sample (
h
(1)
k2
,
h
(1)
k3
)givenθ =
(n
(2,1)
, n
(3,1)
) to the corresponding interference
i
(1,j)
k
experi-
enced by session k on C
(j)
(whether C
(j)
is equal C
(1)
or C
(2)
).
Π
θ
(
h
(1)
k2
,
h
(1)
k3
) is expressed as
Π
θ
h
(1)
k2
,
h
(1)
k3
=
10 log
10
min
10
(
h
(1)
k2
/10)
n
(2,1)
+10
(
h
(1)
k3
/10)n
(3,1)
,
10
(
h
(1)
k2
/10)
K −n
(2,1)
+10
(
h
(1)
k3
/10)
K −n
(3,1)
.
(10)
Let us define f
I
(1,j)
k
|θ
(
i
(1,j)
k
) as the conditional probability
density function of
I
(1,j)
k
perceived by user k over the selected
group C
(j)
given an assignment profile θ.Forall(
h
(1)
k2
,
h
(1)
k3
)
pairs, the following numerical expression holds:
f
I
(1,j)
k
|θ
Π
θ
h
(1)
k2
,
h
(1)
k3
·
Δ
i
(1,j)
k
=
f
H
(1)
k2
h
(1)
k2
f
H
(1)
k3
h
(1)
k3
·
Δ
h
(1)
k2
Δ
h
(1)
k3
.
(11)
Therefore, by accounting for all possible samples (
h
(1)
k2
,
h
(1)
k3
), f
I
(1,j)
k
|θ
(
i
(1,j)
k
) could be numerically calculated. Finally,
f
I
(1,j)
k
(
i
(1,j)
k
) is related to f
I
(1,j)
k
|θ
(
i
(1,j)
k
) through
f
I
(1,j)
k
i
(1,j)
k
=
Θ
f
I
(1,j)
k
|θ
i
(1,j)
k
Pr[θ]. (12)
Therefore, from (12), the intercell interference distribution
(defined in the dB scale) f
I
(1,j)
k
(
i
(1,j)
k
) over the group of as-
signment C
(j)
requires derivation of Pr[θ]forallθ ∈ Θ.
Derivation of Pr[θ]
Define z
(1,1)
k
|θ
as the probability of assigning an arbitrary user
k served by base station 1 to C
(1)
conditional on the intercell
assignment profile θ. Furthermore, define Q
(1,1)
(n | θ) as the
conditional probability of n users in base station 1 sharing
assignment over C
(1)
. By closely inspecting (9), four different
scenarios may be possibly identified.
(i) K
(2,1)
≤ K/2andK
(3,1)
≤ K/2. Consequently,
z
(1,1)
k
|θ
=
⎧
⎪
⎨
⎪
⎩
1
2
for θ
=
K
2
,
K
2
,
1 otherwise,
(13)
and z
(1,1)
k
|θ
is independent of samples (
h
(1)
k2
,
h
(1)
k3
). Ac-
cordingly,
Q
(1,1)
(n | θ) =
⎧
⎪
⎪
⎪
⎨
⎪
⎪
⎪
⎩
⎛
⎝
K
n
⎞
⎠
1
2
K
θ =
K
2
,
K
2
,
δ
nK
otherwise,
(14)
where δ is the Kronecker-Delta function.
(ii) K
(2,1)
<K/2andK
(3,1)
>K/2. Consequently,
z
(1,1)
k|θ
= Pr
H
(1)
k2
> 10 log
10
2K
(3,1)
− K
K − 2K
(2,1)
+
H
(1)
k3
.
(15)
Accordingly, Q
(1,1)
(n | θ) follows a binomial distribu-
tion with parameters (K, z
(1,1)
k|θ
). Since
H
(1)
k2
and
H
(1)
k3
both follow normal distributions, then z
(1,1)
k
|θ
could be
numerically estimated.
(iii) K
(2,1)
>K/2andK
(3,1)
<K/2. Consequently,
z
(1,1)
k
|θ
= Pr
H
(1)
k2
> 10 log
10
K − 2K
(3,1)
2K
(2,1)
− K
+
H
(1)
k3
.
(16)
Accordingly, Q
(1,1)
(n | θ) follows a binomial distribu-
tion with parameters (K, z
(1,1)
k
|θ
). Since
H
(1)
k2
and
H
(1)
k3
both follow normal distributions, then z
(1,1)
k
|θ
could be
numerically estimated.
(iv) K
(2,1)
>K/2andK
(3,1)
>K/2. Consequently, z
(1,1)
k|θ
= 0
and z
(1,1)
k
|θ
is independent of samples (
h
(1)
k2
,
h
(1)
k3
). Ac-
cordingly, Q
(1,1)
(n | θ) = δ
n0
,whereδ is the Kroneck-
er-Delta function.
Let us focus on the distribution Q
(1,1)
(n) characterizing
the number of users K
(1,1)
assigned in cell 1 to group C
(1)
.
This could be derived by averaging of Q
(1,1)
(n | θ)overall
θ
∈ Θ such that
Q
(1,1)
(n) =
Θ
Q
(1,1)
(n | θ)Pr[θ]. (17)
It is important to note that since only two assignment groups
are assumed, then Q
(1,1)
(n) = Q
(1,2)
(K − n). Furthermore,
since C
(1)
has been arbitrarily chosen for investigation, then
it should be expected that Q
(1,1)
(n) = Q
(1,2)
(n)andex-
hibits a symmetric structure around (K +1)/2. Therefore,
let us drop the superscript reflecting the assignment group
and define Q
(1)
(n) as the probability of assigning n users
on any given group within base station 1. The probability
of the event θ
= (n
(2,1)
, n
(3,1)
) can be expressed as Pr [θ =
(n
(2,1)
, n
(3,1)
)] = Q
(2,1)
(n
(2,1)
)·Q
(3,1)
(n
(3,1)
). Therefore, (17)
T. El Shabrawy and T. Le-Ngoc 7
might be rewritten as
Q
(1)
(n) =
(n
(2,1)
,n
(3,1)
)
Q
(1)
n |
n
(2,1)
, n
(3,1)
×
Q
(2,1)
n
(2,1)
×
Q
(3,1)
n
(3,1)
.
(18)
In a homogeneous network, it is possible to assume
that the statistical properties for the number of sessions per
group eventually converge to the same distribution such that
Q
(b
,1)
(n) = Q
(1)
(n), for all b
,foralln = 1, 2, , K. Subse-
quently, (18)becomes
Q
(1)
(n) =
(n
(2,1)
,n
(3,1)
)
Q
(1)
n |
n
(2,1)
, n
(3,1)
×
Q
(1)
n
(2,1)
·
Q
(1)
n
(3,1)
.
(19)
In other words, the distribution of number of users per as-
signment group resolves to the solution of K +1quadratic
equations.
The key idea inspiring the discussion above is to attempt
to break the dependence of the operation of power allocation
and LIGA across base stations by assuming that they share
identical statistical properties in a homogenous network. In
order to solve the system of equations of (19), it is possible to
exploit the homogeneous nature of the considered network
in devising an iterative methodology. The approach relies on
the postulation that all base stations employ the same cri-
teria and procedures for group assignment and power allo-
cation. Consequently, stochastic processes across cells of the
network tend to converge to distribution functions that share
common parameters.
In view of that, for a base station of interest, it is possi-
ble to set a particular stochastic configuration for all other
base stations in the network. The configurations assumed
influence group assignment and power allocation decisions
within the base station under investigation such that the
probability measures within the corresponding cell could be
evaluated. In light of the homogeneous system, it is legiti-
mate to expect all other base stations to behave similarly such
that stochastic outcomes within the cell of interest from a
given iteration might be redeployed at external base stations
to improve probability estimates in further iterations. Itera-
tions are repeated until stochastic parameters characterizing
cells of the network (such as mean, variance, etc.) or esti-
mated probability density functions exhibit minimum varia-
tion from iteration to the next one.
Since in the first iteration, there is no prior information
or estimates with regards to the transmission power profile
across surrounding cells, an initial configuration is assumed
where users are uniformly distributed over available groups.
Consequently, it is assumed for the first iteration that
if K is even, Q
(b
,1)
n
(b
,1)
=
⎧
⎪
⎨
⎪
⎩
1 n
(b
,1)
=
K
2
0 otherwise,
if K is odd, Q
(b
,1)
n
(b
,1)
=
⎧
⎪
⎪
⎪
⎪
⎪
⎨
⎪
⎪
⎪
⎪
⎪
⎩
1
2
n
(b
,1)
=
K +1
2
,
1
2
n
(b
,1)
=
K − 1
2
,
0 otherwise.
(20)
New values for Q
(1)
(n) are computed using (18) and inserted
in the next iteration as Q
(b
,1)
(n) to attain a better estimate
for the distribution of number of users per group. The pro-
cess is repeated until the distribution Q
(1)
(n) shows minimal
variations over successive iterations, that is, reaches a steady
state. Finally, Pr[θ
= (n
(2,1)
, n
(3,1)
)] = Q
(1)
(n
(2,1)
)·Q
(1)
(n
(3,1)
)
is attained and inserted in (12)tocomputef
I
(1,j)
k
(
i
(1,j)
k
).
4.2. Simulation model
The analysis in the previous subsection for intercell inter-
ference distribution within a simple three-cell grouped MC-
CDMA network while adopting LIGA has demonstrated that
an iterative framework constitutes a suitable platform for
performance evaluation. However, as the number of cells
and/or assignment groups increases, the analysis becomes
quite cumbersome due to the inherent difficulty in tracing
correlations across groups as well as base stations. As a re-
sult, it becomes of interest to develop a simulation model
that is more effective in throughput evaluation of large net-
works and/or more sophisticated power allocation schemes,
for exmple, WFPA.
Let us assume a base station of interest b with registered
users receiving measurable interference from only (N
B
− 1)
surrounding cells. The base station is simultaneously sup-
porting K active data users. Let us assume that each itera-
tion is comprised of M samples. For each and every sample
m, K mobile terminals are randomly positioned within the
cell of interest. The corresponding large-scale path-loss and
small-scale fading channel random variables are sampled in
accordance with their corresponding characteristic distribu-
tions.
Let us define a vector P
(b
)
m
= [P
(b
,1)
m
, P
(b
,2)
m
, ,
P
(b
,N
G
)
m
]
T
as the power allocation profile in base station b
over subcarrier groups considered for the mth sample. In the
first iteration, P
(b
,j)
m
= P
MAX
/N
G
,forallm,forallb
,for
all C
(j)
∈ C is assumed. In other words, interference power
from intercell base stations is evenly distributed across all as-
signment groups.
Given interference measurements for all K usersacrossall
groups C
(j)
∈ C within the cell of interest, group assignment,
and power allocation are performed in accordance with
the deployed strategies (LIGA/BCRGA and FPA/WFPA). As
a result of the first iteration across all samples, a matrix
P
= [P
(b)
1
P
(b)
2
··· P
(b)
M
]ofsize(N
G
× M)could
be defined that stores P
(b, j)
m
measurements across all groups
C
(j)
∈ C computed for all M samples within the cell of inter-
est b.
In the next iteration, the sample values for elements of
P
(b
)
m
for each intercell base station b
are drawn from P.
Therefore, in the second iteration, for each new sample m
and for all base stations b
, P
(b
)
m
is sampled as P
(b
)
m
=
randperm(P
(b
)
v
), where v = rand(1 : M) and “randperm” is
a function that randomly permutes components of the vec-
tor P
(b)
v
computed during the first iteration. In other words,
for each base station b
,arandomcolumnv is selected in P.
Following that, the corresponding stored profile P
(b)
v
is ran-
domly permuted and deployed as the group power profile
8 EURASIP Journal on Wireless Communications and Networking
0 5 10 15 20 25 30 35
Number of users per group (K)
0
0.05
0.1
0.15
0.2
0.25
0.3
Q
(1)
(n) = Pr{K
(1,1)
= n}
Analytical model
Simulation model
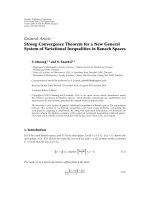
Figure 2: Probability distribution Q
(1)
(n)ofnumberofusersper
assignment group in a 3-cell network.
P
(b
)
m
for the second iteration. It is to be noted that by adopt-
ing such approach, it becomes possible to conserve the to-
tal power constraint across groups to be P
MAX
(i.e., maintain
correlation properties of power distribution across assign-
ment groups). Consequently, the matrix P could be updated
through the second iteration. The procedure is continuously
repeated until statistical parameters reach a steady state.
In order to validate correctness of the developed simu-
lation model, Figure 2 compares results for the probability
distribution of number of users per group against analyt-
ical results for the three-cell network discussed in Section
4.1,whereK
= 35. The curves display very good agreement
suggesting reliabilityof the adopted simulation approach.
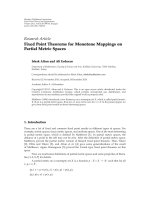
Figure 3 also shows proximity of analytical and simulation
curves for the distribution function of intercell interference
I
(1,j)
k
. It is to be remarked that since background noise is as-
sumed to be negligible, intercell interference (in dB-scale)
falls to
−∞ when θ = (K
(2,j)
= 0, K
(3,j)
= 0) over C
(j)
.Itis
important to stress that the main objective of Figures 2 and
3 is to validate reliability of the iterative simulation model
rather than presenting quantitative results. The assumption
of negligible noise was found reasonable in simulation results
for larger networks presented in the next section.
5. SIMULATION RESULTS
5.1. Simulation scenario
Consider a cellular network composed of N
B
= 19 cells with
a cell radius of 400 m as shown in Figure 4.Thenumberof
system subcarriers N
C
is 64. With an assumed spreading fac-
tor G of 8, the number of subcarrier groups N
G
is N
C
/G = 8.
All base stations are assumed to use an isotropic antenna
with A
= 0dBandamaximumpowerP
MAX
of 33 dBm. The
Hata small-to-medium city path-loss model is used, that is,
PL(dB)
= 137.744 + 35.255log
10
(D
km
)[18], where a carrier
frequency of 2 GHz, base station antenna height of 30 m, mo-
−160 −140 −120 −100 −80 −60 −40 −20
Intercell interference over assignment group (dB)
0.1
0.2
0.3
0.4
0.5
0.6
0.7
0.8
0.9
1
Cumulative distribution
Simulation model
Analytical model
Figure 3: Cumulative distribution of intercell interference on as-
signment group in a 3-cell network.
bile antenna height of 2 m are assumed. Mobile users regis-
ter with the base station b that offers the best (lowest) path-
loss. The remaining path-losses from other base stations are
considered as interfering channels. We have tested the con-
vergence of the proposed iterative framework by considering
different number of iterations as well as various initial power
allocations. In all cases, results attained have converged to
the same distributions and 5 iterations were deemed as a
suitable value for reliable measurements. We are interested
in showing the throughput cumulative curves for individ-
ual users F
R
(b, j)
k
(r) as well as aggregate cell-throughput F
R
(b)
(r)
within the central base station (i.e., cell of interest) for nu-
merous RRM (group assignment/power allocation) configu-
rations. Furthermore, we investigate the effects of constraints
on the number codes per assignment group on the perfor-
mance of proposed group assignment schemes. Code limita-
tion per assignment group is necessary to conserve orthog-
onality between spreading codes employed within the same
cell. It is important to reiterate that even though simulations
have been used for investigating throughput capacity, the re-
sults collected using the developed platform should be pre-
sumed to be accurate (as confirmed by results in Figures 2
and 3 for the three-cell network scenario). The iterative plat-
form proposed should be expected to display superiority in
simulation time requirements as it avoids the need to simu-
late time-correlated system behavior.
5.2. Group assignment without code limitations
We will commence by considering an MC-CDMA system
that sets no restrictions on the number of users per assign-
ment group. Results without code limitation constraints help
to demonstrate the tendency of the proposed assignment
schemes, and to indicate the expected limits on their achiev-
able throughput performance of group assignment strate-
gies for practical scenarios (where the number of assigned
T. El Shabrawy and T. Le-Ngoc 9
b
b
b
b
b
b
b
b
b
b
b
b
b
b
b
b
b
b
b
H
(b,j)
kb
H
(b,j)
kb
Figure 4: Simulation network.
20 40 60 80 100 120 140 160 180 200 220
To t a l t h r o u g h p u t r (bits/s/Hz)
0
0.1
0.2
0.3
0.4
0.5
0.6
0.7
0.8
0.9
1
Cumulative distribution Pr R<r
RGA, negligible noise
BSGA, negligible noise
LIGA, negligible noise
BCRGA, negligible noise
RGA, N
=−107.04dBm
BSGA, N
=−107.04dBm
LIGA, N
=−107.04dBm
BCRGA, N
=−107.04dBm
Figure 5: Cumulative probability distribution of total throughput
per cell without code limitation constraints on the number of users
per assignment group (K
= 64 users/cell and WFPA in use).
codes per group is limited by the spreading factor). Figure 5
compares the cumulative probability distribution of total
cell-throughput for different assignment schemes assuming
K
= 64 users per cell and WFPA is used. It is evident
that LIGA has the best performance. This might be counter-
intuitive since BCRGA attempts to minimize SINR while
LIGA only addresses minimizing interference. Figure 5 also
reflects that the assumption of ignoring the thermal noise re-
sults in slightly optimistic results for the throughput distri-
bution. This is most evident in the case of LIGA. Neverthe-
less, more important is that incorporating thermal noise in
the simulation platform maintains the trend of LIGA superi-
ority.
In order to explain superiority of LIGA over BCRGA,
Figure 6 depicts the probability distribution for the number
of users per assignment group for K
= 16 and K = 64 users
0 5 10 15 20 25 30 35 40
Number of users per subcarrier group (K)
0
0.05
0.1
0.15
0.2
0.25
0.3
0.35
Probability mass Pr{K
(b
,j)
= n}
LIGA, K = 16
BCRGA, K
= 16
LIGA, K
= 64
BCRGA, K
= 64
Figure 6: Probability distribution of number of users per assign-
ment group in LIGA and BCRGA without code constraints on the
number of users per assignment group (WFPA in use).
per cell. We can notice that in LIGA there exists a higher
probability of groups with no assignment (i.e., K
(b
,j)
= 0).
Consequently, this opens an avenue for mobiles in the cell of
interest to avoid sources of intolerable intercell interference
from base stations where they might suffer from degraded
large-scale path-loss. Therefore, even though BCRGA em-
ploys a more optimal assignment criterion from the perspec-
tive of a single-cell, the resultant distribution of P
(b
,j)
across
assignment groups overshadows such gains and accordingly
hinders throughput performance.
5.3. Group assignment with code limitations
In this subsection, we move on to consider more practi-
cal scenarios when number of users per group is limited to
the spreading factor. Figure 7 shows total throughput perfor-
mance comparison of group assignment schemes for a low-
load scenario (e.g., K
= 16) and WFPA is used. The curves
indicate that LIGA maintains its superiority due to relative
flexibility on availability of desired assignment groups for
each user. However, at full load (K
= 64) where the number
of users per group equals the spreading factor, BCRGA tends
to offer the best performance as shown in Figure 8. The figure
also indicates that the performance of LIGA falls even below
that of BSGA under such scenario. It is to be noted that due
to code limitations, the attained performance is dependent
on the sequence of users’ assignment. In the results shown,
we sort users in ascending order giving priority to users with
better assignment profile over their desired subcarrier group.
For example, in LIGA, we prioritize users of the candidate
group that offers the least interference compared to other ac-
tive sessions.
As mentioned above, the performance of group assign-
ment strategies without code limitation can be viewed as an
expected limit on the achievable throughput performance
under practical scenarios. This is confirmed in Figure 9
10 EURASIP Journal on Wireless Communications and Networking
10 20 30 40 50 60 70 80 90 100 110
To t a l t h r o u g h p u t r (bits/s/Hz)
0
0.1
0.2
0.3
0.4
0.5
0.6
0.7
0.8
0.9
1
Cumulative distribution Pr R<r
RGA
BSGA
LIGA
BCRGA
Figure 7: Cumulative distribution of total throughput per cell with
code constraints on the number of users per assignment group (K
=
16 users/cell and WFPA in use).
20 30 40 50 60 70 80 90 100 110 120 130 140 150 160
To t a l t h r o u g h p u t r (bits/s/Hz)
0
0.1
0.2
0.3
0.4
0.5
0.6
0.7
0.8
0.9
1
Cumulative distribution Pr R<r
RGA
BSGA
LIGA
BCRGA
Figure 8: Cumulative distribution of total throughput per cell with
code constraints on the number of users per assignment group (K
=
64 users/cell and WFPA in use).
where the throughput performance for code-limited scenar-
ios at low load (i.e., K
= 16) approaches that of the unlim-
ited case since, at low load, most users are assigned to their
desired groups and the effects of code constraints are negli-
gible. However, at high loads (e.g., K
= 64), some users are
not assigned to their optimal groups and, as a result, the loss
in throughput performance due to code constraints becomes
more significant.
In Figure 10, we show the impact of the power al-
location scheme on throughput performance. It is clear
the performance drop of FPA compared to WFPA. How-
ever, by inspecting throughput curves for a single user in
Figure 11, WFPA is limited by unacceptable outage prob-
abilities. Nevertheless, both power allocation schemes dis-
20 30 40 50 60 70 80 90 100 110 120 130 140 150 160
To t a l t h r o u g h p u t r (bits/s/Hz)
0
0.1
0.2
0.3
0.4
0.5
0.6
0.7
0.8
0.9
1
Cumulative distribution Pr R<r
No code limitations, K = 16
Code limitations, K
= 16
No code limitations, K
= 64
Code limitations, K
= 64
Figure 9: Effects of code constraints on total throughput perfor-
mance under BCRGA and WFPA.
0 10 20 30 40 50 60 70 80 90 100 110 120 130 140 150
To t a l t h r o u g h p u t r (bits/s/Hz)
0
0.1
0.2
0.3
0.4
0.5
0.6
0.7
0.8
0.9
1
Cumulative distribution Pr R<r
K = 64, WFPA
K
= 64, FPA
K
= 16, WFPA
K
= 16, FPA
Figure 10: Cumulative distribution of total throughput per cell
with code constraints for FPA and WFPA (BCRGA in use).
play similar trends with respect to group assignment where
LIGA has better performance at low load while BCRGA
demonstrates superior performance at high load as shown in
Figure 12.
5.4. Discussions
As discussed above, results show a large decline in perfor-
mance due to code limitations. In order to restore some
of the lost performance, two approaches might be consid-
ered and are issues of further studies. Firstly, the sequence
of group assignment might be proven to be critical in im-
proving throughput within the limited code environment.
Secondly, pseudorandom sequence codes might be used to
T. El Shabrawy and T. Le-Ngoc 11
02468101214161820
Single user throughput r
U
(bits/s/Hz)
0
0.1
0.2
0.3
0.4
0.5
0.6
0.7
0.8
0.9
1
Cumulative distribution Pr R
U
<r
U
K = 64, WFPA
K
= 64, FPA
K
= 16, WFPA
K
= 16, FPA
Figure 11: Cumulative distribution of single-user throughput with
code constraints for FPA and WFPA (BCRGA in use).
0 10 20 30 40 50 60 70 80 90 100 110 120
To t a l t h r o u g h p u t r (bits/s/Hz)
0
0.1
0.2
0.3
0.4
0.5
0.6
0.7
0.8
0.9
1
Cumulative distribution function Pr R<r
LIGA, K = 16
BCRGA, K
= 16
LIGA, K
= 64
BCRGA, K
= 64
Figure 12: Cumulative distribution of total throughput per cell
with code constraints for FPA.
help loosen the limitations on number of codes per group.
However, the drawback of such an approach would be loss
of orthogonality and therefore an associated increase in in-
tercell as well as intracell interference is inevitable. One ad-
vantage of the second approach is that it has the prospect
to restore superiority of the LIGA strategy in high-load sce-
narios. The LIGA could be considered as a favorable scheme
because it does not require tracking of fast fading channel
responses.
6. CONCLUSIONS
MC-CDMA is a promising technology for supporting data
traffic in next generations of wireless networks. RRM evolves
as a critical component in order to cope with dynamics of
the mobile environment as well as support anticipated re-
source requirements of future services. Studies in a single-
cell suggest that RRM should be performed on the ba-
sis of deploying subcarrier groups with the best channel
response. However, in a multicell environment, through-
put performance over such channels might be severely hin-
dered by intercell interference. Accordingly, in this paper, two
interference-based schemes have been proposed for group
assignment in multicell MC-CDMA networks. LIGA assigns
users to groups experiencing minimum interference, while
BCRGA selects the subcarrier group that holds the best ratio
of channel response-to-received interference. Results show
that interference-based assignment renders significant per-
formance gains compared in BSGA recommended in single-
cell studies. Given no code limitation on the number of
users per assignment group, LIGA exhibits the best through-
put performance. However, in practice, the number of users
per assignment group must be restricted to the spreading
factor in order to conserve orthogonality among transmis-
sions. This deprives some users from employing their can-
didate assignment groups and consequently system through-
put performance declines. Under low-load scenarios, LIGA
conserves its good performance, while in high-load scenar-
ios BCRGA tends to offer best performance. Further studies
are essential to devise strategies in order to reclaim some of
the performance loss due to code limitations.
APPENDIX
SOME DERIVATIONS
A similar approach to that discussed in Section 4 could
be used to find f
R
(b, j)
k
(r)andf
R
(b)
(r) in BCRGA. Once again
deriving f
Ω
(b, j)
k
(ω) is the critical step in computing user- and
cell-throughput distributions. However, contrary to LIGA
σ
(b, j)
kb
and
I
(b, j)
k
are correlated. Therefore,
Ω
(b, j)
k
is expressed
as
Ω
(b, j)
k
= 10 log
10
(GA)+
H
(b, j)
kb
+
Ψ
(b, j)
kb
where
Ψ
(b, j)
kb
=
10 log
10
(Ψ
(b, j)
kb
) =
σ
(b, j)
kb
−
I
(b, j)
k
. Accordingly derivation of
f
Ω
(b, j)
k
(ω) resolves to computing f
Ψ
(b, j)
kb
(ψ).
Derivations for F
Ψ
(b, j)
kb
(ψ)
For three-cell network shown in Figure 1 and assuming FPA,
user k will be assigned on C
(1)
if Ψ
(1,1)
k1
< Ψ
(1,2)
k1
or alterna-
tively,
K
(2,1)
H
(1)
k2
+ K
(3,1)
H
(1)
k3
σ
(1,1)
k1
<
K − K
(2,1)
H
(1)
k2
+
K − K
(3,1)
H
(1)
k3
σ
(1,2)
k1
.
(A.1)
For Θ
={θ}, θ = (n
(2,1)
, n
(3,1)
) the set of all assignment
profiles at intercell base-stations, the joint sample (h
(1)
k2
,
h
(1)
k3
, s
(1,1)
k1
, s
(1,2)
k1
) (or alternatively, (
h
(1)
k2
,
h
(1)
k3
, s
(1,1)
k1
, s
(1,2)
k1
)) di-
rectly associates user k with C
(1)
or C
(2)
for assignment.
Correspondingly, a function Φ
θ
(
h
(1)
k2
,
h
(1)
k3
, s
(1,1)
k1
, s
(1,2)
k1
) that
maps a sample (
h
(1)
k2
,
h
(1)
k3
, s
(1,1)
k1
, s
(1,2)
k1
)givenθ = (n
(2,1)
, n
(3,1)
)
to the corresponding
Ψ
(1,j)
k1
could be also defined. For all
12 EURASIP Journal on Wireless Communications and Networking
(
h
(1)
k2
,
h
(1)
k3
, s
(1,1)
k1
, s
(1,2)
k1
) quadruples, the following numerical
expression holds:
f
Ψ
(1,j)
k1
|θ
Φ
θ
h
(1)
k2
,
h
(1)
k3
, s
(1,1)
k1
, s
(1,2)
k1
·
Δψ
(1,j)
k1
=
f
H
(1)
k2
h
(1)
k2
f
H
(1)
k3
h
(1)
k3
f
σ
(1,1)
k1
s
(1,1)
k1
f
σ
(1,2)
k1
s
(1,2)
k1
·
Δ
h
(1)
k2
Δ
h
(1)
k3
Δs
(1,1)
k1
Δs
(1,2)
k1
.
(A.2)
Therefore, f
Ψ
(1,j)
k1
|θ
(ψ
(1,j)
k1
) could be numerically evaluated and
f
Ψ
(1,j)
k1
(ψ
(1,j)
k1
) =
Θ
f
Ψ
(1,j)
k1
|θ
(ψ
(1,j)
k1
)Pr[θ].
Derivation of Pr [θ]
The inequality (A.1) could be rewritten as Λ(K
(2,1)
H
(1)
k2
+
K
(3,1)
H
(1)
k3
) < (K − K
(2,1)
)H
(1)
k2
+(K − K
(3,1)
)H
(1)
k3
,where
Λ
= s
(1,2)
k1
/s
(1,1)
k1
. Note that Λ is characterized as the ratio
of two independently identically distributed gamma random
variables.
In BCRGA, it is not possible to compute z
(1,1)
k
|θ
and
Q
(1,1)
(n | θ) by considering a four-quadrant dissection of
the sample space of Θ as was the case in LIGA. The exis-
tence of the parameter Λ prevents us from identifying regions
where z
(1,1)
k|θ
= 1 (i.e., scenario (i) in LIGA with K
(2,1)
<K/2,
K
(3,1)
<K/2) or z
(1,1)
k
|θ
= 0 (i.e., scenario (iv) in LIGA with
K
(2,1)
>K/2, K
(3,1)
>K/2), which was used in LIGA analysis
to simplify numerical computations for two out of the four
partitions characterizing the intercell assignment profile Θ.
Nevertheless, z
(1,1)
k
|θ
for θ = (n
(2,1)
, n
(3,1)
) might be still evalu-
ated by numerically computing
z
(1,1)
k
|θ
= Pr
Λ <
K − n
(2,1)
+
K − n
(3,1)
Π
n
(2,1)
+ n
(3,1)
Π
=
∞
0
Pr
Λ<
K −n
(2,1)
2
+
K −n
(3,1)
π
n
(2,1)
+n
(3,1)
π
f
Π
(π)dπ,
(A.3)
where Π
= H
(1)
k3
/H
(1)
k2
follows a lognormal distribution with a
probability density function f
Π
(π). Accordingly, Q
(1,1)
(n | θ)
follows a binomial distribution with parameters (K, z
(1,1)
k
|θ
).
Finally, Pr[θ] could be estimated iteratively by using (19)
similar to the case of LIGA analysis.
REFERENCES
[1] N. Yee, J-P. Linnartz, and G. Fettweis, “Multi-Carrier-CDMA
in indoor wireless networks,” in Proceedings of IEEE Interna-
tional Symposium on Personal, Indoor and Mobile Radio Com-
munications (PIMRC ’93), pp. 109–113, Yokohama, Japan,
September 1993.
[2] M. Tabulo, D. Laurenson, S. McLaughlin, and E. Al-Susa, “A
linear programming algorithm for a grouped MC-CDMA sys-
tem,” in Proceedings of the 58th IEEE Vehicular Technology Con-
ference (VTC ’03), vol. 3, pp. 1463–1467, Orlando, Fla, USA,
October 2003.
[3] R. Van Nee and R. Prasad, OFDM for Wireless Multimedia
Communications, Artech House Publishers, Norwood, Mass,
USA, 2000.
[4] X. Cai, S. Zhou, and G. B. Giannakis, “Group-orthogonal
multicarrier CDMA,” IEEE Transactions on Communications,
vol. 52, no. 1, pp. 90–99, 2004.
[5] L. Chuxiang and W. Xiaodong, “Adaptive subchannel al-
location in multiuser MC-CDMA systems,” in Proceedings
of IEEE Global Telecommunications Conference (GLOBECOM
’04), vol. 4, pp. 2503–2507, Dallas, Tex, USA, November-
December 2004.
[6] P. K. Sampath, H. Cam, and A. Natarajan, “Power and subcar-
rier allocation for multirate MC-CDMA system,” in Proceed-
ings of the 58th IEEE Vehicular Technology Conference (VTC
’03), vol. 3, pp. 1900–1902, Orlando, Fla, USA, October 2004.
[7] Y. H. Lee and Y. Bar-Ness, “Transmission power adaptations in
MC-CDMA communications over Rayleigh fading channels,”
in Proceedings of IEEE Wireless Communications and Network-
ing Conference (WCNC ’04), vol. 3, pp. 1589–1594, Atlanta,
Ga, USA, March 2004.
[8] M. Nunes, J. Santos, A. Rodrigues, J. Punt, H. Nikokaar, and
R. Prasad, “Effects of downlink intercell interference on MC-
CDMA system performance,” in Proceedings of the 9th IEEE
International Symposium on Personal, Indoor and Mobile Radio
Communications (PIMRC ’98), vol. 3, pp. 1050–1054, Boston,
Mass, USA, September 1998.
[9] M. Debbah, “Capacity of a downlink MC-CDMA multi-cell
network,” in Proceedings of IEEE International Conference on
Acoustics, Speech and Signal Processing (ICASSP ’04), vol. 4, pp.
761–764, Montreal, Que, Canada, May 2004.
[10] K. S. Gilhousen, I. M. Jacobs, R. Padovani, A. J. Viterbi, L. A.
Weaver Jr., and C. E. Wheatley III, “On the capacity of a cellu-
larCDMAsystem,”IEEE Transactions on Vehicular Technology,
vol. 40, no. 2, pp. 303–312, 1991.
[11] J. S. Evans and D. Everitt, “On the teletraffic capacity of CDMA
cellular networks,” IEEE Transactions on Vehicular Technology,
vol. 48, no. 1, pp. 153–165, 1999.
[12] D. K. Kim and D. K. Sung, “Capacity estimation for an SIR-
based power-controlled CDMA system supporting ON-OFF
traffic,” IEEE Transactions on Vehicular Technology, vol. 49,
no. 4, pp. 1094–1101, 2000.
[13] R. Gallager, Information Theory and Reliable Communications,
John Wiley & Sons, New York, NY, USA, 1968.
[14] K. L. Baum, T. A. Kostas, P. J. Sartori, and B. K. Classon, “Per-
formance characteristics of cellular systems with different link
adaptation strategies,” IEEE Transactions on Vehicular Technol-
ogy, vol. 52, no. 6, pp. 1497–1507, 2003.
[15] J. Lai and N. B. Mandayam, “Minimum duration outages in
Rayleigh fading channels,” IEEE Transactions on Communica-
tions, vol. 49, no. 10, pp. 1755–1761, 2001.
[16] X. Qiu and K. Chawla, “On the performance of adaptive mod-
ulation in cellular systems,” IEEE Transactions on Communica-
tions, vol. 47, no. 6, pp. 884–895, 1999.
[17] S. Kaiser, “OFDM-CDMA versus DS-CDMA: performance
evaluation for fading channels,” in
Proceedings of the IEEE In-
ternat ional Conference on Communications (ICC ’95), vol. 3,
pp. 1722–1726, Seattle, Wash, USA, June 1995.
[18] T. Rappaport, Wireless Communications: Principle and Practice,
Prentice-Hall, Upper Saddle River, NJ, USA, 2nd edition, 2001.