Báo cáo hóa học: " Research Article Exploring Landmark Placement Strategies for Topology-Based Localization in Wireless Sensor Networks" pot
Bạn đang xem bản rút gọn của tài liệu. Xem và tải ngay bản đầy đủ của tài liệu tại đây (1.81 MB, 12 trang )
Hindawi Publishing Corporation
EURASIP Journal on Advances in Signal Processing
Volume 2008, Article ID 275658, 12 pages
doi:10.1155/2008/275658
Research Article
Exploring Landmark Placement Strategies for Topology-Based
Localization in Wireless Sensor Networks
Farid Benbadis,
1
Katia Obraczka,
2
Jorge Cort
´
es,
3
and Alexandre Brandwajn
2
1
Laboratoire LIP6/CNRS, UMR 7606, Universit
´
e Pierre et Marie Curie, 4 place jussieu, 75005 Paris, France
2
Department of Computer Engineer ing, University of California, Santa Cruz, C A 95064, USA
3
Department of Mechanical and Aerospace Engineering, University of California, San Die go, CA 92093, USA
Correspondence should be addressed to Farid Benbadis,
Received 31 March 2007; Revised 24 September 2007; Accepted 21 December 2007
Recommended by Rong Zheng
In topology-based localization, each node in a network computes its hop-count distance to a finite number of reference nodes,
or “landmarks”. This paper studies the impact of landmark placement on the accuracy of the resulting coordinate systems. The
coordinates of each node are given by the hop-count distance to the landmarks. We show analytically that placing landmarks on
the boundary of the topology yields more accurate coordinate systems than when landmarks are placed in the interior. Moreover,
under some conditions, we show that uniform landmark deployment on the boundary is optimal. This work is also the first
empirical study to consider not only uniform, synthetic topologies, but also nonuniform topologies resembling more concrete
deployments. Our simulation results show that, in general, if enough landmarks are used, random landmark placement yields
comparative performance to placing landmarks on the boundary randomly or equally spaced. This is an important result since
boundary placement, especially at equal distances, may turn out to be infeasible and/or prohibitively expensive (in terms of
communication, processing overhead, and power consumption) in networks of nodes with limited capabilities.
Copyright © 2008 Farid Benbadis et al. This is an open access article distributed under the Creative Commons Attribution License,
which permits unrestricted use, distribution, and reproduction in any medium, provided the original work is properly cited.
1. INTRODUCTION
Sensor networks typically refer to a collection of nodes that
have sensing,processing, storage, and (wireless) communi-
cation capabilities.In general, because of their small form
factor and low cost, sensor network nodes often have limited
capabilities; furthermore, as they are frequently battery
powered, energy is a premium resource that directly impacts
the lifetime of nodes and the sensor network as a whole.
Sensor networks have a wide range of applications
with significant scientific and societal relevance [1]. Exam-
ple applications include environmental monitoring, object
tracking, surveillance, and emergency response and rescue
operations. While some scenarios allow for manual place-
ment of sensor network nodes in the field, others require
“random” deployment, where nodes are simply “dropped”
(e.g., from an airplane), and once they land they need to
self-organize into a network and start performing the task
at hand.
One important step in self-organization is positioning,
which refers to having nodes find their physical locations
[2, 3]. Node positioning is required by sensor network
core functions such as topology control, data aggregation,
and routing [4, 5] and may also be needed by a number
of applications. For instance, the sensor network could be
tasked to report the air temperature’s running average by
geographic region.
One clear solution to the positioning problem is provided
by satellite-based systems [6–8], among which the Global
Positioning System (GPS) is probably the most widely used.
However, in some scenarios, satellite-based localization is
not possible. This is the case of indoor, underwater, and
underground deployments. Furthermore, equipping sensor
nodes with GPS receivers might be prohibitive for reasons
related to cost, form factor, energy consumption, or a
combination of them. A possible alternative is to equip only
a subset of the nodes with GPS receivers and to have all other
nodes compute their position relative to the GPS-capable
nodes. A recent work [9] provides a theoretical study of this
problem using graph rigidity. For instance, in a multitiered
heterogeneous deployment, nodes that have extended life
batteries and/or have higher processing power could have
GPS capabilities. However, this may still be infeasible in some
deployments.
2 EURASIP Journal on Advances in Signal Processing
In situations where no GPS anchors can be used, nodes
are clueless about their geographic coordinates. Therefore,
numerous GPS-less methods have been proposed. Coor-
dinates generated by such methods are known as virtual
coordinates. Even though some applications may still require
real coordinates, virtual coordinate positioning can be used
by core functions such as position-based routing, topology
control, and data aggregation.
Motivated by the state-of-the-art on GPS-less positioning
systems, this paper aims at evaluating the effect of landmark
placement strategies on the quality of the resulting virtual
coordinate system. One of our goals is to investigate if
landmark placement/election can be either simplified, or,
better, avoided altogether by assigning the role of landmarks
to any node in the topology.
In the next section, we put our work in perspective
by providing some background on GPS-less positioning
mechanisms.
2. BACKGROUND AND FOCUS
In general, GPS-less positioning techniques may be clas-
sified as (1) using physical measurements (also known as
range-based positioning) or (2) using topological infor-
mation (also known as range-free positioning). Examples
of measurement-based GPS-less techniques include mech-
anisms that use propagation laws [10] to approximate
Euclidean distance using received signal strength (RSS).
The RSS can be converted into distance either directly,
if the propagation law is uniform and known, or using
multiple signals and time difference of arrival (TDOA) [11].
Then trilateration techniques allow node coordinates to
be inferred. The use of directional antennas to triangulate
positions has also been proposed [12]. One main drawback
of measurement-based mechanisms is that they typically
require specialized equipment or capabilities to perform the
measurements.
Topology information based positioning, on the other
hand, relies solely on topological information. For example,
the approach in [13] first discovers border nodes then com-
putes their relative coordinates and finally infers nonborder
node coordinates relative to border nodes.The correctness
of this algorithm has been analyzed in [14]. Alternatively,
in GPS-free-free [15], JumPS [16], VCap [17], and BVR
[18], the hop distances to reference nodes, or “landmarks,”
are transformed into “virtual coordinates.” The hop distance
from a node to a landmark is given by the minimum number
of hops from that node to the landmark. GPS-free-free
uses trilateration to obtain virtual coordinates from corre-
sponding hop distances, while JumPS, VCap,andBVRuse
the hop distances directly as nodes’ coordinates. Note that the
denser the network, the more accurate it is to approximate
Euclidean distance using hop distance. However, most exist-
ing hop-count-based positioning systems make the strong
assumption that, for better performance (e.g., accuracy),
landmarks need to be placed along the perimeter of the
topology at equal distances from one another. To the best
of our knowledge, this assumption is purely intuitive and
has never been justified either empirically, experimentally, or
analytically.
Thus the focus of this paper is to explore the effect
of landmark placement on the accuracy of the resulting
coordinate system. To our knowledge, our paper is the first
to show analytically that, indeed, placing landmarks on the
boundary of the topology yields more accurate coordinate
systems than when landmarks are placed anywhere in the
interior. Moreover, under some conditions, we show that
uniform landmark deployment on the boundary is optimal.
This is also the first empirical study to consider uniform,
synthetic topologies, as well as nonuniform topologies
resembling more realistic deployments. In our study, we
evaluate different landmark placement strategies, namely:
(1) “uniform boundary placement” as in JumPS [16]and
VCap [17], where landmarks are placed at the boundary
of the topology at equal distances from one another; (2)
“random boundary placement”, where landmarks are placed
on the boundary but at random intervals; and (3) “random
placement,” which places landmarks anywhere in the topol-
ogy completely at random, as in BVR [18]. As performance
metrics, we consider the ability to uniquely identify a node
and how well position-based routing performs over the
resulting coordinate system (when compared against routing
with real coordinates).
In summary, the contributions of this paper revolve
around two main questions: “How does landmark placement
affect the accuracy of the resulting hop-count coordinate
system?” and “Can landmark placement be avoided alto-
gether?” In answering the first question, our simulation
results confirm that placing landmarks on the topology
periphery yields more accurate coordinates. The answer to
the second question is critical when designing self-organizing
networks, since border node selection/placement may be
too expensive or even infeasible in some deployments. Our
results also show that, in general, landmark placement
strategies only have significant performance impact when
the number of landmarks is low. In other words, if enough
landmarks are used,random landmark placement yields
comparative performance to placing landmarks on the
boundary (randomly or equally spaced). We contend that
the work here is a first step towards the development of
reliable and efficient methods for landmark placement in
virtual positioning systems.
The remainder of this paper is organized as follows.
In Section 3, we describe existing hop-count positioning
systems for sensor networks in more detail. Section 4 shows
analytically the eff
ect of landmark placement on the quality
of the resulting coordinate system when uniform topologies
are used. The methodology and simulation results on the
impact of landmark placement considering both uniform
and nonuniform topologies are described in Section 5.
Finally, Section 6 presents our concluding remarks and
identifies directions for future work.
3. HOP-COUNT-BASED POSITIONING SYSTEMS
The use of topological or hop-count-based localization
methods in wireless sensor networks is advantageous because
Farid Benbadis et al. 3
they are simple and do not require additional equipment or
devices. Below, we describe some notable examples of hop-
count-based positioning techniques.
GPS-free-free [15] constructs a two-dimensional coor-
dinate system based on hop-count distances using three
landmarks. Landmarks in GPS-free-free are nodes chosen
from the interior of the topology in such a way that they
form an equilateral triangle. Each landmark broadcasts a
packet in order to allow other nodes to discover their hop-
count distance to it.This packet also contains virtual position
of the landmark. (By definition, in GPS-free-free all the
nodes consider that the x axis is given by the straight line
determined by landmarks 1 and 2, with the convention that
they are, respectively, placed at (0, 0) and (d
2,1
,0),whered
2,1
is the hop distance between landmarks 1 and 2. The third
landmark computes its coordinates as any non-landmark
node, but setting positive the coordinate on the y axis.) Thus
each landmark knows its hop distances to landmarks and
their virtual coordinates. Based on this knowledge, and using
the hop-distance as a metric, each node calculates its virtual
coordinates through trilateration.
VCap [17] is another hop-count positioning algorithm
very similar to GPS-free-free. VCap also uses three land-
marks at equal distances from each other but instead of a
two-dimensional system, VCap builds a three-dimensional
one. In other words, the hop-count distances to the land-
marks are directly used as the three coordinates of a node.
The advantage of VCap when compared to GPS-free-
free is that (1) it requires less computation, since the
trilateration phase is avoided and (2) it provides better
accuracy, since the hop count to the third landmark is
used as a real coordinate. Another difference between GPS-
free-free and VCap is in how they place the landmarks.
While both algorithms form an equilateral triangle with the
landmarks, VCap positions them on the boundary of the
topology, while GPS-free-free places them in the interior.
JumPS [19] is another positioning system based on hop
distances. As VCap, JumPS places landmarks on the border
of the network at equal distances of one another and uses,
as coordinates, hop-count distances to landmarks. JumPS
utilizes, however, up to ten landmarks instead of the three
used in VCap. It has been shown [19] that adding landmarks
increases the accuracy of the resulting coordinate system.
The common point shared by GPS-free-free, VCap,
and JumPS is the assumption that landmarks can be
manually placed at specific locations. For that to happen,
either manual deployment or landmark election mechanisms
are required. Many scenarios make manual deployment
infeasible (e.g., dropping sensors from a plane in hostile,
hard to access regions). In such cases, election algorithms are
required to select border nodes with specific placement.The
fact that these algorithms may be prohibitively expensive (as
they require additional computations and several rounds of
communication among nodes) highlights the importance of
avoiding landmark placement and election, as done in BVR
[18]. However, BVR does not explicitly justify the choice of
random landmark placement as well as the reason for using
larger numbers of landmarks. The results from our work
provide an explanation for these design choices.
Largest intra-zone distance
Largest zone
Zone
Zone size
Intra-zone distance
Indirect connection
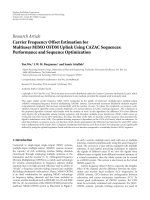
Figure 1: Schematic representation of zones in a network. Zones are
represented by clouds. The distance between any two nodes among
thesamezoneisnotedasintra-zone distance. The largest intra-zone
distance is the zone size, represented with a plain line.
4. THEORETICAL ANALYSIS
In this section, we show that, for uniform topologies, placing
landmarks at the boundary of the topology results in a more
accurate coordinate system. Under some simplifications,
we also show that uniform landmark deployment on the
boundary is optimal. In our analysis, the performance
metrics used are the average zone size and the maximum zone
size. These metrics, which are also used in the simulation
evaluation, are defined below.
Definition 1. A zone is a set of nodes sharing the same virtual
coordinates. The zone size is the largest real distance between
two nodes in the same zone.
Figure 1 illustrates this definition.
Consider an environment of interest Q
⊂ R
2
where n
nodes are uniformly deployed. For simplicity, we take Q
=
B(0,R), the ball of center 0 and radius R. Assume n nodes are
uniformly deployed on Q. Consider N landmarks λ
1
, , λ
N
placed within Q. Here we discuss how the configuration of
the landmarks affects the number of zones corresponding to
the deployment of the nodes.
For each landmark λ
i
∈ Q, the hop distance function
h
i
: Q → N measures the number of hops h
i
(p)fromanode
at p
∈ Q to the landmark λ
i
. Note that this function depends
on the specific network topology. Consider the function h
=
(h
1
, , h
N
):Q → N
N
.Forc ∈ N
N
, {x ∈ Q |h(x) = c}
is the level set of h corresponding to c. Note that the level
sets of h correspond precisely to the zones. In other words,
p
1
, p
2
∈ Q are in the same zone if and only if they belong
to the same level set of h, that is, h
i
(p
1
) = h
i
(p
2
), for all
i
∈{1, , N}.
Let us therefore study the level sets of the individual
hop-distance functions h
i
. Since the nodes are uniformly
4 EURASIP Journal on Advances in Signal Processing
λ
i
•
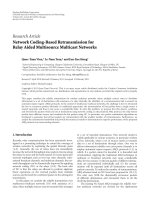
Figure 2: Level sets of the hop-distance function corresponding
to the landmark λ
i
. The shaded area represents a sample level set,
which is the result of the intersection of the environment with an
annulus centered at λ
i
and of radii r
1
, r
2
differing by r.
deployed, we make the simplifying assumption that n is
sufficiently large so that the hop-distance function h
i
can be
approximated by the Euclidean distance between p and λ
i
divided by the communication radius. Specifically, h
i
(p) =
p −λ
i
/r. Under this assumption, the level sets of h
i
are the
intersection of the environment Q with the annuli
B
λ
i
, r
1
, r
2
=
x ∈ R
2
|r
1
≤x − λ≤r
2
,(1)
centered at λ
i
and with radii r
1
, r
2
differing by exactly r (the
communication radius between agents). Figure 2 illustrates
this.
4.1. Optimality of landmark placement
on the boundary
From the previous discussion, it is clear that placing the
landmarks at the boundary of the environment is advanta-
geousforourtwotopologicalmeasures(averagezonesize
and maximum zone size). We formalize this observation in
the following proposition. In the statement, ∂Q denotes the
boundary of Q.
Proposition 1. Consider the hop-distance function h
i
: Q → N
associated to a landmark λ
i
∈ Q.Ifλ
i
∈ ∂Q, then both t he
number of level sets of h
i
and their area are optimized.
Proof. The number m
i
of level sets associated with h
i
is
lower bounded by
R/r (when λ
i
is placed at the center of
the environment) and upper bounded by
2R/r (when λ
i
is placed at the boundary of the environment). Moreover,
for each k
∈{1, , R/r}, the area of the intersection
Q
∩B(λ
i
,(k−1)r, kr) is upper bounded by (2k−1)πr
2
(when
λ
i
is placed at the center of the environment) and lower
bounded by k
2
r
2
arccos(kr/2R)+R
2
arccos(1 − k
2
r
2
/2R
2
) −
krR
√
1 −k
2
r
2
/4R
2
− (k − 1)
2
r
2
arccos((k − 1)r/2R) −
R
2
arccos(1−(k−1)
2
r
2
/2R
2
)+(k−1)rR
1 − (k −1)
2
r
2
/4R
2
(when λ
i
is placed at the boundary of the environment).
Finally, note that, as one moves the location of λ
i
from
the center of the environment to the boundary along a
straight line, the areas of the level sets corresponding to
k
∈{1, , R/r} are monotonically nonincreasing. This
lost area goes to the level sets corresponding to k
∈{R/r+
1, ,
2R/r}, which appear successively as λ
i
approaches
the boundary.
Note that the number of nodes contained in each level
set is proportional to the area of the level set.Therefore, the
smaller the area, the fewer the number of nodes with the
same hop coordinate with respect to λ
i
, which in turn makes
the zone size smaller. Regarding average zone area, since the
sum of the areas of the zones is equal to the area of the
environment, we deduce
Average zone area
=
πR
2
m
,(2)
where m is the number of zones corresponding to the
landmark placement λ
1
, , λ
N
. These results lead us to
conjecture that the uniform landmark placement on ∂Q is
optimal for the average zone size, because it maximizes the
number of intersection between the annuli of the various
landmarks, and therefore, maximizes the number of zones.
4.2. Optimality of uniform landmark placement
for maximum zone size
Next we examine the optimality of the uniform landmark
placement on the boundary of the environment with regards
to the maximum zone size measure. We start by introducing
some basic notation.
4.2.1. Geodesic distance on the circle
Without loss of generality, we take R
= 1 (the arguments
below can be carried out analogously for arbitrary R). Let
S
1
denote the circle of radius 1. Normally, we refer to points in
S
1
using angle notation, θ ∈ [0, 2π). Alternatively, one could
use Euclidean coordinates (x, y)
∈ R
2
,withx
2
+ y
2
= 1. Both
systems of coordinates are related by
(x, y)
= (cos θ,sinθ), θ = arctan
y
x
. (3)
Given two points θ
1
, θ
2
∈ S
1
, let dist
g
(θ
1
, θ
2
) be the
geodesic distance between θ
1
and θ
2
defined by dist
g
(θ
1
, θ
2
) =
min{dist
c
(θ
1
, θ
2
), dist
cc
(θ
1
, θ
2
)},where
dist
c
θ
1
, θ
2
=
θ
1
−θ
2
(mod 2π),
dist
cc
θ
1
, θ
2
=
θ
2
−θ
1
(mod 2π),
(4)
are the path lengths from θ
1
to θ
2
traveling clockwise
and counterclockwise, respectively. Here θ (mod2π) is the
remainder of the division of θ by 2π. Given two points in
S
1
, the relationship between their Euclidean and geodesic
distances is given by
dist
g
θ
1
, θ
2
=
2 arcsin
x
1
, y
1
−
x
2
, y
2
2
. (5)
Farid Benbadis et al. 5
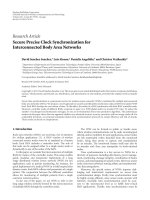
r
λ
i
λ
j
Figure 3: Sample plot of the zones on ∂Q determined by
an arbitrary placement of three landmarks (under the geodesic
distance). Note that the zones appear periodically.
4.2.2. Rephrasing the “minimize-maximum-zone-size”
optimization problem
In our forthcoming discussion, we make two important
simplifications: (i) we restrict our attention to the boundary
of Q and consider the intersection of the zones with ∂Q,
instead of considering the zones in the full environment Q,
and (ii) we consider the geodesic distance on ∂Q, rather than
the Euclidean one. To emphasize the latter fact, we denote
by B
g
(λ, r) the ball in ∂Q centered at θ with radius r with
the geodesic distance. Two reasons justify (ii). On the one
hand, from (5), one can see that this approximation is quite
accurate on ∂Q for points that are up to an Euclidean distance
R
= 1. On the other hand, (ii) is reasonable when considering
the problem of minimizing the maximum zone size in ∂Q
with uniform landmark deployments. This is so because,
given i
∈{1, , N}, any point in ∂Q that is more than an
Euclidean distance R
= 1apartfromλ
i
must be less than an
Euclidean distance R
= 1 apart from some other λ
j
,where
the approximation of the Euclidean distance by the geodesic
distance is accurate.
Note that the zones on ∂Q correspond to the level sets
of h
|∂Q
: ∂Q → N
N
. Each of these zones is an arc segment
whose boundary points correspond to some landmark; see
Figure 3. Therefore, for each landmark λ
i
∈ ∂Q, consider
the intersection points between ∂Q and the boundary of
the balls B
g
(λ
i
, kr)withk ∈{1, , 2R/r}. Note that any
two consecutive intersection points are exactly at a geodesic
distance r from each other.
This implies that the zones appear periodically at inter-
vals of length r along ∂Q. Thus, in order to study the zone
size, we identify points that are exactly r-apart, that is, we
define the equivalence relationship
∼ by
θ
1
∼θ
2
iff dist
g
θ
1
, θ
2
= r. (6)
Thesetofallpointsin∂Q that are equivalent under
∼
is called an equivalence class. The quotient space ∂Q/∼ is
the collection of all equivalence classes. To obtain a simple
representation of ∂Q/
∼, assume for simplicity that 2πR/r ∈
N
, and fix any point O ∈ ∂Q as a reference. Then we have
∂Q
∼
≡ S
1
. (7)
In this context, an element of ∂Q/
∼ corresponds to all the
points in ∂Q whose geodesic distance is a multiple of r.Under
this identification, for each i
∈{1, , N}, the landmark
λ
i
∈ ∂Q and all the intersection points ∂Q ∩ ∂B
g
(λ
i
, kr),
k
∈{1, , 2R/r}, get mapped to the same point in S
1
.
Also under this identification, the zones in ∂Q correspond
to the segments between two landmark locations in
S
1
.Asa
consequence, the problem of minimizing the maximum zone
size in ∂Q, translated into
S
1
, becomes the disk-covering
optimization problem discussed in Section 4.2.3.
4.2.3. Disk-covering optimization problem
Given N points θ
1
, , θ
N
in S
1
, consider the following disk-
covering optimization problem.
For any θ in
S
1
,letmin
i∈{1, ,N}
dist
g
(θ, θ
i
) be the
minimum distance of θ to the set of locations
{θ
1
, , θ
N
}. We refer to this distance as the coverage of
θ provided by θ
1
, , θ
N
. Larger values correspond to
worse coverage. Consider the worst possible coverage
provided by θ
1
, , θ
N
at a point of S
1
, that is,
H
θ
1
, , θ
N
=
max
θ∈S
1
min
i∈{1, ,N}
dist
g
θ, θ
i
. (8)
We are interested in finding the minimizers of H.
Interestingly, the function H can be rewritten using the
notion of Voronoi partition. The Voronoi partition of
S
1
generated by θ
1
, , θ
N
is the collection of sets V
i
, , V
N
defined by
V
i
=
θ ∈ S
1
|dist
g
θ, θ
i
≤
dist
g
θ, θ
j
for j
/
= i
. (9)
In other words, V
i
is the set of points that are closer to
θ
i
than to any of the other locations θ
j
, j
/
= i.Inour
case, V
i
is a segment centered at θ
i
, with boundary points
determined by the mid points with its immediate clockwise
and counterclockwise neighbors. Figure 4 illustrates this
notion. Note that
H
θ
1
, , θ
N
=
max
i∈{1, ,N}
max
θ∈V
i
dist
g
θ, θ
i
. (10)
We are now ready to prove the following result.
Proposition 2. Any uniform deployment of N points on
S
1
is
a global minimizer of H .
Proof. Since H is invariant under permutations, we assume
without loss of generality that the locations θ
1
, , θ
N
are ordered in counterclockwise order in increasing order
according to their index. Let (θ
∗
1
, , θ
∗
N
) be a uniform
deployment on
S
1
, that is, dist
g
(θ
∗
i
, θ
∗
i+1
) = 2π/N,
where we define for convenience θ
∗
N+1
= θ
∗
1
. Note that
H (θ
∗
1
, , θ
∗
N
) = π/N. Now the result follows from noting
that for any nonuniform configuration (θ
1
, , θ
N
), there
6 EURASIP Journal on Advances in Signal Processing
V
i
θ
i
θ
j
Figure 4: Voronoi partition of S
1
generated by θ
1
, , θ
N
.
must exist i ∈{1, , N} such that dist
g
(θ
i
, θ
i+1
) >
2π/N, and hence max
θ∈V
i
dist
g
(θ, θ
i
) >π/N. Consequently,
H (θ
1
, , θ
N
) >π/N= H (θ
∗
1
, , θ
∗
N
).
Recall the equivalence between the disk-covering opti-
mization problem and the problem of minimizing the
maximum zone size in ∂Q discussed in Section 4.2.2.In
particular, note that the size of each segment (which is
the image of a zone under the identification (7)) is twice
the distance from the boundary point of the corresponding
Voronoi cell to each of its generators. Given Proposition 2,we
conclude that the uniform landmark deployment is optimal
with regards to maximum zone size.
5. SIMULATION ANALYSIS
For the simulation experiments, we have written our own
simulator since existing network simulators work at the
packet level and are too fine-grained for our purpose.
Indeed, the simulator we conceived only places nodes
according to the distributions described in Section 5.1,
determines hop distances to landmarks by successive neigh-
borhood discoveries and uses them as coordinates and
discovers paths, based on the hop-count coordinate system,
between randomly selected sources and destinations.
For simplicity, we simulated a perfect MAC layer, which
means that (1) two nodes are neighbors if the distance
between them is less than r, the radio coverage range
described in Section 5.1, and (2) there is no packet loss
during transmissions. Even though assuming a perfect MAC
layer is not realistic, we claim it does not affect our
comparative analysis, as all the strategies studied were subject
to the same conditions.
As previously pointed out, unlike previous studies
which only considered uniform network topologies, that
is, topologies where nodes are placed uniformly over the
field, we also consider topologies with nonuniform node
placement. Such topologies are motivated by more realistic
scenarios such as campuses (e.g., universities) where nodes
(users) tend to gather around access points. Our simulation
experiments employing uniform topologies also validate our
theoretical analysis. We use JumPS [19] as the hop-count-
based positioning system.
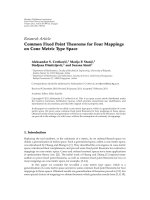
Figure 5: This figure represents a 4-landmark circular topology.
Triangles, squares, and circles, respectively, represent the UniBound,
RandBound,andRand landmark placement strategies.
5.1. Parameters
The environment considered is a circle of radius 1000 meters,
and the radio coverage range r of the nodes is 60 meters. We
assume that nodes are homogeneous, that is, they all have
the same capabilities, and that neighborhood discovery is
provided by the MAC layer.
5.1.1. Number of landmarks
The simulated number of landmarks ranges from 3 to 10.
Thus we can evaluate the performance of both JumPS [19]
and VCap [17].
5.1.2. Landmark placement
The different landmark placement strategies are outlined
below and illustrated in Figure 5.
(i) UniBound places landmarks on the boundary of the
topology, at equal distances from each other. One
possible landmark election algorithm to be used in a
scenario where manual placement is not possible is
described in VCap [17].
(ii) In RandBound, landmarks are randomly placed on the
boundary of the topology.
(iii) Rand randomly places landmarks anywhere in the
topology. Their location might be on the boundary or
inside the disc area. In order to select N landmarks
according to this strategy, techniques such as random
selection, or choosing N nodes with the highest/lowest
IDs can be employed. This strategy is used in the BVR
algorithm [18].
These sample landmark selection mechanisms make
it clear that UniBound is by far the most complex and
costly, followed by RandBound. Rand is the simplest and
least expensive. This means that doing away (completely or
partially) with sensor selection can save significant network
resources.
Recall that any node in the topology can be considered
a landmark, that is, no special capability is required to
play this role. In our simulations, nodes are designated as
Farid Benbadis et al. 7
(a) Uniform (b) 200 concentration
points
(c) 40 concentration
points
Figure 6: Representation of a 4.000 nodes topology with three
different node distributions. Only the first one is uniform.
landmarks depending on the specific landmark placement
strategy employed.
5.1.3. Number of nodes
The overall number of nodes, including landmarks, changes
from 1000 to 5000, in steps of 2000. Note that considering
different number of nodes in a fixed environment and with
a constant radio coverage range is equivalent to considering
scenarios where the size of the environment and the radio
coverage changes, but the number of nodes is held constant.
5.1.4. Node distribution
As previously pointed out and depicted in Figure 6,two
kinds of topologies are considered.
(i) Uniform topologies (Figure 6(a)). Nodes are uniformly
distributed over the field.
(ii) Nonuniform topologies (Figures 6(b) and 6(c)). Nodes
are placed around “concentration points” according to
a normal distribution. The number of concentration
points ranges from 1% to 20% of the total number
of nodes. The greater number of concentration points,
the more uniform the topology.
We should point out that, unlike the studies conducted in
VCap and JumPS, we also consider the case of disconnected
networks. This means that nodes with no direct neighbors
may exist. Such nodes can obtain coordinates from a subset
of landmarks only or do not obtain any coordinate at
all.
For every scenario (i.e., combination of node distribu-
tion, number of landmarks, number of nodes, and landmark
placement strategy),we execute 50 runs.
5.2. Performance metrics
5.2.1. Zones
In order to evaluate the accuracy of a localization algo-
rithm, researchers usually measure the distance error, which
represents the Euclidean distance between the real position
and the computed one. Such a measurement requires that
both positions—real and virtual—are correlated. Note that
the coordinates assigned to sensor nodes by JumPS [19]
and VCap [17] do not express their geographical positions.
Therefore, we cannot use the distance error to evaluate the
accuracy of these localization systems.
Thus similarly to VCap,mostofourperformance
metrics are based on the concept of zones. As described in
Section 4, a zone is the set of nodes sharing the same virtual
coordinates. The zone size is thus the maximum Euclidean
distance, measured using real coordinates, between two
nodes within the same zone. Thus, it provides a measure
of the coordinate system’s ambiguity. In other words, the
smaller the zone size, the more accurate the coordinates. A
succinct pictorial description of zones is given in Figure 1.
In this paper, we consider three zone-related metrics.
First, we evaluate, the average zone size for each scenario.
Then, we measure the maximumzonesize, that is, the largest
zone in a scenario. Note that if the maximum zone size is
smaller than the node’s radio range, nodes sharing the same
coordinates are physically neighbors and thus communicate
directly. Finally, we count the number of nodes per zone.The
lower this number, the more accurate the coordinate system.
Ideally, we obtain one node per zone, which means that no
coordinate ambiguity exists.
5.2.2. Route computation
Another important criterion we use in our experimental
evaluation is how well route discovery performs over the
resulting virtual coordinate system when compared to
using real coordinates. To evaluate routing performance, we
consider the rate of successful route discovery. We ran our
routing experiments as follows. For every simulation run, we
picked 1000 random source-destination pairs and performed
simple greedy route computation. In other words, the next
hop decision is solely based on the positions of the node
and its neighbors and tries to select as next hop the closest
neighbor to destination. It cannot, however, guarantee route
discovery due to local minima situations where no neighbor
is closer to the destination than the node where the route
ends. In such a situation, the route computation procedure
is considered as failed.
5.3. Results
In this section, we present results from our simulation
experiments. Every data point is obtained as the average
over fifty simulation runs. (Because the confidence interval
is negligible, compared to the average value, we do not
represent it on these figures.) The reader is referred to [20]
for all our simulation results.
5.3.1. Average zone size
Figure 7 shows the average zone size as a function of number
of landmarks for the different strategies. We can observe
that the shape of the curves is similar irrespective of the
strategy, showing that as the number of landmarks increases,
the benefits of placing landmarks at the boundary of the
topology (equally spaced or randomly) decrease. For this
particular experiment, for example, while there are clear
8 EURASIP Journal on Advances in Signal Processing
2
1
0
2% concentration
points
345678910
2
1
0
34 5 678910
2
1
0
34 56 78910
2
1
0
5% concentration
points
345678910
2
1
0
34 5 678910
2
1
0
34 56 78910
2
1
0
10% concentration
points
345678910
2
1
0
34 5 678910
2
1
0
34 56 78910
Unibound
Randbound
Rand
Unibound
Randbound
Rand
Unibound
Randbound
Rand
1000 nodes 3000 nodes 5000 nodes
(a) Nonuniform topologies
2
1
0
345678910
2
1
0
34 5678910
2
1
0
345 678910
Unibound
Randbound
Rand
Unibound
Randbound
Rand
Unibound
Randbound
Rand
1000 nodes 3000 nodes 5000 nodes
(b) Uniform topologies
Figure 7: Average zone size in radio range units (y axis) as a function of number of landmarks (x axis) for different landmark placement
strategies.
performance differences between the three strategies for
five or less landmarks, the average zone size does not
change significantly when seven or more landmarks are used
even under different placement strategies. This observation
remains valid for both uniform and nonuniform topologies.
Note that the only exception appears in the case of the
topology with 1000 nodes using only 2% of concentration
points. This is due to the fact that the topology is very sparse
and nodes may not be connected to all the landmarks in all
the simulations.
5.3.2. Maximum zone size
VCap [17] proposes the combination of position-based and
proactive routing. Indeed, VCap generates zones with size of
up to two radio ranges. Therefore, a packet can reach a node
2-hops distant from the intended destination. Adding 2-hop
neighborhood knowledge is then required so that, when a
node receives a message intended to another node with the
same virtual coordinates, it uses proactive routing within the
2-hop neighborhood to forward the packet to its intended
destination. Thus the maximum zone size is an important
metric, since it determines what kind (and how expensive)
of proactive forwarding method must be used in addition to
the position-based one.
In Figure 8, we show the maximum zone size (in radio
coverage units) as a function of the number of landmarks
and their placement strategies. We observe that, confirming
our theoretical analysis, placing landmarks on the boundary
results in smaller maximum zones, independent of the num-
ber of landmarks, number of nodes, or node distribution.
For instance, lower numbers of landmarks randomly placed
generate zones of up to ten radio range units. This requires a
10-hop proactive routing protocol, which will be extremely
expensive in terms of overhead. As before, the difference
between landmark placement strategies, however, becomes
less significant when topologies are more uniform and the
number of landmarks increases.
Farid Benbadis et al. 9
12
8
4
0
2% concentration
points
345678910
12
8
4
0
345678910
12
8
4
0
345678910
12
8
4
0
5% concentration
points
345678910
12
8
4
0
34 5 67 8910
12
8
4
0
345678910
12
8
4
0
10% concentration
points
345678910
12
8
4
0
34 5 67 8 910
12
8
4
0
345678910
Unibound
Randbound
Rand
Unibound
Randbound
Rand
Unibound
Randbound
Rand
1000 nodes 3000 nodes 5000 nodes
(a) Nonuniform topologies
10
8
6
4
2
0
345678910
10
8
6
4
2
0
34 5678910
10
8
6
4
2
0
345 678910
Unibound
Randbound
Rand
Unibound
Randbound
Rand
Unibound
Randbound
Rand
1000 nodes 3000 nodes 5000 nodes
(b) Uniform topologies
Figure 8:Maximumzonesize(y axis) in radio range units as a function of number of landmarks (x axis) for different scenarios.
We should point out that the results reported in Figure 8
are different than the results presented in JumPS [19]. The
reason for this difference is that, as noted earlier, here we also
consider disconnected networks. In JumPS, before obtaining
a coordinate, a node considers itself positioned
∞ hops from
the respective landmark. Consider two nodes placed far from
each other with no direct neighbors, in a three landmarks
coordinate system. These two nodes are not connected to
any landmark, thus do not obtain any coordinates. Both will
have (
∞, ∞, ∞) as virtual coordinates. In our simulations,
we consider those nodes as belonging to the same zone.
The distance between them is then taken into account to
measure the average and maximum zone sizes. Note that
these measurements would be reduced if such nodes were not
considered.
5.3.3. Number of nodes per zone
A single zone for the whole topology is the worst possible
case one can obtain—it means that all nodes have the same
coordinates. On the other hand, the ideal case is when there
are as many zones as nodes. Thus the lower the number of
nodes per zone, the more accurate the coordinate system.
We show in Figure 9 the average number of nodes per
zone. We observe that the difference between the strategies
becomes less important when the number of landmarks in-
creases. This agrees with the trend shown by Figures 7 and 8.
5.3.4. Route computation
Figure 10 shows that different landmark placement strategies
have significant impact on routing performance. We observe
that placing landmarks on the boundary yields the best
results, especially when they are at equal distances from one
another.
This behavior is closely related to the number of nodes
per zone represented in Figure 9. Indeed, when a node
receives a packet to forward, it chooses, depending on the
virtual coordinates, which neighbor is the more appropriate
to be the next hop. If two nodes or more share the same
10 EURASIP Journal on Advances in Signal Processing
16
12
8
4
0
2% concentration
points
34 56 7 8 910
16
12
8
4
0
345678910
16
12
8
4
0
34 56 78910
16
12
8
4
0
5% concentration
points
34 5678910
16
12
8
4
0
34 567 8910
16
12
8
4
0
34 5 6 7 8 910
16
12
8
4
0
10% concentration
points
34 567 8910
16
12
8
4
0
34 5678910
16
12
8
4
0
345678910
Unibound
Randbound
Rand
Unibound
Randbound
Rand
Unibound
Randbound
Rand
1000 nodes 3000 nodes 5000 nodes
(a) Nonuniform topologies
16
12
8
4
0
34 56 78 910
16
12
8
4
0
345678910
16
12
8
4
0
34567 8910
Unibound
Randbound
Rand
Unibound
Randbound
Rand
Unibound
Randbound
Rand
1000 nodes 3000 nodes 5000 nodes
(b) Uniform topologies
Figure 9: Average number of nodes per zone (y axis), as a function of number of landmarks (x axis).
coordinates, the forwarding node chooses one of them
randomly. If the average number of nodes among a zone is
high, then the probability of choosing the right next hop
is lower. Thus routing is more efficient in scenarios where
the average number of nodes sharing the same coordinates is
lower.
Routing over coordinates obtained using UniBound or
RandBound landmark placement, however, leads to similar
performance when compared to routing over real coordi-
nates, provided that sufficient landmarks are employed. This
is an important observation as it shows that RandBound,
that is, placing landmarks (randomly) on the periphery, is
enough to achieve adequate routing performance, avoiding
the need of equally distant landmark placement.
We also notice again that as the number of landmarks
increases up to a certain threshold, considerable performance
gains are achieved.However, beyond the threshold, the gains
are not very significant. For the scenarios we ran, seven
landmarks seem to be the threshold for achieving adequate
packet delivery.
5.4. Discussion
In this section, we highlight the insights provided by our
experimental study on how landmark placement affects
the performance of topology-based self-localization sys-
tems.
First, the experimental results we obtained verify our
mathematical analysis and show that, indeed, placing the
landmarks on the topology boundary, according to the
UniBound or RandBound strategies improves the perfor-
mance of the coordinate system when compared to Rand.
However, our simulation study provides us with insight on
the performance trends for different types of topologies,
at different scales and node densities. For instance, we
confirm the results obtained in JumPS [16], showing that
increasing the number of landmarks increases the accuracy
of the underlying coordinate system. However, we go beyond
that result and show that, if enough landmarks are used,
random landmark placement yields comparative accuracy
to place landmarks on the topology boundary (equally
Farid Benbadis et al. 11
100
50
0
2% concentration
points
345678910
100
50
0
34 5 678910
100
50
0
34 56 78910
100
50
0
5% concentration
points
345678910
100
50
0
34 5 678910
100
50
0
34 56 78910
100
50
0
10% concentration
points
345678910
100
50
0
34 5 678910
100
50
0
34 56 78910
Unibound
Randbound
Rand
Real
Unibound
Randbound
Rand
Real
Unibound
Randbound
Rand
Real
1000 nodes 3000 nodes 5000 nodes
(a) Nonuniform topologies
100
50
0
34 5678910
100
50
0
34 5678910
100
50
0
34 5 6 78910
Unibound
Randbound
Rand
Real
Unibound
Randbound
Rand
Real
Unibound
Randbound
Rand
Real
1000 nodes 3000 nodes 5000 nodes
(b) Uniform topologies
Figure 10: Route computation success rate (y axis) as a function of number of landmarks (x axis). Here we observe that the landmark
placement strategy used is not negligible but becomes less important as the number of landmarks increases.
spaced or randomly). This is an important result for energy-
constrained network designers, planners, and providers,
since boundary placement can be prohibitively resource
consuming.
We also evaluate the performance of routing over the
resulting topology-based positioning system against routing
using real coordinates and show a similar trend, that is,
that the benefits of boundary placement decreases as the
number of landmark increases. We should point out that,
except for sparse topologies where a large number of nodes
are disconnected, these trends hold for both uniform—and
nonuniform topologies.
Another interesting, but not surprising result, is the
“diminishing returns” behavior we observed in all our exper-
iments. In other words, our results show that as the number
of landmarks increases up to a certain threshold more
significant performance improvements can be observed.
However, beyond that point, the curve “flattens out,” that is,
the gains of adding more landmarks decrease as the number
of landmarks increases. As part of future work, we plan to
analyze this behavior analytically.
6. CONCLUSION
In this paper, we have tackled the problem of landmark
placement for hop-count-based positioning systems. While
previous studies choose as landmarks nodes consistently dis-
tributed on the boundary of the topology, we show here that
such a criterion does not necessarily yield sufficient perfor-
mance benefits that warrant its cost. Our mathematical anal-
ysis, confirmed by our simulation results, shows that, indeed,
placing landmarks on the topology boundary increases the
accuracy of the resulting coordinate system. Furthermore,
under some conditions, we also show that uniform landmark
placement is optimal. However, extensive simulations using
different types of topologies with varying node densities
and number of landmarks show that these performance
benefits (including packet delivery ratio achieved by greedy
routing) decrease as the number of landmarks increases.
This means that if enough landmarks are deployed, random
landmark placement, which is considerably less resource
consuming, yields comparative performance to boundary
placement. We also show that, after a certain threshold,
12 EURASIP Journal on Advances in Signal Processing
additional landmarks provide increasingly less performance
gains.
As directions for future work, we plan to prove the
optimality of uniform boundary placement under general
conditions, including nonuniform topologies. We also plan
to investigate the explicit characterization of the threshold
beyond which random and uniform deployments have
comparable performances and to formally analyze the
“diminishing returns” performance trend observed in the
simulations. Additionally, with the insight gained in this
work, we plan to propose mechanisms that dynamically
determine the number of landmarks needed to obtain the
most accurate coordinate system. These mechanisms should
also be able to identify, given a certain node distribution, the
optimal landmark locations. As a final direction for future
work, we envisage to investigate the probabilistic expected
behavior of the various landmark placement strategies.
ACKNOWLEDGMENTS
This material is based upon work supported in part by NSF
CAREER Award ECS-0546871.
REFERENCES
[1] I. F. Akyildiz, W. Su, Y. Sankarasubramaniam, and E. Cayirci,
“A survey on sensor networks,” IEEE Communications Maga-
zine, vol. 40, no. 8, pp. 102–114, 2002.
[2] M. D. de Amorim, M. L. Sichitiu, F. Benbadis, Y. Viniotis,
and S. Fdida, “Dissecting the routing architecture of self-
organizing networks,” IEEE Wireless Communications, vol. 13,
no. 6, pp. 98–104, 2006.
[3] M. D. de Amorim, F. Benbadis, M. L. Sichitiu, A. C. Viana, and
Y. Viniotis, “Routing in Wireless Self-Organizing Networks,”
Taylor and Francis Group, LLC, to appear.
[4] M. Mauve, J. Widmer, and H. Hartenstein, “A survey on
position-based routing in mobile ad hoc networks,” IEEE
Network, vol. 15, no. 6, pp. 30–39, 2001.
[5] S. Giordano, I. Stojmenovic, and L. Blazevie, “Position based
routing algorithms for ad hoc networks: a taxonomy,” 2001,
/>∼ivan/routing-survey.pdf.
[6] B. Hofmann-Wellenhof, H. Lichtenegger, and J. Collins,
Global Positioning System: Theory and Practice, Springer, New
York, NY, USA, 4th edition, 1997.
[7] “Glonass,” />[8] CNES, ESA, “The galileo project”, />ESOC/SEM38HVH48F
0.html.
[9] J. Aspnes, T. Eren, D. K. Goldenberg, et al., “A theory of net-
work localization,” IEEE Transactions on Mobile Computing,
vol. 5, no. 12, pp. 1663–1678, 2006.
[10] A. Goldsmith, Wireless Communications, Cambridge Univer-
sity Press, New York, NY, USA, 2005.
[11] F. Gustafsson and F. Gunnarsson, “Positioning using time-
difference of arrival measurements,” in Proceedings of the
IEEE International Conference on Acoustics, Speech and Signal
Processing (ICASSP ’03), vol. 6, pp. 553–556, Hong Kong, April
2003.
[12] D. Niculescu and B. Nath, “Ad hoc positioning system (APS)
using AOA,” in Proceedings of the 22nd Annual Joint Conference
on the IEEE Computer and Communications Societies (INFO-
COM ’03) , vol. 3, pp. 1734–1743, San Francisco, Calif, USA,
March-April 2003.
[13] A. Rao, S. Ratnasamy, C. Papadimitriou, S. Shenker, and I.
Stoica, “Geographic routing without location information,”
in Proceedings of the 9th Annual International Conference on
Mobile Computing and Networking (MobiCom ’03), pp. 96–
108, San Diego, Calif, USA, September 2003.
[14] A. Jadbabaie, “On geographic routing without location infor-
mation,” in Proceedings of the 43rd IEEE Conference on Decision
and Control (CDC ’04), vol. 5, pp. 4764–4769, Paradise Islands,
Bahamas, December 2004.
[15] F. Benbadis, T. Friedman, M. D. de Amorim, and S. Fdida,
“GPS-free-free positioning system for wireless sensor net-
works,” in Proceedings of the 2nd IFIP International Con-
ference on Wireless and Optical Communications Networks
(WOCN ’05), pp. 541–545, Dubai, UAE, March 2005.
[16] F. Benbadis, J J. Puig, T. Friedman, M. D. de Amorim, D.
Symplot-Ryl, and S. Fdida, “JuMPS: enhancing hop-count
positioning in sensor networks using multiple coordinates,” to
appear in Ad Hoc and Sensor Wireless Networks Journal.
[17] A. Caruso, S. Chessa, S. De, and A. Urpi, “GPS free coordinate
assignment and routing in wireless sensor networks,” in
Proceedings of the 24th Annual Joint Conference of the IEEE
Computer and Communications Societies (INFOCOM ’05),
vol. 1, pp. 150–160, Miami, Fla, USA, March 2005.
[18] R. Fonseca, S. Ratnasamy, D. Culler, S. Shenker, and I. Stoica,
“Beacon vector routing: scalable point-to-point in wireless
sensornets,” in Proceedings of the 2nd Symposium on Networked
Systems Design and Implementation (NSDI ’05), Boston, Mass,
USA, May 2005.
[19] F. Benbadis, J J. Puig, T. Friedman, M. D. de Amorim, D.
Symplot-Ryl, and S. Fdida, “JuMPS: enhancing hop-count
positioning in sensor networks using multiple coordinates,”
Tech. Rep. RP-LIP6-2006-04-39, Laboratoire d’informatique
de Paris 6, Paris, France, 2006, />∼benbadis/
jumps/.
[20] F. Benbadis, K. Obraczka, J. Cort
´
es, and A. Brandwajn,
“Exploring landmark placement strategies for self localization
in wireless sensor networks,” 2006, />∼benba-
dis/landmarks
placement/.