Báo cáo hóa học: " Preparation of Ultrafine Fe–Pt Alloy and Au Nanoparticle Colloids by KrF Excimer Laser Solution Photolysis" docx
Bạn đang xem bản rút gọn của tài liệu. Xem và tải ngay bản đầy đủ của tài liệu tại đây (675.7 KB, 9 trang )
NANO EXPRESS
Preparation of Ultrafine Fe–Pt Alloy and Au Nanoparticle
Colloids by KrF Excimer Laser Solution Photolysis
Masato Watanabe Æ Hitoshi Takamura Æ
Hiroshi Sugai
Received: 25 December 2008 / Accepted: 19 February 2009 / Published online: 10 March 2009
Ó to the authors 2009
Abstract We prepared ultrafine Fe–Pt alloy nanoparticle
colloids by UV laser solution photolysis (KrF excimer laser
of 248 nm wavelength) using precursors of methanol
solutions into which iron and platinum complexes were
dissolved together with PVP dispersant to prevent aggre-
gations. From TEM observations, the Fe–Pt nanoparticles
were found to be composed of disordered FCC A1 phase
with average diameters of 0.5–3 nm regardless of the
preparation conditions. Higher iron compositions of nano-
particles require irradiations of higher laser pulse energies
typically more than 350 mJ, which is considered to be due
to the difficulty in dissociation of Fe(III) acetylacetonate
compared with Pt(II) acetylacetonate. Au colloid prepara-
tion by the same method was also attempted, resulting in
Au nanoparticle colloids with over 10 times larger diam-
eters than the Fe–Pt nanoparticles and UV–visible
absorption peaks around 530 nm that originate from the
surface plasmon resonance. Differences between the Fe–Pt
and Au nanoparticles prepared by the KrF excimer laser
solution photolysis are also discussed.
Keywords Nanoparticle Á Excimer laser Á
Laser solution photolysis Á Precursor Á Fe–Pt alloy Á
Au
Introduction
Recently, nanomaterials have been researched due to their
diverse application potentials. Particular attention has
focused on nanoparticles of Fe–Pt alloys because, they
demonstrate potentials for ultra-high density recording
media [1] of which materials require a high magnetocrys-
talline anisotropy for thermal stability of magnetization,
biomedical applications [2, 3] of which materials require
chemical stability and biocompatibility, catalysts for fuel
cells with high poisoning resistance [4], and other magnetic
application potentials [5]. Besides the preparation method
for well-defined self assembly of Fe–Pt nanoparticles [6],
precise deposition control of nanoparticles employing
Langmuir–Blodgett method has also been reported [7, 8].
Processes for nanoparticle production by light irradia-
tions, which are clean, one-step processes different from
conventional physical or chemical ones, have been pro-
posed [9–17]. Syntheses of gold nanoparticles by UV light
irradiation to gold chloride solutions, referred to as ‘‘pho-
tolysis’’, have long been known [9] and ‘‘laser photolysis’’
using UV laser light has also been applied for syntheses of
gold nanoparticles [10, 11] and iron based nanoparticles
from ferrocene and iron(II) acetylacetonate that are UV-
absorbing complexes [12, 13]. In addition to photolysis,
laser using processes under other generation principles
such as ‘‘laser pyrolysis’’ based on thermal decomposition
of gas phase sources by far-infrared laser irradiation
[14, 15] and ‘‘laser ablation in liquid phase’’ based on laser
ablation phenomena in solutions resulted in monodisperse
nanoparticles of target materials submerged in solutions
[16, 17], has also been reported.
In the present study, we prepared ultrafine Fe–Pt alloy
nanoparticles of 0.5–3 nm diameters dispersed in methanol
solvent by KrF excimer laser solution photolysis for the
M. Watanabe (&) Á H. Takamura
Graduate School of Engineering, Tohoku University, 301-2-2,
6-6-11, Aza-Aoba Aramaki, Aoba-ku, Sendai 980-8579, Japan
e-mail:
M. Watanabe Á H. Sugai
3R Corporation, 5F, 4-10-3 Chuo, Aoba-ku, Sendai 980-0021,
Japan
123
Nanoscale Res Lett (2009) 4:565–573
DOI 10.1007/s11671-009-9281-2
first time, employing precursors of methanol solutions into
which iron and platinum complexes were dissolved toge-
ther with polymer dispersant of polyvinylpyrrolidone, PVP.
Au nanoparticles with diverse application potentials [18]
were also prepared using the same preparation technique.
The differences between the results of Au and Fe–Pt
nanoparticle colloids by this method are discussed in this
article.
Experimental
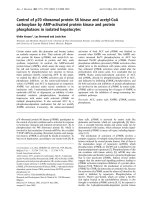
The employed experimental set up for KrF excimer laser
irradiation to solutions is schematically shown in Fig. 1.
UV sample irradiation was carried out using a KrF excimer
pulsed laser generation system (COMPex205, Lambda
Physik, k = 248 nm). The emitted laser lights were intro-
duced to the surface of precursor solution filled in a
100 mL-sized beaker from the top of the beaker by passing
through a mirror. The laser conditions of power, pulse
energy, and pulse frequency were varied in the range of
0.32–31.5 W, 160–630 mJ, 2–50 Hz, respectively. The
irradiation time was fixed to 30 min. The laser beam is
rectangular-shaped with a size of 2.4 9 0.9 cm (2.16 cm
2
)
and a pulse duration of 25 ns.
Precursor solutions for Fe–Pt were methanol (CH
3
OH,
Wako 99.8?% dehydrated) solutions in which iron(III) ace-
tylacetonate (Fe(III)(C
5
H
7
O
2
)
3
, Aldrich 99.9?%), denoted
by Fe(III)(acac)
3
, and platinum(II) acetylacetonate (Pt(II)
(C
5
H
7
O
2
)
2
, Aldrich 97%), denoted by Pt(II)(acac)
2
were
completely dissolved. Polyvinylpyrrolidone ((C
6
H
9
NO)
n
,
Aldrich average molecular weight *10,000), denoted by
PVP, was dissolved in all cases to prevent aggregation.
Concentrations for Fe(III)(acac)
3
, Pt(II)(acac)
2
,andPVP
were varied while keeping constant the sum of both metal
complex concentrations and PVP ones to 3 mM and 6 mM,
respectively. The combination of ferrocene (Fe(II)(C
5
H
5
)
2
,
Aldrich 98%), denoted by Fe(II)Cp
2
, and Pt(II)(acac)
2
has
also been investigated while keeping constant the sum of both
metal complex concentrations and PVP ones to 10 mM and
50 mM, respectively. For Au nanoparticle preparation, water
solutions into which chloroauric acid (HAu(III)Cl
4
Á H
2
O,
Aldrich 99.999%) and PVP were completely dissolved with
concentrations of 0.5 mM and 1.0 mM, respectively. After
laser irradiation, the resulting solutions were centrifuged at
3,000 rpm for 10 min for both the Fe–Pt and Au cases. In the
case of Fe–Pt, irradiated solutions were dissolved into hexane
for removal of decomposed and undecomposed matter.
An HF2000 (Hitachi, 200 kV) was used for transmission
electron microscopic (TEM) observations and Vantage
(Noran, a minimum analytical beam size of /1 nm)
attached to the TEM apparatus enabled energy dispersive
X-ray spectroscopy (EDXS) measurement. TEM and
EDXS measurements were performed on the samples of
C-supported Cu grids on which colloids were dropped and
allowed to dry. UV3600 (Shimadzu) and Zetasizer Nano
(Malvern) were used for measurements of absorbance
spectra in the UV–visible light region and dynamic light
scattering (DLS) intensities as a function of Zeta potentials,
respectively. Quartz or polystyrene cells (a path length of
10 mm) were used for these optical measurements.
Results and Discussion
Fe–Pt Nanoparticles
After laser irradiation, the red-colored precursor solution
for Fe–Pt changed color to black, similar to that of plati-
num colloids. We investigated the absorbance spectrum
change in the UV–visible light region before and after laser
irradiation as shown in Fig. 2, which includes UV–visible
absorbance spectra of the precursor methanol solution with
Fe(III)(acac)
3
/Pt(II)(acac)
2
= 2.4/0.6 mM, and methanol
solutions of Fe(III)(acac)
3
and Pt(II)(acac)
2
with a con-
centration of 3 mM for reference. The measured solutions
were diluted with methanol by a factor of 100 due to
absorbance saturations in the UV region. It was found that
the contribution of Fe(III)(acac)
3
absorbance, which has a
main peak at around 273 nm due to the p–p* transition of
acetylacetonate ligand [19], is dominant for the precursor
spectrum before irradiation. We assumed that the precursor
main absorbance peak close to the KrF excimer laser
wavelength of 248 nm allowed efficient photolysis of the
complexes. The laser irradiation did not cause a new
absorbance band but only a general reduction in peak
intensities, which is the same tendency as the reported
laser photolysis of Fe(II) acetylacetonate in 2-propanol
solvent [13].
Fig. 1 Experimental set up of KrF excimer laser irradiation to
precursor solution
566 Nanoscale Res Lett (2009) 4:565–573
123
Figure 3 shows EDXS spectrum measured on the Fe–Pt
nanoparticles with a precursor of Fe(III)(acac)
3
/Pt(II)
(acac)
2
= 2.0/1.0 mM and laser conditions of 31.5 W
(630 mJ, 50 Hz) for 30 min. From the appearance of peaks
attributed to iron and platinum elements on several points of
the nanoparticles, alloying of Fe–Pt alloy in the nanoparticles
can be confirmed. Except carbon and copper from the grids,
the existence of other element such as silicon, which was
reported for the laser photolysis with a different experimental
configuration [13], was not confirmed. Figure 4 shows typi-
cal TEM images with different magnifications (a), (b) and an
electron beam diffraction pattern (c) for Fe
50
Pt
50
nanoparti-
cles with a precursor of Fe(III)(acac)
3
/Pt(II)(acac)
2
= 2.4/
0.6 mM and a laser conditions of 15 W (300 mJ, 50 Hz) for
30 min. From the images, diameters of Fe–Pt nanoparticles
are found to be 0.5–3 nm. Fringes characteristic for crystal-
linity in nanoparticles were partly observed on the Fe–Pt
nanoparticles in Fig. 4a. Assemblies or aggregations of
nanoparticles are partly observed together with well-dis-
persed nanoparticles spread in the larger areas (Fig. 4b). The
electron beam diffraction pattern shows continuous diffuse
rings assigned to (111), (200), (220), (311) and (331) planes
of disordered A1 phase of FePt, which correspond to the
ultrafine microstructure in the TEM image. Figure 5 shows
TEM images of Fe
50
Pt
50
nanoparticles with a precursor
concentration of Fe(III)(acac)
3
/Pt(II)(acac)
2
= 2.4/0.6 mM
(a) and Fe
21
Pt
79
nanoparticles with a precursor of Fe(II)Cp
2
/
Pt(II)(acac)
2
= 4.0/6.0 mM (b). The employed laser condi-
tion is 15 W (300 mJ, 50 Hz) in both cases. Nanoparticles
prepared from a combination of Fe(II)Cp
2
/Pt(II)(acac)
2
are
found to have almost the same size range but more diffuse
particle images compared with the Fe(III)(acac)
3
/Pt(II)
(acac)
2
complex combination, which implies an insufficient
crystallinity in the nanoparticles. FePt alloying was also
confirmed from micro EDXS measurements for the
Fe(II)Cp
2
/Pt(II)(acac)
2
combination. Size distributions of the
Fe–Pt nanoparticles, which were obtained from the TEM
images, are shown in Fig. 6. TEM observation results
revealed that all the Fe–Pt nanoparticles obtained were
ultrafine with the same diameter range of 0.5–3 nm regard-
less of the precursor conditions (kinds or concentrations of
metal complexes) or the laser conditions (pulse energies or
irradiation time). The comparison of size distributions in
Fig. 6 shows that the Fe(II)Cp
2
/Pt(II)(acac)
2
precursor case is
Fig. 2 UV–visible absorption spectra of Fe–Pt precursor (Fe(III)
(acac)
3
/Pt(acac)
2
= 2.4/0.6 mM) before and after laser irradiation
(20 W, 400 mJ, 50 Hz). Spectra of Fe(III)(acac)
3
and Pt(II)(acac)
2
MeOH solutions (3 mM) are also indicated with black solid lines and
dashed lines, respectively, for comparison
Fig. 3 EDXS spectrum measured on Fe–Pt nanoparticles with a
precursor of Fe(III)(acac)
3
/ Pt(II)(acac)
2
= 2.0/1.0 mM (31.5 W,
630 mJ, 50 Hz)
Fig. 4 TEM images with
different magnifications (a), (b),
and electron beam diffraction
pattern (c) for Fe
50
Pt
50
nanoparticles with a precursor
of Fe(III)(acac)
3
/
Pt(II)(acac)
2
= 2.4/0.6 mM
(15 W, 300 mJ, 50 Hz)
Nanoscale Res Lett (2009) 4:565–573 567
123
found to have a maximum at a smaller diameter compared
with the Fe(III)(acac)
3
/Pt(II)(acac)
2
case.
Increase of Fe(II)Cp
2
concentration in precursors did not
cause increase of iron concentration in generated nano-
particles, which may be considered to be attributable to a
difficulty in photolysis of Fe(II)Cp
2
compared with
Fe(III)(acac)
3
. Ouchi et al. reported the investigation
results of Fe-based nanoparticle formation by ArF laser
solution photolysis of Fe(II)Cp
2
in hexane, including its
very low quantum yield \10
-3
[20]. Thus, the low iron
concentration in Fe–Pt nanoparticles with Fe(II)Cp
2
/
Pt(II)(acac)
2
complex combination might be related to the
reported low quantum yield of Fe(II)Cp
2
solution photol-
ysis. The harder photolysis of Fe(II)Cp
2
can be also
explained from the mass difference between the ligands of
Cp and acac as follows: frequency of vibration x is known
to be proportional to (k/m)
1/2
, where k is the elastic constant
and m is the reduced mass on the iron–ligand bond. Thus,
x of Fe(II)Cp
2
can be estimated to be higher than that of
Fe(III)(acac)
3
because Fe(II)Cp
2
has a Cp ligand lighter
than an acac of Fe(III)(acac)
3
if the same value of k is
assumed. We think that the higher x of Fe(II)Cp
2
would be
one of the possible reason for its harder photolysis.
Adiabatic dissociation energies of metal–ligand bonds
in iron complexes including Fe(CO)
5
, Fe(II)Cp
2
and
Fe(III)(acac)
3
were reported to be nearly equal to 6.0 eV
from their photodissociation and thermodynamic investi-
gation [21]. In particular, Fe(II)Cp
2
has been investigated
due to its unusual photochemical behavior [22]. The dis-
sociation energy of nearly 6.0 eV is not sufficient for a
single 248 nm photon energy of 5.0 eV, and hence two
photon dissociation can be considered for these dissocia-
tions. The dissociation energy of nearly 6.0 eV is only for
the cleavage of metal–ligand bonds and solvent effect such
as the scavenging effect in alcohols [23], energies for
cleaved ion reduction to zero-valent iron and the formation
scheme of alloy nanoparticles are not taken into consider-
ation. Therefore, further investigations are required to
elucidate nanoparticle formation by UV laser solution
photolysis of Fe and Pt complex solutions.
For applications of Fe–Pt nanoparticles, iron-rich con-
centrations greater than the equiatomic ones are necessary
due to the steep dissipation of magnetization in the Pt-rich
side of concentrations [5]. Thus, we investigated the influ-
ence of irradiated laser powers on Fe–Pt compositions in
order to explore the controllability of Fe–Pt compositions
through adjustment of laser pulse energies. Figure 7 shows
evaluated Fe compositions as a function of irradiated pulse
laser energies for Fe–Pt nanoparticles with precursor con-
centrations of Fe(III)(acac)
3
/Pt(II)(acac)
2
= 2.0/1.0 mM
and 2.4/0.6 mM. The Fe compositions are found to have a
tendency to increase with irradiated laser pulse energy.
Thus, higher laser pulse energies typically more than 350 mJ
Fig. 5 TEM images of Fe
50
Pt
50
nanoparticles with a precursor
of Fe(III)(acac)
3
/
Pt(II)(acac)
2
= 2.4/0.6 mM
(15 W, 300 mJ, 50 Hz) (a) and
Fe
21
Pt
79
nanoparticles with a
precursor of Fe(II)Cp
2
/
Pt(II)(acac)
2
= 4.0/6.0 mM
(15 W, 300 mJ, 50 Hz) (b)
Fig. 6 Size distributions of FePt nanoparticles with a precursor of
Fe(III)(acac)
3
/Pt(II)(acac)
2
= 2.4/0.6 mM (15 W, 300 mJ, 50 Hz)
and that with a precursor of Fe(II)Cp
2
/Pt(II)(acac)
2
= 4.0/6.0 mM
(15 W, 300 mJ, 50 Hz)
568 Nanoscale Res Lett (2009) 4:565–573
123
(185 mJ/cm
2
for fluence) are required in order to obtain Fe–
Pt nanoparticles with higher Fe compositions, which might
be attributable to harder dissociation of Fe(III) acetylace-
tonate than that of Pt(II) acetylacetonate. From the
investigation results of UV laser solution photolysis of
Fe(II)(acac)
2
in i-propanol [20], Pola et al. proposed a deep
photolysis from the complex directly into zero-valent ele-
mental Fe(0) and organic photofragments without passing
through an intermediate product such as the case of Cu(II)
acetylacetonate [24]. This can be considered to be a multi-
photon dissociation process of Fe(II)(acac)
2
through
cleavage of acetylacetonate ligands as shown in the fol-
lowing photolysis (Eq. 1).
Fe IIðÞacacðÞ
2
sol: i-PrOHðÞþn hmðÞ
248nm
! Fe 0ðÞðÞ
n
þorganic photofragments ð1Þ
The absorbance spectra in Fig. 2 show only the reduced
source spectrum and no new absorbance band after laser
irradiation. Therefore, as shown in the following simplified
Eq. 2, we may estimate that the photolysis for Fe–Pt alloy
nanoparticle formation mechanism of Fe(III)(acac)
3
and
Pt(II)(acac)
2
in methanol is based on a multiphoton
dissociation for both the complexes, which is similar to
the above-mentioned deep photolysis of Fe(II)(acac)
2
, even
though the intermediate process between the initiation of
dissociation for each complex and the formation
completion of alloy nanoparticles (FePt)
n
has not yet
been clarified.
Fe IIIðÞacacðÞ
3
þPt IIðÞacacðÞ
2
sol: MeOHðÞþn hmðÞ
248 nm
! FePtðÞ
n
þorganic photofragments
ð2Þ
Figure 8 shows DLS intensity as a function of Zeta
potential for Fe–Pt colloid solutions with varying laser
pulse energies from 250 to 630 mJ (12.5–31.5 W, 50 Hz).
Despite the fairly low zeta potentials ranging from -8to
-2 mV, the colloid solutions are mostly stable for several
weeks. We consider that the aggregation is mainly pre-
vented not by the repulsive force of nanoparticle charges
but by the steric hinderance of dispersing agent of PVP.
PVP concentrations less than two times concentrations of
the sum of Fe and Pt complex ones were found to cause
precipitations after several days of their syntheses.
Au Nanoparticles
We investigated the laser solution photolysis of HAu(III)Cl
4
precursors varying laser pulse frequency from 2 to 20 Hz
while keeping constant pulse energy to 160 mJ and irradia-
tion time to 30 min. Figure 9 shows TEM images and
electron beam diffraction patterns of Au nanoparticles with
varying laser pulse frequencies from 2 Hz (a), 5 Hz (b),
10 Hz (c) and 20 Hz (d) (160 mJ, 0.32–3.2 W) while
keeping constant irradiation time to 30 min. Nonspherical
particles including rods or triangular or pentagonal ones
were partly observed, which have also been reported for Au
nanoparticles prepared by photochemical or other synthetic
methods [25–27]. Synthesis of nonspherical particles (nano-
rods or nano-wires) of WO
3
by laser pyrolysis and analysis of
their formation by the solid-vapor-solid (SVS) mechanism
have also been reported [28]. Diffraction rings attributed to
(111), (200), (220), (311) (222), (400) and (331) planes of
FCC Au can be found in the obtained diffraction images.
When compared with other laser conditions of Fig. 9a, b, d,
the ring of Fig. 9c (10 Hz) shows more continuous and
diffuse characteristics and less diffraction spot especially in
Fig. 7 Evaluated Fe compositions as a function of irradiated laser
powers for Fe–Pt nanoparticles with precursors of Fe(III)(acac)
3
/
Pt(II)(acac)
2
= 2.0/1.0 mM and 2.4/0.6 mM
Fig. 8 DLS intensities as a function of Zeta potentials for Fe–Pt
colloids with varying laser powers from 12.5 W (250 mJ, 50 Hz) to
31.5 W (630 mJ, 50 Hz)
Nanoscale Res Lett (2009) 4:565–573 569
123
the higher order rings compared with other pulse frequency
cases, which implies less crystallinity than the nanoparticles
with other laser pulse frequencies.
Size distributions of the Au nanoparticles, which were
obtained from the TEM images, are summarized with
histograms in Fig. 10. The nanoparticles with lower pulse
frequencies of 2 and 5 Hz are found to have main size
distributions of *10–50 nm (Fig. 10a) while the nano-
particles with higher pulse frequencies of 10 and 20 Hz
(Fig. 10b) show sharper distributions of 10–30 nm even
though a small amount of agglomerated larger particles
exist for the 20 Hz frequency case. In addition to the
nanoparticles having 10 nm diameters, smaller particles
with several nanometers were also observed. Figure 11
shows the comparison of size distributions between the
typical Fe–Pt (Fe(II)Cp
2
/Pt(II)(acac)
2
complexes) and Au
nanoparticles (pulse laser frequency = 2 Hz). The Au
nanoparticles are found to have larger particle diameters of
tens nm for all the cases compared with the Fe–Pt nano-
particles as shown in Fig. 11.
Kurihara et al. proposed the photoreduction scheme for Au
nanoparticle formation by HAu(III)Cl
4
UV laser solution
photolysis as shown in the following Eqs. 3–8 [10]. It consists
of reduction of trivalent Au(III) ion to zero-valent elemental
Au(0) through the formation of a caged divalent gold Au(II)
complex followed by its dissociation and disproportionation,
and finally resulted in Au nanoparticles (Au(0))
n
after accu-
mulation of Au(0). Recently, Nakazato et al. confirmed the
dynamic process of this photoreduction scheme by the single-
shot near-field heterodyne transient grating (NF-HD-TG)
method and also reported that PVP dispersant concentrations
affect the photoreduction process [29].
HAu IIIðÞCl
4
þ nhm ! HAu IIIðÞCl
4
ðÞ
Ã
ð3Þ
HAu IIIðÞCl
4
ðÞ
Ã
! HAu IIðÞCl
3
ÁÁÁClðÞð4Þ
HAu IIðÞCl
3
ÁÁÁClðÞ!HAu IIðÞCl
3
þ Cl ð5Þ
HAu IIðÞCl
3
! HAu IIIðÞCl
4
þ HAu IðÞCl
2
ð6Þ
HAu IðÞCl
2
þ nhm ! Au 0ðÞþHCl þCl ð7Þ
nAu 0ðÞ!Au 0ðÞðÞ
n
ð8Þ
As mentioned in the section ‘‘Fe–Pt nanoparticles’’, Fe or
Fe–Pt nanoparticle formation by UV laser photolysis of
iron and platinum complexes is considered to be based on
multiphoton dissociation of metal complexes, which might
be the reason for relatively high-laser pulse energies for
generation of Fe–Pt nanoparticles. Conversely, the laser
powers for Au nanoparticle formation by UV solution
photolysis are relatively low compared with the metal
complex case. It has been known that UV incoherent light
of relatively low intensity compared with laser light is
sufficient for Au nanoparticle formation in chloride solu-
tions, which may be considered to originate from the
above-mentioned difference in decomposition mechanism
between the multiphoton dissociation of metal complexes
and the photoreduction of gold chloride ions.
Figure 12 shows UV-visible absorption spectra of the
Au nanoparticles prepared with varying laser pulse fre-
quency from 2 to 20 Hz (160 mJ, 0.32–3.2 W). The
absorption spectrum for gold precursor, which has a peak
around 294 nm due to the ligand to metal charge transfer
(LMCT) band of AuCl
4
-
ion [30], is also shown for
comparison. Absorption peaks ranging from 532 to 538 nm
that originate from surface plasmon resonance of Au
nanoparticles were observed for each sample. All the
samples also exhibit peaks attributed to the precursor
solution due to the existence of unreduced AuCl
4
-
ions in
the obtained solutions. Increase in size or nonspherical
shapes including nanorods, ellipsoids, triangular prism, and
tetrahedrons have been known to influence the absorption
spectra of Au nanoparticles from both empirical investi-
gations and numerical simulations using the extended Mie
theory or discrete dipole approximation, DDA [31–33].
From the small amount of nonspherical nanoparticles,
however, we can consider that the spectrum broadening
and the lesser magnitude of absorbance for the 10 Hz pulse
frequency case are attributable to the lesser crystallinity
that can be confirmed from the diffuse diffraction ring in
Fig. 9c compared with the other laser frequency cases.
In order to check the stability of colloids, we measured
Zeta potential properties of the Au colloids. Figure 13
shows DLS intensity as a function of Zeta potential for the
Au nanoparticle colloids with varying laser pulse fre-
quency from 2 to 20 Hz with the pulse energy of 160 mJ.
Although the obtained absolute values of Zeta potentials
are less than 20 mV, which are larger than those of the Fe–
Pt colloids, the Au colloids are not particularly stable
compared with the Fe–Pt colloids. This is considered to be
due to the fact that the stability of Au nanoparticles is
dominated mainly by the steric hinderance of PVP dis-
persant as described in the section ‘‘Fe–Pt nanoparticles’’.
Conclusion
Fe–Pt and Au nanoparticles were prepared by KrF excimer
laser solution photolysis. TEM observations revealed that
the Fe–Pt nanoparticles are composed of FCC A1 phase
and are ultrafine with diameters of 0.5–3 nm. From EDXS
analyses, compositions of Fe–Pt nanoparticles are found to
be mainly influenced by irradiated laser powers, which
implies that Fe acetylacetonate is harder to decompose
compared with Pt acetylacetonate. Although the Zeta
potentials are lower than those of the Au colloids, the Fe–
Pt colloids are stable for longer time periods than the case
of Au colloids due to the steric hinderance of PVP. The Au
570 Nanoscale Res Lett (2009) 4:565–573
123
Fig. 9 TEM images and
electron beam diffraction
patterns of Au nanoparticles
with laser pulse frequencies of
2Hz(a), 5 Hz (b), 10 Hz (c)
and 20 Hz (d) (160 mJ, 0.32–
3.2 W)
Nanoscale Res Lett (2009) 4:565–573 571
123
nanoparticles are over 10 times larger than those of Fe–Pt
nanoparticles.
Acknowledgments We are grateful for Mr. T. Miyazaki of Tohoku
University for his skilled TEM observations and EDXS analyses and
Mr. K. Tamura for his assistance with sample preparations.
References
1. D. Weller, A. Moser, L. Folks, M.E. Best, W. Lee, M.F. Toney,
M. Schwickert, J U. Thiele, M.F. Doerner, IEEE Trans. Magn.
36, 10 (2000). doi:10.1109/20.824418
2. T.A. Taton, Nat. Mater. 2, 73 (2003). doi:10.1038/nmat824
3. R. Hong, N.O. Fischer, T. Emrick, V.M. Rotello, Chem. Mater.
17, 4617 (2005). doi:10.1021/cm0507819
4. H. Yano, M. Kataoka, H. Yamashita, H. Uchida, M. Watanabe,
Langmuir 23, 6438 (2007). doi:10.1021/la070078u
Fig. 10 Size distributions of Au nanoparticles with laser pulse
frequencies of 2 Hz and 5 Hz (a), and 10 Hz and 20 Hz (b) (160 mJ,
0.32–3.2 W)
Fig. 11 Comparison of size distributions between Fe–Pt nanoparti-
cles with a precursor of Fe(II)Cp
2
/Pt(II)(acac)
2
= 4.0/6.0 mM
(300 mJ, 50 Hz, 15 W) and Au nanoparticles with a laser pulse
frequency of 2 Hz
Fig. 12 UV–visible absorption spectra of Au nanoparticle solutions
with varying laser pulse frequencies from 2 Hz (160 mJ, 0.32 W) to
20 Hz (160 mJ, 3.2 W)
Fig. 13 DLS intensities as a function of Zeta potentials for Au
colloids with varying laser pulse frequencies from 2 Hz (160 mJ,
0.32 W) to 20 Hz (160 mJ, 3.2 W)
572 Nanoscale Res Lett (2009) 4:565–573
123
5. M. Watanabe, Recent Research Developments in Applied Physics,
vol. 6 (Transworld Research Network, Kerala, 2003), p. 81
6. S. Sun, C.B. Murray, D. Weller, L. Folks, A. Moser, Science 287,
1989 (2000). doi:10.1126/science.287.5460.1989
7. Y. Wang, B. Ding, H. Li, X. Zhang, B. Cai, Y. Zhang, J. Magn.
Magn. Mater. 308, 108 (2007). doi:10.1016/j.jmmm.2006.05.011
8. H. Takamura, H. Sugai, M. Watanabe, T. Kasahara, A. Kameg-
awa, M. Okada, J. Electroceram. 17, 741 (2006). doi:10.1007/
s10832-006-7776-0
9. H. Hada, Y. Yonezawa, A. Yoshida, A. Kurakake, J. Phys. Chem.
80, 2728 (1976). doi:10.1021/j100566a003
10. K. Kurihara, J. Kizling, P. Stenius, J.H. Fendler, J. Am. Chem.
Soc. 105, 2574 (1983). doi:10.1021/ja00347a011
11. L. Bronstein, D. Chernyshov, P. Valetsky, N. Tkachenko, H.
Lemmetyinen, J. Hartmann, S. Fo
¨
rster, Langmuir 15, 83 (1999).
doi:10.1021/la980868r
12. J.A. Powell, S.R. Logan, J Photochem. 3, 189 (1974). doi:
10.1016/0047-2670(74)80019-5
13. J. Pola, M. Marys
ˇ
ko, V. Vorlı
´
c
ˇ
ek, S. Bakardjieva, J. S
ˇ
ubrt,
Z. Bastl, A. Ouchi, J. Photochem. Photobiol. Chem. 199, 156
(2008). doi:10.1016/j.jphotochem.2008.05.014
14. J.S. Haggerty, W.R. Cannon, Laser-induced Chemical Processes
(Plenum Press, New York, 1981)
15. N. Kambe, Scr. Mater. 44, 1671 (2001). doi:10.1016/S1359-
6462(01)00880-6
16. C. Liang, Y. Shimizu, M. Masuda, T. Sasaki, N. Koshizaki,
Chem. Mater. 16, 963 (2004). doi:10.1021/cm034706e
17. Y. Ishikawa, K. Kawaguchi, Y. Shimizu, T. Sasaki, N. Koshizaki,
Chem. Phys. Lett. 428, 426 (2006). doi:10.1016/j.cplett.2006.
07.076
18. T. Teranishi, M. Miyake, Encyclopedia of Nanoscience and
Nanotechnology, vol. 5 (American Scientific Publishers, Los
Angeles, 2004)
19. K. Kishi, S. Ikeda, K. Hirota, J. Phys. Chem. 71, 4384 (1967).
doi:10.1021/j100872a034
20. A. Ouchi, T. Tsunoda, Z. Bastl, M. Marys
ˇ
ko, V. Vorlı
´
c
ˇ
ek, J.
Boha
´
c
ˇ
ek, K. Vacek, J. Pola, J. Photochem. Photobiol. Chem. 171,
251 (2005). doi:10.1016/j.jphotochem.2004.10.020
21. Y. Nagano, Y. Achiba, K. Kimura, J. Phys. Chem.
90, 1288
(1986). doi:10.1021/j100398a017
22. U. Ray, H.Q. Hou, Z. Zhang, W. Schwarz, M. Vernon, J. Chem.
Phys. 90, 4248 (1989). doi:10.1063/1.455781
23. H. Hada, Y. Yonezawa, A. Yoshida, A. Kurakake, J. Phys. Chem.
80, 2728 (1976). doi:10.1021/j100566a003
24. J. Pola, A. Ouchi, S. Bakardjieva, M. Urbanova
´
, J. Boha
´
c
ˇ
ek,
J. S
ˇ
ubrt, J. Photochem. Photobiol. Chem. 192, 84 (2007). doi:
10.1016/j.jphotochem.2007.05.007
25. W.C. Huang, Y.C. Chen, J. Nanopart. Res. 10, 697 (2008). doi:
10.1007/s11051-007-9293-8
26. H.C. Chu, C.H. Kuo, M.H. Huang, Inorg. Chem. 45, 808 (2006).
doi:10.1021/ic051758s
27. S. Porel, S. Singh, T.P. Radhakrishnan, Chem. Comm. 2387,
(2005)
28. B.W. Mwakikunga, A. Forbes, E. Sideras-Haddad, C. Arendse,
Nanoscale Res. Lett. 3, 372 (2008). doi:10.1007/s11671-008-
9169-6
29. Y. Nakazato, M. Okuda, K. Katayama, Chem. Phys. Lett. 457,
271 (2008). doi:10.1016/j.cplett.2008.04.014
30. A.K. Gangopadhayay, A. Chakravorty, J. Chem. Phys. 35, 2206
(1961). doi:10.1063/1.1732233
31. R. Gans, Ann. Phys. 342, 881 (1912). doi:10.1002/andp.
19123420503
32. S. Link, M.A. El-Sayed, J. Phys. Chem. B 103, 8410 (1999). doi:
10.1021/jp9917648
33. K.L. Kelly, E. Coronado, L.L. Zhao, G.C. Schatz, J. Phys. Chem.
B 107, 668 (2003). doi:10.1021/jp026731y
Nanoscale Res Lett (2009) 4:565–573 573
123