Báo cáo hóa học: " Effect of Interfacial Bonds on the Morphology of InAs QDs Grown on GaAs (311) B and (100) Substrates" potx
Bạn đang xem bản rút gọn của tài liệu. Xem và tải ngay bản đầy đủ của tài liệu tại đây (273.63 KB, 5 trang )
NANO EXPRESS
Effect of Interfacial Bonds on the Morphology of InAs QDs
Grown on GaAs (311) B and (100) Substrates
Lu Wang Æ Meicheng Li Æ Min Xiong Æ
Liancheng Zhao
Received: 12 December 2008 / Accepted: 24 March 2009 / Published online: 5 April 2009
Ó to the authors 2009
Abstract The morphology and transition thickness (t
c
)
for InAs quantum dots (QDs) grown on GaAs (311) B and
(100) substrates were investigated. The morphology varies
with the composition of buffer layer and substrate orien-
tation. And t
c
decreased when the thin InGaAs was used as
a buffer layer instead of the GaAs layer on (311) B sub-
strates. For InAs/(In)GaAs QDs grown on high miller index
surfaces, both the morphology and t
c
can be influenced by
the interfacial bonds configuration. This indicates that
buffer layer design with appropriate interfacial bonds
provides an approach to adjust the morphologies of QDs
grown on high miller surfaces.
Keywords InAs Á Transition thickness Á
High miller index Á Strain Á Interfacial bonds
Introduction
Self-assembled quantum dots (QDs) have been intensively
studied over the past decades in both fundamental and
application fields. To date, several systems have exhibited
great optical properties and find their applications, such as
laser diodes [1] and optical detectors [2]. The InAs/GaAs
should undoubtedly be the most widely studied one among
these systems. In recent years, room temperature emission
of InAs QD laser around 1.3 lm for the fiber optical
communication waveband [3] and optical absorption at
8–12 lm for the long-wavelength infrared detecting [4]
had been achieved by means of employing a so-called dots-
in-a-well (DWELL) structure. In this structure, the QDs are
first grown on a thin InGaAs buffer layer and then finally
with an InGaAs capping layer. So, the nucleation and
growth dynamic of InAs QDs grown on the alloy layer are
of central importance. And much attention has been paid to
these important research fields [5–7].
However, most of the studies focused on the structures
grown on GaAs (100) substrates. Recently, many high
index polarized surfaces, such as GaAs (311) A [8] and
(311) B [9–13], GaAs (411) A [14], and (411) B [15], have
drawn greater attention because QDs grown on theses
surfaces have some unique properties, such as the narrow
size distribution, high QDs density, and so on. These
structure properties can further show their efforts in
improving the device performances. However, the growth
mechanism of QDs is still a controversial subject, espe-
cially with regard to the high index surfaces. Apparently,
for the superiority of QDs grown on these high index
surfaces, a deeper research into these high index surfaces
grown QDs is clearly needed.
In this research, we have conducted a comparative study
on the effect of buffer layer and the substrates’ orientation
on the equilibrium structure and the critical transition
thickness (t
c
) of InAs QDs grown on both GaAs (311) B
and (100) substrates by molecular beam epitaxy (MBE).
Experiments
The samples were grown in a conventional MBE system
equipped with 12-keV Reflection High Energy Electron
Diffraction (RHEED). GaAs (311) B and (100) substrates
were held side by side with indium on same molybdenum
holder. For the InAs/InGaAs samples, after deoxidizing the
surface oxide at 630 °C, a 500-nm GaAs buffer layer was
L. Wang Á M. Li (&) Á M. Xiong Á L. Zhao
Department of Materials Physics and Chemistry, Harbin Institute
of Technology, Harbin, People’s Republic of China
e-mail:
123
Nanoscale Res Lett (2009) 4:689–693
DOI 10.1007/s11671-009-9304-z
grown, then 2.3-ML InAs QDs layer was grown on top of a
2-nm In
0.15
Ga
0.85
As layer, at the rate of 0.022 ML/s. Both
the QDs layer and the buffer layer were grown at 530 °C.
For the InAs/GaAs samples, only the 2-nm In
0.15
Ga
0.85
As
layers were changed to a GaAs buffer layer, and the cov-
erage of InAs was 2.1 ML. As
2
was used during the whole
growth process, and the As
2
/In beam effective pressure–
flux ratio was fixed at 40; the growth rates were determined
by the RHEED oscillation technique on the (100) plane.
The RHEED pattern has been imaged by a charge-coupled
device camera, then digitized, and analyzed by software.
When the streak pattern turned into the spots of the three-
dimensional (3D) QDs which demonstrated the transition
of 2D–3D growth mode, the intensity of one spotty pattern
was recorded. The atomic force microscopy (AFM) test
was conducted in a contact mode in air.
Results and Discussion
The surface morphology of self-assembled QDs is a key
factor in determining its optical properties, and it is very
sensitive to the sample structure, for example, the com-
position of buffer layer [16], surface reconstruction, and
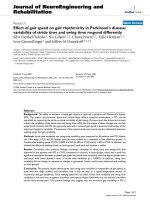
substrate orientation [17]. Figure 1 shows AFM images of
InAs QDs grown on (In)GaAs buffer layer grown on GaAs
(311) B and (100) substrates. The morphology of QDs
varies a lot with the different buffer layer and substrate
orientation. Note that there are very few QDs as can be
observed in Fig. 1c. This is because we reduced the InAs
coverage of the InAs/GaAs samples to 2.1 ML. The pur-
pose of this action was make sure that the InAs coverage of
QDs grown on GaAs (311) B sample was just over the
transition thickness (we had measured the transition
thicknesses before this experiment). At the same time, the
QDs on GaAs (100) had already developed for a certain
time. Thus, the 2.1 ML’s coverage made the difference in
morphology of these two samples become more clear. For
the InAs/InGaAs structures, while the QDs grown on GaAs
(311) B substrates were mature, those grown on GaAs
(100) substrates were clearly underdeveloped. Most of the
QDs grown on GaAs (100) substrates were very small sized
and only a few QDs can be clearly observed. The average
density, height, lateral size, and the standard statistics error
of height and lateral size of these two samples are
4.4 9 10
10
cm
-2
and 3.6 9 10
10
cm
-2
; 10.3(±2.58)nm
and 6.2(±0.46)nm; 145(±6.58)nm and 130(±5.8)nm for
the QDs on GaAs (311) B and (100), respectively. Nev-
ertheless, for the InAs/GaAs QDs, the QDs were all of
larger size on the GaAs (100) substrates than those on
GaAs (311) B substrates. The average density, height, and
lateral size for these two samples are 4.8 9 10
8
cm
-2
and
Fig. 1 AFM images for InAs/
(In)GaAs QDs grown on GaAs
(311) B and (100) substrates.
a InAs/InGaAs (311) B; b InAs/
InGaAs (100); c InAs/GaAs
QDs (311) B; d InAs/GaAs QDs
(100). The scan sizes were all
2 9 2 lm
2
690 Nanoscale Res Lett (2009) 4:689–693
123
2.8 9 10
9
cm
-2
; 3.4(±1.13)nm and 5.5(±1.82)nm;
105(±7.1)nm and 159(±7.0)nm for the QDs on GaAs
(311) B and (100), respectively. These facts suggested that
an earlier 2D–3D growth mode transition may exist in the
InAs/GaAs on GaAs (100) than that on (311) B; however,
if the buffer layer was an InGaAs layer instead of a GaAs
layer, the transition starts later on GaAs (100) than on (311)
B. In other words, for the InAs/In
0.15
Ga
0.85
As samples,
t
c311
is smaller than t
c100
; however, for the InAs/GaAs
samples, t
c311
is larger than t
c100
.
For the self-assembled QDs, t
c
is an important param-
eter. For it determines when the islands were formed during
the growth, which therefore has a great impact on the
morphology of QDs at a given coverage. It had been
confirmed that the growth parameters have very little
influence on t
c
. But t
c
is rather sensitive to the substrate
orientation, as shown by many studies that have been
conducted to check the effect of substrate orientation on t
c
[18, 19]. Besides, it had been found that the effect of
interfacial (IF) bonds can influence t
c
of the noncommon
anion heteroepitaxy system (III
1
V
1
/III
2
V
2
, such as InAs/
GaSb and InP/GaAs) greatly. Take the InAs/GaSb super-
lattice for example: t
c
of this system was much thinner
when the IF bonds consisted of In–Sb bonds rather than the
Ga–As bonds [20, 21]. This is due to additional IF strain
offered by the higher atom sizeof In and Sb than that of Ga
and As. However, one cannot observe this effect for the
common anion system (III
1
V/III
2
V, such as InAs/GaAs and
InAs/InGaAs) because the GaAs (100) surfaces are As
terminated under common growth, and the IF bond con-
figurations are no different from those of the film [21]. So
one cannot find the effect of IF bonds in the InAs/GaAs or
InAs/InGaAs system grown on (100) surfaces, which is the
case of our InAs/GaAs QDs grown on GaAs (100). Since
the In
0.15
Ga
0.85
As layers we had grown were so thin (2 nm)
that they should be fully strained, t
c
should have no dif-
ference between the InAs/GaAs and InAs/In
0.15
Ga
0.85
As
samples grown on the GaAs (100) substrates [20, 21].
Then, we turn to t
c
of the InAs/GaAs and InAs/
In
0.15
Ga
0.85
As structures grown on GaAs (311) B sub-
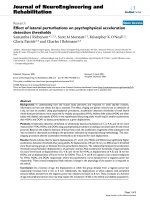
strates. We monitored the difference in t
c
of these two
types of structures grown both on GaAs (311) B substrates
by recording the dependence of intensity of one spotty
pattern on the InAs coverage. The results can be seen in
Fig. 2. A clear delay for the growth-mode transition can be
found at the InAs/GaAs sample: for example, at the
thickness 1.5 ML, the InAs/In
0.15
Ga
0.85
As structure had
finished the sharp rise of intensity, whereas for the InAs/
GaAs structure, the transition had not even started. This
result shows that t
c
varies a lot according to the composi-
tion of the buffer layer at the GaAs (311) B surface.
The higher t
c
of InAs/GaAs than the InAs/In
0.15
Ga
0.85
As
sample grown on GaAs (311) B can be understood by
introducing the effect of IF bonds on t
c
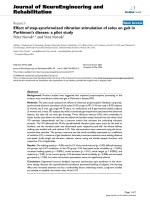
. The GaAs (311) B
surface has two type of atom positions, including twofold
coordinated (100)-like Ga atoms at the topmost layer (two
dangling bonds) and three threefold coordinated (111)
B-like As atoms at the second layer (one dangling bond);
the number of these two types of position are exactly the
same, as can be seen from Fig. 3 [22, 23]. If the hetero-
interface formed on this surface, then the IF bonds
configuration is different from the film because there are
mixed In–As and Ga–As bonds in the IF layer;however,
only Ga–As bonds can be found in the buffer and only
In–As bonds can be found in the film. So, the bonds con-
figuration is different from the film and the buffer.
Accordingly, one may see the effect of IF bonds. So, when
we developed the InAs/GaAs sample, the twofold coordi-
nated (100)-like positions were all occupied by Ga atoms,
the IF bonds consisted of both Ga–As and In–As types, and
the ratio between them was 2:1. While, when we developed
1.6 1.7 1.8 1.9
Intensity (a.u.)
InAs coverage (ML)
InAs/GaAs
1.87ML
(a)
0.9 1.0 1.1 1.2 1.3 1.4 1.5
Intensity (a.u.)
InAs coverage (ML)
InAs/InGaAs/GaAs
1.47ML
(b)
Fig. 2 The intensity of spotty RHEED pattern of sample 1 (a) and 2
(b) independent of InAs coverage
Nanoscale Res Lett (2009) 4:689–693 691
123
the InAs/In
0.15
Ga
0.85
As sample, these twofold coordinated
(100)-like positions were occupied by both In atoms and
the Ga atoms, and nearly 15% Ga dangling bonds were
replaced by In dangling bonds. Accordingly, the ratio of
Ga–As and In–As dangling bonds became lower than 2:1.
Comparing to the InAs/GaAs case, the IF strain accumu-
lated was larger due to more In–As IF bonds can be found.
And the additional IF strain provided by In atoms at the
buffer layer made the transition start early. So if the epitaxy
is performed on a high miller index surface, the effect of IF
bonds on t
c
can be observed, even for the common anion
systems.
Thus, when the InGaAs buffer layer was used instead of
the GaAs buffer layer, t
c
decreased on the GaAs (311) B
substrates but remained constant on the GaAs (100) sub-
strates. One thing that should be noted in conclusion is that
the morphologies of InAs/GaAs and InAs/InGaAs QDs
grown on GaAs (100) substrates are clearly very different
despite the difference in InAs coverage being negligible
(2.1 ML–2.3 ML). This may partly be due to the change of
growth environment. After all, these two samples were not
grown at the same time. Besides, this difference suggests
that there may be other factors that contribute to the
equilibrium shape of QDs grown on GaAs and InGaAs
buffer layers: for example, the morphology differences in
different buffer layers may modify the migrate length of
adatoms. However, we argue that the difference in t
c
still at
least partly induced different equilibrium morphologies of
QDs as measured by AFM. This result shows that t
c
of
InAs/GaAs QDs grown on high miller surfaces, i.e., GaAs
(311) B, can be adjusted through modifying the type and
amount of IF bonds and further to modify the equilibrium
structures. These structural characteristics would surely
induce different properties. So this effect offers one
parameter for the design and fabrication of self-assembled
QDs, and should be regarded as an advantage for the InAs
QDs grown on high miller index surfaces compared to the
conventional GaAs (100) surfaces. And also, due to the
often-observed morphology instability when the highly
mismatched epitaxy was conducted, this study provides the
information that the effect of IF bonds should be taken into
consideration in this field [24].
Conclusion
In conclusion, the morphology and t
c
of the self-assembled
InAs QDs grown on GaAs (311) B and GaAs (100) sub-
strates with (In)GaAs buffer layer were investigated. It was
found that the configuration of IF bonds plays an important
role in the morphology and t
c
of InAs QDs. For common
anion systems, such as InAs/(In)GaAs, this effect can only
be observed at high miller index surfaces, which can be
used to adjust the morphology in the QDs grown on high
miller index surfaces.
Acknowledgments The study was financially supported in part by
the NSFC (Under Grant Numbers: 50502014), and the program for
New Century Excellent Talents in University (NCET).
References
1. M. Henini, M. Bugajski, Microelectron. J. 36, 950 (2005). doi:
10.1016/j.mejo.2005.04.017
Fig. 3 Ball-and-stick model of
the bulk-truncated GaAs (311)
B surface. The numbers of Ga
and As dangling bonds in the
unit cell are 8 and 4,
respectively
692 Nanoscale Res Lett (2009) 4:689–693
123
2. Z.M. Ye et al., J. Appl. Phys. 92, 4141 (2002). doi:10.1063/
1.1504167
3. M.T. Todaro et al., IEEE Photon. Technol. Lett. 19, 191 (2007).
doi:10.1109/LPT.2006.890045
4. E.T. Kim et al., Appl. Phys. Lett. 84, 3277 (2004). doi:10.1063/
1.1719259
5. H. Shimizu, S. Saravanan, Appl. Phys. Lett. 88, 041119 (2006)
6. X.X. Han et al., J. Appl. Phys. 98, 053703 (2005)
7. M. Gutierrez et al., J. Cryst. Growth 278, 151 (2005). doi:
10.1016/j.jcrysgro.2004.12.179
8. L. Sfaxi et al., J. Cryst. Growth 293, 330 (2006). doi:10.1016/
j.jcrysgro.2006.05.042
9. M. Henini, Nanoscale Res. Lett. 1, 32 (2006). doi:10.1007/s11671-
006-9017-5
10. Y. Temko et al., Phys. Rev. B 68 (2003). doi:10.1103/
PhysRevB.68.165310
11. T. Suzuki, Y. Temko, K. Jacobi, Appl. Phys. Lett. 80, 4744 (2002).
doi:10.1063/1.1489087
12. K. Jacobi, Prog. Surf. Sci. 71, 185 (2003). doi:10.1016/S0079-
6816(03)00007-8
13. D.I. Lubyshev, P.P. Gonzalez-Borrero, E. Marega, Jr., E. Petitprez,
P. Basmaji, J. Vac. Sci. Technol. B 14, 2212 (1996). doi:10.1116/
1.588902
14. M.C. Xu et al., Phys. Rev. B 71, 075314 (2005)
15. M.C. Xu et al., Surf. Sci. 576, 89 (2005). doi:10.1016/j.susc.
2004.12.012
16. I. Alghoraibi et al., J. Cryst. Growth 293, 263 (2006). doi:
10.1016/j.jcrysgro.2006.05.046
17. B.A. Joyce, D.D. Vvedensky, Mater. Sci. Eng. Rep. 46, 127
(2004). doi:10.1016/j.mser.2004.10.001
18. S. Sanguinetti et al., Europhys. Lett. 47, 701 (1999). doi:10.1209/
epl/i1999-00446-x
19. B.L. Liang et al., Nanoscale Res. Lett. 2, 609 (2007). doi:
10.1007/s11671-007-9103-3
20. J.H. Li et al., Phys. Rev. Lett. 95, 096104 (2005)
21. J.H. Li, D.W. Stokes, Appl. Phys. Lett. 89, 111906 (2006)
22. Z.M. Wang et al., Appl. Phys. Lett. 81, 2965 (2002). doi:
10.1063/1.1514822
23. J. Temmyo et al., J. Korean Phys. Soc. 39, S368 (2001)
24. M. Xiong, M.C. Li, L.C. Zhao, Phys. Status Solidi-Rapid Res.
Lett. 1, R80 (2007). doi:10.1002/pssr.200600092
Nanoscale Res Lett (2009) 4:689–693 693
123