Báo cáo hóa học: " Biological Synthesis of Size-Controlled Cadmium Sulfide Nanoparticles Using Immobilized Rhodobacter sphaeroides" ppt
Bạn đang xem bản rút gọn của tài liệu. Xem và tải ngay bản đầy đủ của tài liệu tại đây (371.45 KB, 7 trang )
NANO EXPRESS
Biological Synthesis of Size-Controlled Cadmium Sulfide
Nanoparticles Using Immobilized Rhodobacter sphaeroides
Hongjuan Bai Æ Zhaoming Zhang Æ Yu Guo Æ
Wanli Jia
Received: 30 December 2008 / Accepted: 24 March 2009 / Published online: 18 April 2009
Ó to the authors 2009
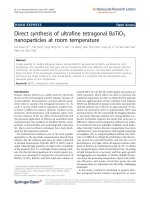
Abstract Size-controlled cadmium sulfide nanoparticles
were successfully synthesized by immobilized Rhodobacter
sphaeroides in the study. The dynamic process that Cd
2?
was transported from solution into cell by living R. sph-
aeroides was characterized by transmission electron
microscopy (TEM). Culture time, as an important physio-
logical parameter for R. sphaeroides growth, could signifi-
cantly control the size of cadmium sulfide nanoparticles.
TEM demonstrated that the average sizes of spherical cad-
mium sulfide nanoparticles were 2.3 ± 0.15, 6.8 ± 0.22,
and 36.8 ± 0.25 nm at culture times of 36, 42, and 48 h,
respectively. Also, the UV–vis and photoluminescence
spectral analysis of cadmium sulfide nanoparticles were
performed.
Keywords Biosynthesis Á Cadmium sulfide Á
Nanoparticles Á Rhodobacter sphaeroides
Introduction
Biosynthesis of nanomaterials as a novel nanoparticle
synthesizing technology attracts increasing attention. It is
well known that many organisms can provide inorganic
materials either intra- or extracellularly [1, 2]. For example,
unicellular organisms such as magnetotactic bacteria pro-
duce magnetite nanoparticles [3], and diatoms synthesize
siliceous materials [4]. Even live plants such as Alfalfa are
able to produce gold clusters surrounded by a shell of
organic ligands [5]. Bansal et al. [6] have synthesized
4–5 nm barium titanate (BT) nanoparticles using a fungus-
mediated approach. As far as the biosynthesis of cadmium
sulfide (CdS) nanoparticles is concerned, a number of bio-
synthesis methods have been reported. For example, CdS
nanoparticles can be synthesized intracellularly by the
yeasts Schizosaccharomyces pombe [7]. However, intra-
cellular synthesis of CdS nanoparticles makes the job of
downstream processing difficult and beats the purpose of
developing a simple and economical process. The extra-
cellular enzyme secreted by the fungus Fusarium oxysporum
can mediate extracellular synthesis of CdS nanoparticles [8].
But live organisms have the endogenous ability to exqui-
sitely regulate synthesis of inorganic materials. For exam-
ple, shape control of inorganic materials in biological
systems was achieved either by formation of membrane
vesicles [9] or through functional molecules such as alu-
minophosphates and polypeptides that bonded specifically
to mineral surfaces [10]. On the other hand, the size, shape,
and yield of biosynthesized nanoparticles significantly
depend on physiological parameters, and remarkably are
affected by growth conditions (including pH, temperature,
culture time, and metal ions concentration) of live organ-
isms. For example, gold nanowires with a network structure
can be synthesized with the change of HAuCl
4
concentra-
tion by Rhodopseudomonas capsulate [11], and triangular
gold nanoplates can be produced with adjusting the pH of
initial solution by Rhodopseudomonas capsulate [12]. The
exploitation of size- and shape-controlled biosynthesis of
CdS nanoparticles using live photosynthetic bacteria is so
far unexplored and underexploited. In this study, prokaryote
photosynthetic bacteria Rhodobacter sphaeroides, recog-
nized as one of the ecologically and environmentally
H. Bai (&) Á Y. Guo Á W. Jia
Chemical Industry and Ecology Institute, North University
of China, Taiyuan 030051, China
e-mail:
Z. Zhang
College of Life Science and Technology, Shanxi University,
Taiyuan 030006, China
123
Nanoscale Res Lett (2009) 4:717–723
DOI 10.1007/s11671-009-9303-0
important microorganisms, commonly existing in the
natural environment, were investigated for producing CdS
at room temperature with a single step process. Especially
CdS nanoparticles were formed intracellularly and then
were transported into extracellular solution. In addition,
immobilized R. sphaeroides can be separated from cad-
mium sulfide nanoparticles easily.
Experimental
Organism and Cultivation
Rhodobacter sphaeroides were obtained from College of
Life Science and Technology, Shanxi University, Taiyuan,
China. R. sphaeroides were cultured in the medium con-
taining (in 1 L) 2.0 g malic sodium, 0.15 g MgSO
4
Á 7H
2
O,
1.2 g yeast extract, and 1.5 g (NH
4
)
2
SO
4
at pH 7 and 30 °C
[13]. The bacteria were cultured for 72 h and separated from
broth by centrifugation (5000 rpm) at 4 °C for 10 min. The
collected bacteria were washed five times with distilled
water to obtain about 1 g wet weight of bacteria.
Preparation of Immobilized Rhodobacter sphaeroides
The concentrated pure-culture R. sphaeroides were then
mixed with polyvinylalcohol (PVA) (10 g PVA/100 mL
distilled water). The initial concentration of cells was
30 mg/L. The gel beads with wrapped microbial cells were
formed in a solution of 10% H
3
BO
3
, and the average
diameter was about 3 mm. The beads were ‘‘annealed’’ in
the H
3
BO
3
solution for 18 h. After activation in growth
medium, the immobilized beads were washed twice with
distilled water and were prepared for use [14].
Biological Synthesis of Cadmium Sulfide Nanoparticles
Synthesis was conducted in a 1000 mL sterile serum bottle
containing 20 g immobilized R. sphaeroides and 500 cul-
ture medium of 1.0 mM CdCl
2
. The resulting solution was
incubated at 30 °C under the dark and aerobic (DO =
5mgL
-1
) conditions for 36 h. After the bio-transforma-
tion reaction was completed, the precipitate was washed
several times with distilled water. The final precipitate was
dried at 50 °C for 3 h in a vacuum kiln. The products were
obtained in about 85% yield based on Cd.
The CdS nanoparticles synthesized by immobilized
R. sphaeroides were used for powder X-ray diffraction
(XRD) analysis. The spectra were recorded on a Rigaku
Dmax-cA automatic instrument. The diffracted intensities
were recorded from 10° to 70° 2h angles. The sample was
prepared by drop coating onto a carbon-coated copper grid
for transmission electron microscopy (TEM), high-resolu-
tion transmission electron microscopy (HRTEM), and
selected area electron diffraction (SAED). TEM was per-
formed on a Hitachi H-600 instrument operated at an
accelerating voltage of 120 kV while HRTEM and SAED
were performed on a Hitachi H-2010 instrument operated
at a lattice image resolution of 0.14 nm. The cells were
analyzed by transmission electron microscopy (TEM) and
energy dispersive X-ray spectroscopy (EDXS), using a
100CX scanning transmission electron microscope and a
Kevex 8000 EDX system. The cell samples were prepared
as previously described [15]. Ultraviolet and visible (UV–
vis) absorption spectrum was collected at room tempera-
ture on Shimadzu UV-2101PC using BaSO
4
powder as a
standard. The photoluminescence emission and excitation
spectra were recorded with a Hitachi F-850 fluorescence
spectrometer.
Different Forms of Cadmium Separated by Different
Centrifugation Speed
Nanocrystal formation was initiated by adding CdCl
2
(1 mM) to a cell sample (about 1 g wet weight) suspended
in growing medium. The solutions were incubated on an
orbital shaker at 30 °C and agitated at 150 rpm. Samples
were taken at predefined time intervals (0, 12, 24, 36, 42,
and 48 h). The sample was centrifuged at 40009g for
20 min. The biomass pellet (P
1
) was collected and the
medium without cells was centrifuged at 150009g at 4 °C
for 60 min. The supernatant (S
1
) was collected, and the
pellet (P
2
) with the CdS-containing particles was washed
with deionized water three times. Each experiment was
repeated three times. The contents of cadmium in different
forms of P
1
,S
1
, and P
2
were determined using Shimadzu
AA-6300 atomic absorption spectrophotometer in an air-
acetylene flame at 228.8 nm wavelength [16].
Cysteine Desulfhydrase Assay
Cysteine desulfhydrase activity of the cell was measured
using a colorimetric assay adapted from Chu et al. [17].
Samples of R. sphaeroides were centrifuged at 40009g
for 20 min. The pellet was resuspended in phosphate
buffer (10 mM, 1 ml, pH 7.5). The reaction was started
by the addition of Tris (0.1 M buffered to pH 7.6) and
cysteine hydrochloride (100 mM, pH 8.6), then the mix-
ture was incubated at 37 °C for 1 h. Sulfide formation
was determined by adding N,N-dimethyl-p-phenylenedia-
mine sulfate (20 mM, in 7.2 M HCl) and FeCl
3
(30 mM,
in 7.2 M HCl) to the reaction tubes. Absorbance was
measured at 650 nm and the concentration of sulfide was
determined according to a standard sodium sulfide
718 Nanoscale Res Lett (2009) 4:717–723
123
calibration curve. Total protein was measured by the
method of Chen et al. [18].
Results and Discussion
Biosynthesis of CdS Nanoparticles
Figure 1 displays the XRD pattern of the CdS synthesized
by immobilized R. sphaeroides at 42 h. Three diffraction
peaks at ca. 26.58, 44.16, and 52.39 can be indexed as
cubic CdS (1 1 1), (2 2 0), and (3 1 1) faces by comparison
with the data from JCPDS file no. 42-1411, which indicates
that CdS nanoparticles have been successfully prepared by
immobilized R. sphaeroides. The widened peaks imply a
small particle size of the product. According to Debye-
Scherrer equation, the mean grain size is calculated to be
approximately 4.3 nm. Typical EDX pattern shows that the
CdS nanoparticles are composed of the elements Cd and S,
and the ratio of Cd:S is 0.97:1.00, being in with the
expected value.
A representative HRTEM image at low amplificatory
times of the CdS nanoparticles obtained at 42 h is given in
Fig. 2a. The particles are essentially spherical, and the
average particle size is 6.8 ± 0.20 nm selecting one hun-
dred particles of TEM. However, HRTEM at high ampli-
ficatory times shows that the nanocrystals have a size of
4.3 nm at the place I. The size of nanocrystals observed by
HRTEM at high amplificatory times is smaller than that at
low amplificatory times due to a few gathered nanocrystals.
HRTEM at high amplificatory times and lattice images
reveal that the nanocrystals are cubic with a d spacing of
0.36 nm, corresponding to the (111) plane of cubic CdS
(Fig. 2b, c). The SAED pattern of these particles indicates
that they are the face-centered cubic (fcc) crystalline
structure (Fig. 2d).
Fig. 1 X-ray diffraction pattern of CdS nanoparticles synthesized by
immobilized R. sphaeroides at 42 h
Fig. 2 The product of CdS
nanoparticles synthesized by
immobilized R. sphaeroides at
42 h a HRTEM image at low
amplificatory times, b HRTEM
image at high amplificatory
times, c (111) lattice fringes of
denoted area (d
111
= 0.36 nm),
d the corresponding SAED
pattern
Nanoscale Res Lett (2009) 4:717–723 719
123
Biosynthesis Kinetics of CdS
To understand the synthesis process of CdS in a greater
detail, the kinetics of the formation of CdS by living
R. sphaeroides exposed to 1 mM CdCl
2
culture medium at
30 °C was followed by TEM. Figure 3a, b shows the thin
sections of CdS nano-R. sphaeroides cell as a function of
reaction time. At the beginning of reaction, the Cd cannot
be seen (Fig. 3a). At very early stage of reaction, the Cd
can be seen as dense population from the TEM images
(Fig. 3b). The result indicates that only a little of Cd
2?
is
carried into the R. sphaeroides cells. After 24 h of reaction,
the relative quantity of Cd
2?
are transported into the cell
and result in the increasing of Cd
2?
(Fig. 3c), but little CdS
deposits are obtained from extracellular resolution, and
most of Cd
2?
are in solution (Fig. 4). At 36 h, a lot of Cd
2?
is carried into the cell (Fig. 3d), much CdS deposits are
gained from extracellular resolution, and Cd
2?
in solution
are reduced to half of initial concentration (Fig. 4). At
42 h, the intracellular Cd decreases (Fig. 3e), and a large
population of CdS are visible in extracellular solution
(Fig. 4). At 48 h, the intracellular CdS is little (Fig. 3f),
and the CdS in extracellular resolution are observed in
large population (Fig. 4). The dynamic process of intra-
cellular Cd (including Cd
2?
and CdS) transported by living
R. sphaeroides, characterized by TEM, is allowed for the
observation of key intermediates and characteristics of the
carrying process of Cd
2?
from solution into cell.
At the same time, the chemical analysis of cell ultra thin
section of R. sphaeroides was performed by EDS. Figure 5
shows X-ray EDS analysis of R. sphaeroides cultivated in
Fig. 3 TEM images recorded
from thin sections of
R. sphaeroides cells after
reaction with CdCl
2
at different
times. a 0h,b 12 h, c 24 h,
d 36 h, e 42 h, f 48 h
0
0.2
0.4
0.6
0.8
1
0
content of cadmium in solution
content of Cds deposit
content of cadmium on the cells
12 24 36 42 48
0
0.2
0.4
0.6
0.8
1
t / h
Content of cadmium in solution (mM)
Content of cadmium in form of CdS (mM)
Content of cadmium on the cell (mM)
Fig. 4 Relations among content of cadmium in solution, CdS
deposit, and on the cell
720 Nanoscale Res Lett (2009) 4:717–723
123
culture medium in the absence or in the presence of 1 mM
Cd
2?
(circled in red, Fig. 3a, d). The strong signals in
Fig. 5b indicate the presence of Cd and S, and the ratio of
Cd:S is 0.97:1.00. The result shows that the deposit of CdS
has been synthesized in cells. However, there are not the
signals of Cd and S in Fig. 5 a. The presence of C and O in
Fig. 5 suggests the biomolecules in the R. sphaeroides
cells.
Size-Controlled Biosynthesis of CdS Nanoparticles
The growing phase of cells was found to be an important
factor in modulating the morphology of CdS nanoparticles
because they evidently affected the physiological parame-
ters of living E. coli [19]. Figure 6 shows TEM images of
the CdS nanoparticles formed by living immobilized
R. sphaeroides exposed to 1 mM culture medium of CdCl
2
at different culture times. The spherical CdS nanoparticles
with the average size of 2.3 ± 0.15, 6.8 ± 0.22, and
36.8 ± 0.25 nm were formed at 36, 42, and 48 h, respec-
tively, which indicates that the size of CdS nanoparticles
increases with the increasing culture time.
Previous studies indicated that cysteine desulfhydrase
was an important factor in the biosynthesis of metal sulfide
nanoparticles [15]. Also, we had confirmed that R. sph-
aeroides could secrete cysteine desulfhydrase (C–S-lyase)
being responsible for producing S
2-
[20]. The result shows
that the activity of cysteine desulfhydrase in R. sphaeroides
depends on culture time, and the activities at 36, 42, and
48 h are 32.6, 45.1, and 50.8 U g
-1
, respectively. Namely,
the activity of C–S-lyase at 36 h is lower than the ones at
42 h and 48 h. Hence, the reaction rate between cadmium
ions and S
2-
is very slow at 36 h, resulting in the formation
of CdS nanoparticles with small diameter. With the
increasing culture time, the enzyme activities and reaction
rate correspondingly increase, contributing to the formation
of thermodynamic-favored spherical particles. Thus, the
size-controlled biosynthesis of CdS nanoparticles using
immobilized R. sphaeroides could be obtained by simply
changing the culture time.
Optical Properties of CdS Nanoparticles
Moreover, the samples obtained at different culture times
exhibit excellent optical properties (see Fig. 7). The
absorption peaks of the products obtained at 36 and 42 h
are about 282 and 332 nm. The absorption peaks of CdS
are blue-shifted from the absorption peak of bulk CdS
Fig. 6 TEM images of the obtained CdS samples at different culture times. a 36 h, b 42 h, and c 48 h
Fig. 5 The X-ray EDS analysis
of cell ultra thin section of
R. sphaeroides cultivated in
culture medium in the absence
of Cd
2?
or containing 1 mM
Cd
2?
. a Circled in red, Fig. 3a,
b circled in red, Fig. 3d
Nanoscale Res Lett (2009) 4:717–723 721
123
(512 nm, E
g
= 2.43 eV). According to the spectrum, we
estimate the bandgap of CdS varied from 2.32 to 3.56 eV
when the grain size reduces from 6.8 ± 0.22 to 2.3 ±
0.15 nm. This clearly indicates the presence of quantum
size effects in the prepared CdS by the novel and simple
route. However, the product obtained at 48 h with the grain
size 36.8 ± 0.25 nm has a weak absorption at 506 nm,
which is near the absorption peak of bulk CdS [7].
The photoluminescence spectra measurements of CdS
nanoparticles synthesized at 36 and 42 h were carried using
the same excitation wavelength of 345 nm at room tem-
perature (see Fig. 8). The emission peaks at 382 and
406 nm correspond to the samples obtained at 36 and 42 h,
respectively. The emission peaks at 382 and 406 nm are
usually observed from the excitonic emission luminescence
of semiconductor nanoparticles [21]. With increasing
culture time, the fluorescence intensity remarkably
decreases and the emission peak is red shifted. The result
shows the change of bandgap of CdS nanoparticles and the
presence of size-dependent quantum confinement effects.
Conclusions
The present study demonstrated that size-controlled CdS
nanoparticles had been synthesized by living immobilized
R. sphaeroides. Also, the result showed that R. sphaeroides
could transport Cd
2?
into cell from solution and then
produced CdS. Finally, the CdS was carried to the extra-
cellular solution and formed nanoparticles. The size of CdS
nanoparticles biosynthesized by living immobilized
R. sphaeroides could vary with the culture time. The way
of the size-controlled biosynthesis of CdS nanoparticles by
simply changing culture time provides a fully green
approach for the biosynthesis modulation of nanomaterials.
Moreover, the UV–vis absorption spectra and photolumi-
nescence spectra showed that CdS nanoparticles exhibited
unique optical properties.
Acknowledgments We acknowledge the service rendered by the
Sophisticated Analytical Instrumentation Facility, Institute of Coal
Chemistry, CAS, Taiyuan, China, in analyzing the samples by TEM.
Financial supports from the Shanxi Provincial Key Technology R&D
Program of Shanxi (No. 20080311027-1), and National Key Tech-
nologies R&D Program of China (No. 2001BA540C) are gratefully
acknowledged.
References
1. K. Simkiss, K.M. Wilbur, Biomineralization (Academic Press,
New York, 1989)
2. S. Mann (ed.), Biomimetic Materials Chemistry (VCH Press, New
York, 1996)
3. A.P. Philipse, D. Maas, Langmuir 18, 9977 (2002). doi:10.1021/
la0205811
4. N. Kroger, R. Deutzmann, M. Sumper, Science 286, 1129 (1999).
doi:10.1126/science.286.5442.1129
5. J.A. Ascencio, Y. Mejia, H.B. Liu, C. Angeles, G. Canizal,
Langmuir 19, 5882 (2003)
6. V. Bansal, P. Poddar, A. Ahmad, M. Sastry, J. Am. Chem. Soc.
128, 11958 (2006). doi:10.1021/ja063011m
7. M. Kowshik, N. Deshmukh, W. Vogel, J. Urban, S.K. Kulkarni,
K.M. Paknikar, Biotechnol. Bioeng. 78, 583 (2002). doi:10.1002/
bit.10233
8. A. Ahmad, P. Mukherjee, D. Mandal, S. Senapati, M.I. Khan,
R. Kumar, M. Sastry, J. Am. Chem. Soc. 124, 12108 (2002). doi:
10.1021/ja027296o
9. C. Lang, D. Schu
¨
´
ler, D. Faivre, Macromol. Biosci. 7, 144 (2007).
doi:10.1002/mabi.200600235
10. A. Komeili, H. Vali, T.J. Beveridge, D.K. Newman, Proc. Natl.
Acad. Sci. USA 101, 3839 (2004). doi:10.1073/pnas.0400391101
11. S.Y. He, Y. Zhang, Z.R. Guo, N. Gu, Biotechnol. Prog. 24, 476
(2008). doi:10.1021/bp0703174
12. S.Y. He, Z.R. Guo, Y. Zhang, S. Zhang, J. Wang, N. Gu, Mater.
Lett. 61, 3984 (2007). doi:10.1016/j.matlet.2007.01.018
Fig. 7 Room-temperature UV–vis absorption spectra of the CdS
samples prepared at different culture times. a 36 h, b 42 h, and c 48 h
Fig. 8 Photoluminescence spectra excited by 345 nm of the CdS
samples prepared at different culture times. a 36 h and b 42 h
722 Nanoscale Res Lett (2009) 4:717–723
123
13. Z.Y. Yao, Z.M. Zhang, Chin. J. Appl. Environ. Biol. 2, 84 (1996)
14. H. Nagadomih, T. Hiromitsu, K. Takeno, M. Watanabe, K. Sasaki,
J. Biosci. Bioeng. 87, 189 (1999). doi:10.1016/S1389-1723(99)
89011-2
15. C.L. Wang, D.S. Clark, J.D. Keasling, Biotechnol. Bioeng. 75,
285 (2001). doi:10.1002/bit.10030
16. State Environmental Protection Administration of China (eds.),
Methods of Monitoring and Analyzing for Water and Wastewater,
4th edn. (China Environmental Science Press, Beijing, 2002),
pp. 323–326 (in Chinese)
17. L. Chu, J.L. Ebersole, G.P. Kurzban, S.C. Holt, Infect. Immun.
65, 3231 (1997)
18. J.H. Chen, L. Tao, J. Li, Biochemistry Laboratory, 6th edn.
(Science Press, Beijing, 2006), pp. 63–64 (in Chinese)
19. R.Y. Sweeney, C. Mao, X. Gao, J.L. Burt, A.M. Belcher,
G. Georgiou, B.L. Iverson, Chem. Biol. 11, 1553 (2004). doi:
10.1016/j.chembiol.2004.08.022
20. H.J. Bai, Z.M. Zhang, G.E. Yang, B.Z. Li, Bioresour. Technol.
99, 7716 (2008). doi:10.1016/j.biortech.2008.01.071
21. A. Datta, A. Saha, A.K. Sinha, S.N. Bhattacharyyaa, S. Chat-
terjee, J. Photochem. Photobiol. B 78, 69 (2005). doi:10.1016/
j.jphotobiol.2004.10.001
Nanoscale Res Lett (2009) 4:717–723 723
123