Báo cáo hóa học: " Effect of Cationic Surfactant Head Groups on Synthesis, Growth and Agglomeration Behavior of ZnS Nanoparticles" pot
Bạn đang xem bản rút gọn của tài liệu. Xem và tải ngay bản đầy đủ của tài liệu tại đây (784.93 KB, 12 trang )
NANO EXPRESS
Effect of Cationic Surfactant Head Groups on Synthesis, Growth
and Agglomeration Behavior of ZnS Nanoparticles
S. K. Mehta Æ Sanjay Kumar Æ Savita Chaudhary Æ
K. K. Bhasin
Received: 24 December 2008 / Accepted: 15 June 2009 / Published online: 1 July 2009
Ó to the authors 2009
Abstract Colloidal nanodispersions of ZnS have been
prepared using aqueous micellar solution of two cationic
surfactants of trimethylammonium/pyridinium series with
different head groups i.e., cetyltrimethylammonium chloride
(CTAC) and cetyltrimethylpyridinium chloride (CPyC). The
role of these surfactants in controlling size, agglomeration
behavior and photophysical properties of ZnS nanoparticles
has been discussed. UV–visible spectroscopy has been car-
ried out for determination of optical band gap and size of ZnS
nanoparticles. Transmission electron microscopy and
dynamic light scattering were used to measure sizes and size
distribution of ZnS nanoparticles. Powder X-ray analysis
(Powder XRD) reveals the cubic structure of nanocrystallite
in powdered sample. The photoluminescence emission band
exhibits red shift for ZnS nanoparticles in CTAC compared
to those in CPyC. The aggregation behavior in two surfac-
tants has been compared using turbidity measurements after
redispersing the nanoparticles in water. In situ evolution and
growth of ZnS nanoparticles in two different surfactants
have been compared through time-dependent absorption
behavior and UV irradiation studies. Electrical conductivity
measurements reveal that CPyC micelles better stabilize the
nanoparticles than that of CTAC.
Keywords ZnS nanoparticles Á CTAC Á CPyC Á
Turbidity Á UV irradiation Á Photoluminescence Á
Redispersion
Introduction
The synthesis of ultrafine semiconducting particles is of
great technological and scientific interest due to their
superior physical and optical properties. Zinc sulfide (ZnS)
is an important wide band gap (3.60 eV) semiconductor
and used as a key material for large range of applications
[1–3]. Over the years, attempts have been made to prepare,
stabilize and isolate homogeneously dispersed ZnS nano-
particles with and without capping agents [4–7]. When
these clean nanoparticles aggregate, they lose their nano-
scale sizes and corresponding properties. Therefore, in
addition to tune particle size, a low degree of agglomera-
tion and monodispered size distribution are desirable to
enable homogeneous arrangement of particles. Due to
partially satisfactory results, available methods still repre-
sents a major challenge to date and ultimate aim of the
current research in material science is to understand the
mechanisms that determine the crystal habitat and shape of
the crystal. In last few years, extensive structural, kinetic
and thermodynamic studies have been performed to
explore the fundamental understanding of surfactant–water
system including the effect of additives on micellization
[8–10]. However, still there are conflicting opinions on
some aspects particularly, the studies regarding factors
controlling the synthesis and stabilization of nanoparticles
in aqueous surfactant solutions. Therefore, it is quite dif-
ficult to scale up a general method for the nanoparticles
synthesis using surfactants, because numerous parameters
with different influences enter in to consideration, while
studying a particular system.
One interesting aspect, which shouldbe mainly considered,
is directly related to particle size control by the adsorption of
surfactant onto the particles surface. Among several methods
to prevent self-aggregation of nanoparticles, coating with
Electronic supplementary material The online version of this
article (doi:10.1007/s11671-009-9377-8) contains supplementary
material, which is available to authorized users.
S. K. Mehta (&) Á S. Kumar Á S. Chaudhary Á K. K. Bhasin
Department of Chemistry, Centre for Advanced Studies in
Chemistry, Panjab University, Chandigarh 160014, India
e-mail:
123
Nanoscale Res Lett (2009) 4:1197–1208
DOI 10.1007/s11671-009-9377-8
surfactants, where one end of the surfactant chain is anchored
to particle surface and other end is free, is simple and effective
method to first give one dimensionally ordered self-assembly
and then higher dimensional close-packed superlattice [11].
The surfactant coating on nanoparticles changes their aggre-
gation behavior due to changed interparticle potential.
Therefore, different types of surfactants, depending upon their
molecular structures, may tune the interparticle interactions to
different extent and hence have different tendency to prevent
the nanoparticles aggregation. Apart from the synthesis pur-
pose, surfactants have been used in association with nano-
particles for variety of studies [12, 13]. Zaman et al. [14]has
investigated the interparticle forces and stability of silica
dispersions in C
12
TAB through turbidity and viscosity mea-
surements. Keeping in view the importance of surfactant–
nanoparticles system, it would be very interesting to know
whether there is any influence of surfactant structure on size,
shape, stability and other properties of nanoparticles. A
comparative study of a particular system in different surfac-
tants can provide a better insight into the nanoparticles sta-
bility and properties. Naskar et al. [15] compared effect of two
nonionic surfactant stabilized emulsions on ZnS nanoparticles
size. Shao et al. [16] studied the role of oleic acid and TOP on
growth and agglomeration behavior of cobalt nanoparticles
synthesized via thermal decomposition. However, there is
hardly any report on the comparative studies of ZnS nano-
particles in cationic surfactants till date.
The present report explores the stabilization mechanism
and other characteristics of ZnS nanoparticles in the
aqueous micellar solution of cationic surfactants. Two
cationic surfactants from quaternary ammonium series viz.
cetyltrimethylammonium chloride (CTAC) and cetylpyri-
dinium chloride (CPyC) have been used for the synthesis of
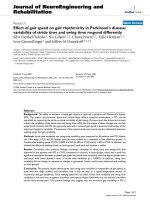
ZnS nanoparticles. Figure 1 depicts the molecular structure
of the amphiphiles, CTAC and CPyC, where hydrophilic
ammonium and pyridinium groups act as ‘polar head,’ and
the hydrophobic hydrocarbon chain of sixteen carbons acts
as ‘non-polar tail’. Both the surfactants chosen are having
same hydrocarbon chain length (C
16
) and counter ion
(Cl
-
), but different head groups. Various aspects related to
synthesis and characterization of ZnS nanoparticles have
been discussed and compared. The effect of type of sur-
factants (with different head group) on agglomeration
behavior and photophysical properties of ZnS nanoparticles
has also been analyzed.
Materials and Methods
Chemicals
For the synthesis of ZnS nanoparticles, Zn(OAc)
2
Á2H
2
O
(99.5%), Na
2
SÁxH
2
O (55–58% assay), all were of analyti-
cal grade obtained from central drug house (CDH). The
surfactants, CTAC (99%) and CPyC (99%), were obtained
from Fluka and Himedia, respectively. All reagents were
used as received, without further purification. The solvents
acetone and ethanol were AR grade products.
ZnS Nanoparticle Synthesis
Two micellar solutions of CTAC (3 mM), one containing
Zn(OAc)
2
Á2H
2
O (0.025 M) and another containing
Na
2
SÁxH
2
O (0.025 M), were prepared in double-distilled
water. The synthesis of ZnS nanoparticles was performed
by two-step procedure. The first step involves the genera-
tion of the S
2-
-surfactant complex by adding aqueous
sodium sulfide (0.025 M) to aqueous surfactant solutions.
In the second step, dropwise addition of aqueous micellar
solution containing Zn(OAc)
2
(0.025 M) into the above
solution with constant stirring at ambient temperature leads
to the formation of ZnS nanoparticles. The homogeneous
solution was then allowed to stand for 30 min at room
temperature. The dispersions were found to be stable for
months together. The nanoparticles were separated by slow
evaporation of solvent at 50–60 °C. The collected solid
product was washed with double-distilled water and etha-
nol and then vacuum dried for 48 h. We also tried ultra-
centrifugation, but nanoparticles got badly agglomerated.
Similar procedure was followed for the synthesis of ZnS
nanoparticles in CPyC.
Characterization Methods
UV–vis Absorption Spectroscopy
Optical spectra of the nanodispersions were taken with a
JASCO-530 V spectrophotometer in quartz cuvette of
1 cm path length. For time-dependent absorption mea-
surements, two solutions were mixed and immediately
N
+
Cetyltrimethylammonium chloride(CTAC)
cmc = 1.3mM
N
+
Cl
-
Cl
-
Cetylpyridinium Chloride(CPyC)
cmc = 0.96mM
(b)
(a)
Fig. 1 Molecular structure of (a) CTAC and (b) CPyC
1198 Nanoscale Res Lett (2009) 4:1197–1208
123
transferred to quartz cuvette. The mixing time was about
40–45 s before starting the absorbance measurement. The
measurements were then taken at the rate of 12 measure-
ments per minute. UV irradiation experiments were carried
out in Popular India UV cabinet.
Electron Microscopy
Transmission electron microscopy (TEM) micrographs
were taken using Hitachi (H-7500) transmission electron
microscope operating at 80 kV. Samples for TEM studies
were prepared by placing a drop of nanodispersion on a
carbon-coated Cu grid, and the solvent was evaporated at
room temperature. SEM images of powdered sample were
taken using JEOL (JSM-6100) scanning microscope.
Dynamic Light Scattering
The dynamic light scattering (DLS) measurements were
taken on ALV-5000 with Nd:YAG laser with a wavelength
of 532 nm. Multiple tau digital correlation was measured at
the minimum sampling of 6.25 ns using a dual auto cor-
relation mode on an ALV-5000 correlator board. All
measurements were taken at scattering angle of 90° for
different suspensions. A sample cell was set in the toluene
bath for index matching with the quartz. The temperature
was maintained at 25 °C in the toluene bath.
X-Ray Diffraction Studies
Powder XRD studies were carried out using Panalytical, D/
Max-2500 X-Ray Diffractometer equipped with Cu-ka
radiation (k = 1.5418 A
˚
) employing a scanning rate of
0.02° s
-1
. Si was used as standard to determine the
instrumental broadening, and the (111) reflection was
analyzed. The D2h for the silicon peak was about 0.06 (h),
and a simple instrumental correction was carried out by
subtracting this value from the D2h values corresponding
to the diffraction peaks obtained for our samples.
FTIR Spectroscopy
FTIR spectra of dried ZnS nanoparticles were recorded
with Perkin Elmer RX-1 spectrophotometer in frequency
range of 4,000–900 cm
-1
. Small amount of sample was
mixed with 2–3 drops of CCl
4
to form a thick paste. The
paste was then applied on NaCl plates to record the spectra.
Photoluminescence Spectroscopy
The PL spectra were recorded on Varian fluorescence
spectrophotometer. The excitation wavelength of 320 nm
was used, and PL emission was recorded in 330–560 nm
range.
Turbidity Measurements
Turbidity measurements of redispersed ZnS nanopowder
were taken in a digital turbidity meter (Decibel Instruments)
with an accuracy of ±3% of full-scale deflection. Powdered
ZnS nanoparticles (0.04 g) were dispersed in 35 mL water
and sonicated for 30 min, then kept undisturbed in glass
cuvette in the cuvette holder of turbidity meter. Turbidity of
solution (in NTU) was noted after regular intervals.
Conductivity Measurements
The specific conductivity measurements of aqueous sur-
factant solutions in the presence of ZnS nanoparticles were
measured using PICO digital conductivity meter operating
at 50 Hz from Lab India instruments with an absolute
accuracy of ±3%. Platinised platinum electrode was
inserted in a double-walled vessel containing the solution
in which the thermostated water was circulated. The con-
ductivity cell was calibrated with standard KCl solutions,
and the obtained cell constant was 1.02 cm
-1
.
Results and Discussion
Formation of ZnS Nanoparticles and Optical
Characterization
The formation of ZnS nanoparticles can be represented as
of elementary ionic reaction
Zn
2þ
aqueous micelleðÞþS
2À
aqueous micelleðÞ
! ZnS NPsðÞ:
Theoretically, the ratio [Zn(OAc)
2
]:[Na
2
S] required
seems to be 1:1. But actually [S
2-
] \ [Na
2
S], because
aqueous solution of Na
2
S contained both aqueous H
2
S and
HS
-
and other sulfur oxyions such as thiosulfate and
sulfite, originating either as impurities in solid Na
2
Sor
from rapid oxidation of HS
-
by O
2
[17]. Based on the test
experimental results, the ratio [Zn(OAc)
2
]:[Na
2
S] = 1:2
was found to be the optimum. The volume of the solutions
was adjusted so as to get final concentration,
[Zn(OAc)
2
] = 2 mM. The adsorption of surfactant
molecules onto the particles surface restricts their
unlimited growth. The particle size was further tailored
by using two surfactants with different head group, keeping
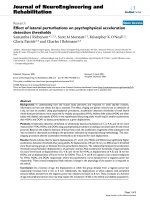
other parameters unaltered. To investigate the optical
properties of as-prepared ZnS nanoparticles dispersed in
aqueous micellar solution of CTAC and CPyC, UV–vis
absorption spectra were recorded as shown in Fig. 2a. Both
Nanoscale Res Lett (2009) 4:1197–1208 1199
123
the curves exhibit well-defined absorption shoulder with
band edge located at 326 nm in CTAC and at 318 nm in
CPyC, which are considerably blue shifted as compared to
bulk ZnS (340 nm) due to quantum confinement of ZnS
nanoparticles [18]. The optical band gap of the
nanoparticles has been evaluated from the Tauc relation
[19].
ðehmÞ¼Cðhm À E
g
Þ
m
ð1Þ
where C is a constant, e is molar extinction coefficient, E
g
is optical band gap of the material and m depends on the
type of transition. The value of molar extinction coefficient
for the synthesized nanoparticles is more than 900; thus, we
can assume that the transitions in the nanocrystals are
allowed direct transitions [20]. For m = , E.
g
in Eq. 1 is
directly allowed band gap. The optical band gap was
estimated from the linear portion of the (ehm)
2
versus hm
plots shown in Fig. 2b. From Tauc plots, optical band gap
values for ZnS nanoparticles prepared in CTAC and CPyC
were estimated to be 3.92 ± 0.01 and 3.98 ± 0.01 eV,
respectively. From the band gap values, the sizes of
nanoparticles calculated using Wang equation [21] were
found to be 6.55 ± 0.05 nm in CTAC and 5.90 ± 0.05 nm
in CPyC, respectively.
Electron Microscopy and DLS
The average particle size and size distribution were esti-
mated by the combination of TEM and DLS analysis.
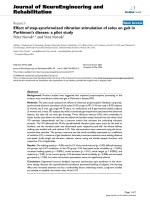
Figure 3 shows the representative TEM images of ZnS
nanoparticles prepared in CTAC and CPyC micellar media
and their respective DLS plots. As evident from the ima-
ges, the particles are roughly spherical in shape and poly-
dispersed with average particle size in the range of 3–8 nm.
Few particles tend to form irregular aggregates, which are
seen as large particles in both the images. However, it was
observed that ZnS particles prepared in the presence of
CTAC have greater agglomeration tendency (Fig. 3a)
when compared to those prepared in CPyC. Furthermore,
DLS clearly shows narrow size distribution of ZnS nano-
particles in CPyC when compared to that in CTAC with
diameters in the range 5–21 ± 2 nm and 4–63 ± 3 nm,
respectively. The intensity-weighed analysis indicates that
most of the ZnS nanoparticles in aqueous micellar solution
of CTAC and CPyC have a diameter of 9 ± 3 nm and
7 ± 3 nm, respectively. The range of sizes estimated from
UV–vis spectroscopy, TEM and DLS can be considered to
be in good agreement, although the three techniques ana-
lyze particle sizes differently. DLS analyses include the
surfactant shell and determine hydrodynamic size, UV–vis
analyses include quantum mechanical calculations based
on light absorption; whereas using TEM we can directly
look at ZnS core. The surface morphology of washed and
dried samples prepared in aqueous micellar solution of
CTAC and CPyC was studied by using a scanning electron
microscope (SEM). Figure S1 (supplementary material)
shows the SEM micrographs of ZnS nanoparticles sepa-
rated from CTAC and CPyC micellar solution. It shows
that the particles are roughly spherical in shape.
3.7 3.9 4.1 4.3 4.5 4.7 4.9
0
1
2
3
4
(b)
ZnS NPs + CTAC
ZnS NPs + CPyC
(εhυ)
2
x 10
7
(M
-1
cm
-1
eV)
2
hυ (eV)
250 300 350 400
0.0
0.2
0.4
0.6
0.8
1.0
1.2
(a)
Absorbance (a.u.)
Wavelength (nm)
ZnS NPs + CTAC
ZnS NPs + CPyC
Fig. 2 (a) Absorption spectra
of as-prepared ZnS
nanoparticles in aqueous
micellar solution CTAC and
CPyC. (b) Respective Tauc
plots for the determination of
the band gap of ZnS
nanoparticles
1200 Nanoscale Res Lett (2009) 4:1197–1208
123
X-Ray Diffraction Studies
To investigate the crystalline structure of the product,
powder XRD measurements were taken at room tempera-
ture. The X-ray diffraction patterns of powdered ZnS
nanoparticles prepared in CTAC and CPyC are shown in
Fig. 4, and the peaks are well indexed into pure zinc blend
structure (JCPDS powder diffraction file no. 5-0566).
Three diffraction peaks observed at 28.5°, 47.6° and 56.4°
in both the samples corresponds to (111), (220) and (311)
planes, respectively. The broadening of powder XRD peaks
indicates that the particle sizes are in nanometer range.
Clearly, the peaks in Fig. 4b are a little broader than that in
Fig. 4a indicates that the particles prepared in presence of
CPyC are slightly smaller when compared to those pre-
pared in CTAC. The average crystallite size was deter-
mined from the full width at half maxima (FWHM) of the
diffraction peaks using Debye-Scherrer formula [22].
D ¼
ak
bCosh
ð2Þ
where D is mean crystallite diameter, a is a geometrical
factor (a = 0.94), k is the wavelength of X-rays used for
analysis and b is full width at half maxima (FWHM) of
peaks. Here, h corresponding to (111) reflections of powder
XRD pattern have been used to calculate the nanoparticle
size. In almost all cases, line broadening occurs due to
simultaneous size and strain effects [23]. Therefore, we
0.1 1 10 100 1000 10000
0.0
0.2
0.4
0.6
0.8
1.0
Intensity (%)
Size (nm)
0.0
0.2
0.4
0.6
0.8
1.0
Intensity (%)
0.1 1 10 100 1000 10000
Size (nm)
(a)
(b)
Fig. 3 TEM micrographs and intensity-weighed size distribution using DLS of the ZnS nanoparticles prepared in 3 mM aqueous solution of (a)
CTAC and (b) CPyC
Nanoscale Res Lett (2009) 4:1197–1208 1201
123
have also used another method, i.e., the Williamson-Hall
plots to separate the contribution due to strain (e) and
crystallite size (D) toward line broadening. The
Williamson-Hall equation is expressed as follows [24]:
bCosh ¼
ak
D
þ 2eSinh ð3Þ
Figure 5 represents the plot of bCosh versus 2Sinh. The
slope of the linear fit gives the amount of strain, and from
the intercept on bCosh axis, crystallite size can be calcu-
lated. The average crystallite sizes and amount of strain
calculated on the basis of powder XRD analysis of ZnS
nanoparticles synthesized in CTAC and CPyC are pre-
sented in Table 1. The powder XRD analysis reveal that
during separation and drying process particles grew and
size became almost double when compared to that calcu-
lated on the basis of UV absorption spectra in both the
surfactants.
Turbidity Measurements
Turbidity is an expression of optical property that uses light
scattering properties of suspensions in the sample. The
stability of powdered ZnS nanoparticles, when redispersed
in water, has been studied using turbidity measurements.
We have also tried other organic solvents for redispersion
studies, but particles settled down within 5–10 min. As the
particles settled down turbidity goes on decreasing, and this
decrease in the turbidity value with time can be used to
calculate the fraction of particles that remains suspended in
water for long time. The turbidity results for ZnS nano-
particles prepared in CTAC and CPyC are presented in
Fig. 6. Initially, a sharp decrease in turbidity was observed
because the bigger particles settled down immediately. On
the basis of decrease in turbidity values, it was calculated
20 30 40 50 60 70
(311)
(220)
(111)
(b)
(a)
Intensity (a.u.)
2θ (degrees)
Fig. 4 Powder XRD patterns of the powdered ZnS nanoparticle
prepared in (a) CTAC and (b) CPyC
0.4 0.5 0.6 0.7 0.8 0.9 1.0
0.0120
0.0125
0.0130
0.0135
0.0140
0.0145
0.0150
0.0155
0.0160
(b)
(a)
βCosθ
2 Sinθ
0.5 0.6 0.7 0.8 0.9 1.0
Fig. 5 Williamson-Hall plots
of powder XRD data of ZnS
nanoparticles prepared in (a)
CTAC and (b) CPyC
Table 1 Average crystallite sizes and amount of strain of ZnS
nanoparticles calculated on the basis of powder XRD analysis
Surfactant D
S
(nm) D
WH
(nm) Strain (910
-3
)
CTAC 11.0 ± 0.2 13.4 ± 0.3 4.6 ± 0.6
CPyC 10.8 ± 0.2 13.1 ± 0.3 4.3 ± 0.6
D
S
, crystallite diameter calculated from Debye-Scherrer formula;
D
WH
, crystallite diameter calculated from Williamson-Hall plots
1202 Nanoscale Res Lett (2009) 4:1197–1208
123
that 22.5% particles in CTAC and 20.4% in CPyC settled
down with in 2.5 h. Clearly, both the samples show
exponential decrease in turbidity, and decay was found to
be more rapid for ZnS nanoparticles prepared in CTAC
than those prepared in CPyC. Calculations based up on
decrease in turbidity values show that after 60 h, about
58.7% nanoparticles prepared in CPyC remained sus-
pended in water when compared to only 28.2% of those
prepared in CTAC.
The turbidity results therefore reveal that ZnS nano-
particles prepared in aqueous micellar solution of CPyC do
not form permanent aggregates during separation and
drying process and have good redispersion tendency when
compared to those prepared in aqueous micellar solution of
CTAC. It can be thought that the adsorbed surfactant
molecules remained intercalated between the particles
during separation and drying process, preventing their
permanent fusion to form bigger particles and get redi-
spersed when dissolved in water. The presence of surfac-
tant molecules in powdered nanoparticles has also been
evidenced from FTIR studies.
FTIR Analysis
The mode of anchoring of CTAC and CPyC onto the
surface of synthesized ZnS nanoparticles was examined by
recording their FTIR spectra. The FTIR spectra of pure
surfactant and solid capped samples prepared in aqueous
micellar solution of CTAC and CPyC are given in Fig. 7.
Clearly, a broad peak at 3,400–3,430 cm
-1
due to O–H
stretching has been observed in all the samples because of
some absorbed moisture. By comparing these spectra with
that of pure surfactants, it was found that there has been
significant shift in peaks due to –C–N stretching, –C–H
scissoring vibrations of –N–CH
3
moiety and –C=C–
stretching in pyridinium ring in the presence of ZnS.
However, the peaks due to –C–H stretching of hydro-
carbon tail remained unaffected. The detailed assignment
of FTIR peaks of CTAC and CPyC in the presence and
absence of ZnS nanoparticles are given in Table 2 [25–27].
These observations reveal that in both the cases capping of
nanoparticles was due to adsorption of surfactant mole-
cules through head groups. Hence, the surface passivation
of ZnS nanoparticles by surfactant adsorption makes them
0 500 1000 1500 2000 2500 3000
100
200
300
400
500
600
ZnS NPs (CTAC)
ZnS NPs (CPyC)
Turbidity (NTU)
Time (min)
Fig. 6 Decrease in turbidity of ZnS nanoparticles (redispersed in
water) as a function of time
4000 3500 3000 2500 2000 1500 1000
1245
1450
1548
2851
2909
1241
997
1353
1552
2347
2851
2909
CTAC+ZnS
CTAC
Transmittance (%)
Wavenumber (cm
-1
)
2347
1065
1248
1552
1064
1476
1629
2159
2347
2851
2909
2851
2909
CPyC
CPyC+ZnS
Fig. 7 FTIR spectrum of pure
surfactants and ZnS
nanoparticles prepared in CPyC
and CTAC
Nanoscale Res Lett (2009) 4:1197–1208 1203
123
aggregation resistant. Furthermore, the peak –C=C–
stretching in lewis-bonded pyridinium (1629 cm
-1
) has
been completely diminished in the presence of nanoparti-
cles showing stronger adsorption of CPyC onto the parti-
cles surface when compared to that of CTAC.
Photoluminescence Studies
The photoluminescence (PL) emission is one of the most
important physical properties in ZnS nanoparticles and
depends upon synthesis conditions, shape, size and ener-
getic position of the surface states [28–30]. The photolu-
minescence spectra of as-prepared ZnS nanoparticles in
aqueous micellar solution of CTAC and CPyC are pre-
sented in Fig. 8. In both the samples, excitation wavelength
of 320 nm was used. PL spectra of aqueous surfactant
solutions without nanoparticles were also recorded and
showed no emission at same excitation. Dangling bonds
[31] are found on the surface of most crystalline materials
due to the absence of lattice atoms above them. The surface
tends to reconstruct or adsorb some other species to reduce
the surface energy. The emission band at 359 and 352 nm
for the samples prepared in CTAC and CPyC, respectively,
may be due to the dangling bond of cationic surfactant head
group linked with S
2-
at ZnS nanoparticle surface [31].
The red shift in emission peak at 359 nm for ZnS prepared
in CTAC compared to that of at 352 nm for CPyC capped
nanoparticles explains the formation of smaller-sized ZnS
nanoparticles in CPyC.
The synthesized ZnS nanoparticles are found to have
cubic crystal lattice, and Schottky defects are dominant in
cubic ZnS [32]. Therefore, deep traps in cubic ZnS involve
Zn
2?
and S
2-
vacancies. The broad, low intense, deep trap
emission band at *424 nm reveals few defects in the
synthesized nanoparticles in both the surfactants [33].
Furthermore, the narrow emission band indicates the for-
mation of nanoparticles with narrow size distribution [34].
The PL intensity of ZnS nanoparticles prepared in CPyC
was found to be less, because of the interactions between
pyridine and surface point defects of ZnS nanoparticles.
The CPyC is effective in quenching the luminescence [31]
due to the ability of N-atom in pyridinium cation to seize
the electrons from the surface states of nanoparticles
making the electron transfer easy. These results indicate
that the photophysical properties of ZnS nanoparticles
depend up on the size and surface passivation, which might
help to further understand the physical mechanism of ZnS
nanoparticles that give rise to PL properties.
Kinetics of Particle Formation
The process of nucleation and growth during particle for-
mation in two surfactants was monitored using UV–vis
spectroscopy. The UV absorbance is a function of con-
centration and size of nanoparticles. Therefore, time-
dependent absorption of ZnS nanoparticles can be used to
compare the evolution and growth of nanoparticles in the
Table 2 Assignment of FTIR
peaks of CTAC and CPyC
capped ZnS nanoparticles
t
A
, asymmetric stretching; t
S
,
symmetric stretching; t
Anti
,
antisymmetric stretching; t
Py
,
lewis-bonded pyridine; d
S
,
scissoring; t
Ar
, aromatic; t
R
,
rocking
Peak assignment Peak position (cm
-1
)
CTAC CTAC ? ZnS NPs CPyC CPyC ? ZnS NPs
t
A
(–CH
2
) 2,909 2,910 2,913 2,914
t
S
(–CH
2
) 2,850 2,851 2,849 2,848
t
Anti
(CO
2
) 2,347 2,347 2,347 2,348
t
Py
(C=C) – – 1,629 –
d
S
(–C–H) 1,542, 1,470 1,552 1,466 1,552
t
Ar
(C=C,C–N) – – 1,373, 1,315 1,353
t
Str
(C–N, C–C) 1,243, 1,215 1,248 1,245 1,241
t
R
(–CH
2
) 985 1,065 1,067 997
325 350 375 400 425 450 475
ZnS NPs in CTAC
ZnS NPs in CPyC
Intensity (a.u.)
Wavelength (nm)
Fig. 8 PL spectra of ZnS nanoparticles prepared in aqueous micellar
solution of CTAC and CPyC
1204 Nanoscale Res Lett (2009) 4:1197–1208
123
presence of the surfactants. The shoulder at 294 nm in UV–
vis spectra (Fig. 2) is characteristic for ZnS nanoparticles.
Any change in its position and absorbance can be taken as
an indicative of growth process. The growth-dependent
shift in UV–vis spectra of as-prepared ZnS nanoparticles in
aqueous CPyC and CTAC as a function of time elapsed
after the reaction starts has been represented in Fig. S3
(supplementary material). Ten spectra of ZnS nanoparticles
in each surfactant were recorded at an interval of 2 min.
The typical shoulder due to ZnS has progressively red
shifted with time, and the red shifts become very small
after 20 min in both the surfactants (Fig. S3). The absor-
bance of the shoulder also follows nearly same trend. To
confirm this behavior, the time evolution of the absorbance
at 294 nm for ZnS nanoparticles in aqueous solution of
CTAC and CPyC was also monitored, and the results are
shown in Fig. 9. In this experiment, the particles were
produced by quickly adding the aqueous micellar solution
containing Zn
2?
in to those having S
2-
ions. The resultant
solution was then immediately transferred to quartz cuvette
for absorbance measurements at fixed wavelength of
294 nm. The mixing time was about 40–45 s before start-
ing the absorbance measurement. Therefore, time ‘zero’
was on the order of 40–45 s after mixing. The reaction was
monitored for 100 min. It can be observed that the nucle-
ation takes place very rapidly (within 40–45 s) in both the
surfactants, and then growth rate goes on decreasing with
time (Fig. 9). The red shift in the spectra (Fig. S3) can be
interpreted in terms of a growing process of the ZnS
nanoparticles and increase in absorbance as increase in
concentration of absorbing ZnS nanoparticles. Moreover,
the red shift has only been observed in 260–300 nm region
and not in the whole of the spectra. This means that during
growth process the particle sizes of some particles increase
producing more number of particles that absorb in
260–300 nm region only. Interestingly, in the presence of
CPyC, the absorbance decreases after reaching a plateau
region of maximum value within 15–20 min (Fig. 9). This
decrease in absorbance has been attributed to UV-induced
photodegradation of ZnS nanoparticles [35].
However, decrease in absorbance was not observed for
ZnS nanoparticles synthesized in the presence of CTAC. At
first sight, ZnS nanoparticles in CTAC seem to be resistant
toward UV-induced degradation. However, CTAC cannot
shield the ZnS nanoparticles from UV light, as it does not
absorb the UV light. To further confirm this behavior, UV
irradiation studies were carried out on ZnS nanoparticles
for different durations in both the surfactants at an irradi-
ation wavelength of 254 nm, and the observations are
presented in Fig. 10. It is clear that the reverse phenome-
non of the growth process observed in Fig. S3 has hap-
pened i.e., UV light degrades the particles leading to
decrease in their size that causes blue shift in the spectra. In
addition, according to Lambert–Beer law for quantitative
determination of concentrations of the absorbing species in
solution, the absorbance is directly proportional to the
concentration of absorbing species i.e., concentration of
ZnS nanoparticles in this particular case. To support this
view, UV–vis spectra of ZnS nanoparticles at different
concentrations were also recorded in both the surfactants
(Fig. S4, supplementary material). It shows a decrease in
absorbance with decrease in the concentration of ZnS
nanoparticles. Therefore, the small blue shift in absorption
shoulder and decrease in absorbance with irradiation time
confirm that some of the ZnS nanoparticles become smal-
ler, and the concentration of absorbing particles decreases
in both the surfactants.
Although UV light affects ZnS nanoparticles in both the
surfactants; however, the effect seems to be more pro-
nounced in CPyC than in CTAC. The growth of ZnS
nanoparticles and the degrading effect of UV light can be
correlated to explain the resultant evolution of ZnS nano-
particles in aqueous micellar solutions as:
(1) The growth of ZnS nanoparticles in CTAC is faster
than UV-induced decay, and resultant effect seems to
increase in absorbance only. On the other hand, in the
presence of CPyC, nanoparticles growth is slow and
decreases with time. At one stage, the nanoparticles
growth becomes so slow that UV-induced decay
overcomes the growth, and overall effect remains
decay only.
(2) The UV light can degrade the nanosized particles
much faster due to their large surface area [36]. The
fast growth in the case of CTAC leads to larger size
particles (small surface area) and, therefore, UV light-
induced decay is slow when compared to growth. On
the other hand, in CPyC, the surfactant molecules
020406080100
0.83
0.85
0.87
0.89
0.91
0.93
0.95
ZnS NPs in CTAC
ZnS NPs in CPyC
Absorbance (a.u.)
Time (min)
Fig. 9 UV absorbance of as-prepared ZnS nanoparticles in aqueous
solution of CTAC and CPyC measured at 294 nm as function of time
Nanoscale Res Lett (2009) 4:1197–1208 1205
123
stabilize the particles at small size (large surface
area), and hence the particles are more prone to decay
due to their large exposed surface area to UV light.
Even some of the small particles disappeared leading
to decrease in absorbance. In addition, the head group
area of CPyC is more when compared to that of
CTAC [37, 38]. Therefore, the particles could not
grow and got stabilized at smaller size due to
adsorption of large head group of CPyC.
Furthermore, the effect of UV radiation of two different
wavelengths (254 and 365 nm) on ZnS nanoparticles has
also been investigated. The plots are shown in Fig. S2
(supplementary material). The results depict that short
wavelength or high energy radiations degrade the nano-
particle to a larger extent than longer wavelength (low
energy) radiations irrespective of the nature of surfactants.
Aggregation Behavior of Surfactants in Presence
of ZnS Nanoparticles
The aggregation behavior of both the surfactants in the
presence of respective nanoparticles has also been studied.
When dissolved in water at a concentration below critical
micellar concentration (cmc), the surfactant behaves as a
strong electrolyte, whereas above the cmc, the monomers
form aggregates called micelles. The process of aggrega-
tion is affected due to temperature, solvents and presence
of any other external entity.
The physical properties of surfactants such as conduc-
tivity, viscosity, surface tension, osmotic pressure and
turbidity, etc., when plotted as a function of concentration,
show a break and any of these can be used to determine the
cmc [39]. Here, electrical conductivity method has been
used to study the aggregation behavior of surfactant in the
presence of ZnS nanoparticles prepared in respective sur-
factants. The changes in conductivity were measured dur-
ing titration of surfactant into 5 mM aqueous ZnS solution
at 298.15 K, and the results are presented in Fig. 11. The
overall increase in conductivity of surfactants in the studied
range is due to conducting nature of charged nanoparticles
dispersed in surfactant solution. In the presence of ZnS
nanoparticles, the process of micellization takes place prior
to that of free micelles. The decrease in cmc values of the
surfactants in the presence of some additives has been
attributed to the screening of surface charge of micelles
[39]. The decrease in cmc values in the presence of ZnS
nanoparticles indicates that the presence of nanoparticles
provides the driving force for micellization. Therefore,
micellization is expected to takes place earlier than in free
micelles. The driving force for early micellization may be
due to the screening of surface charge; however, more
detailed investigation is required to validate such interest-
ing behaviors and hypothesis.
Figure 11a depicts that ZnS nanoparticles (synthesized
in CTAC) are better dispersed in aqueous solution of
CTAC until cmc. After that nanoparticles settled down, and
CTAC micelles behave like that of pure CTAC. It indicates
that soon after the formation CTAC micelles, the ZnS
nanoparticles agglomerates and settles down. However, in
aqueous solution of CPyC in the presence of nanoparticles,
the nature of conductivity curves remains same even after
280 300 320 340 360
0.0
0.2
0.4
0.6
0.8
1.0
1.2
ZnS NPs in CPyC
4
1
(a)
Absorbance (a.u.)
Wavelength (nm)
260 280 300 320 340 360
ZnS NPs in CTAC
4
1
(b)
Fig. 10 Absorption spectra of
ZnS nanoparticles in (a) CPyC
and (b) CTAC after UV
irradiation at 254 nm for (1)
0h,(2) 1 h, (3) 2 h and (4)3h
1206 Nanoscale Res Lett (2009) 4:1197–1208
123
cmc because of the fact that ZnS nanoparticle (synthesized
in CPyC) remained suspended even after formation of
micelles. This is due to more electrostatic attraction pro-
vided by larger head group size of CPyC for the stabil-
ization of nanoparticles. The conductivity studies, thus,
reveal that CPyC micelles solubilized the nanoparticles
better when compared to CTAC micelles.
Furthermore, the pH of the prepared ZnS colloidal
solution in the presence of CTAC and CPyC was also
measured and found to be 6.26 and 6.07, respectively.
Zhang et al. [17] have explained that ZnS particles are
negatively charged in the pH range of 5.3 \ pH \ 9.3, and
negatively charged species such as Br
-
or HS
-
face an
electrostatic barrier to surface adsorption. Therefore, we
0.0 0.5 1.0 1.5 2.0
0
20
40
60
80
100
120
140
160
(a)
CTAC
CTAC + ZnS NPs
Conductivity (µS cm
-1
)
[CTAC] (mM)
(b)
CPyC
CPyC + ZnS NPs
[CPyC] (mM)
0.0 0.5 1.0 1.5 2.0
Fig. 11 Conductometric
studies on aggregation of (a)
CTAC and (b) CPyC in the
presence of ZnS nanoparticles
prepared in respective
surfactants
S
2-
S
2-
S
2-
S
2-
S
2-
>cmc
S
2-
Zn
2+
Nucleation
Surfactant
monomers
S
2-
S
2-
S
2-
S
2-
Nanoaprticle Growth
and stabilization
ZnS
ZnS
ZnS
ZnS
Surfactant
Bila
y
er
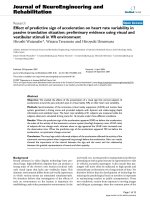
Fig. 12 Scheme of the ZnS
nanoparticle formation in
aqueous micellar solution of
cationic surfactants (pictorial
representation not to the scale,
actual size of surfactant is very
small when compared to ZnS
nanoparticles)
Nanoscale Res Lett (2009) 4:1197–1208 1207
123
hypothesize that synthesized particles are negatively
charged due to excess S
2-
ions on the particle surface and
draw the cationic surfactant unimers via long-range elec-
trostatic forces that induce the surfactant adsorption through
head group. This is also supported by FTIR and fluores-
cence results. The hydrophobic tail region, in principle,
cannot prefer the aqueous environment, and thus a counter
layer is oriented in opposite way resulting in interpenetra-
tion of the surfactant hydrophobic tails between two layers
with hydrophilic groups headed outward. The head group of
this counter layer can be the part of adsorbed layer of other
ZnS nanoparticle, thus giving a surfactant nanoparticles
network structure in solution. On the basis of above dis-
cussion, the probable schematic representation of ZnS
nanoparticle formation in aqueous micellar media of cat-
ionic surfactant has been presented in Fig. 12.
Conclusions
The ZnS nanoparticles have been prepared in aqueous
micellar solution of two cationic surfactants viz. CTAC and
CPyC having different hydrophilic head groups. The
studies reveal that the stabilization and agglomeration of
ZnS nanoparticles in aqueous micellar media depends up
on surfactant head group. Based on UV–vis and turbidity
experiments, CPyC has been found to provide better sta-
bilization when compared to that by CTAC. Dependence of
photoluminescence emission on the size and surface pas-
sivation of nanoparticles has also established. The studies
on dependence of photophysical properties of ZnS nano-
particles on surfactant head group will be helpful in
defining its priorities for optical applications.
Acknowledgments Sanjay Kumar is thankful to CSIR, Government
of India for Junior Research Fellowship. Financial assistance from
DST is gratefully acknowledged.
References
1. H. Yang, P.H. Holloway, J. Phys. Chem. B 107, 9705 (2003)
2. N. Karar, S. Raj, F. Singh, J. Cryst. Growth 268, 585 (2004)
3. W. Chen, A.G. Joly, J.O. Malam, J.O. Bovin, J. Appl. Phys. 95,
667 (2004)
4. C. Yang, Y. Liu, H. Sun, D. Guo, X. Li, W. Li, B. Liu, X. Zhang,
Nanotechnology 19, 095704 (2008)
5. S. Biswas, S. Kar, Nanotechnology 19, 045710 (2008)
6. P.S. Khiew, S. Radiman, N.M. Huang, Md.S. Ahmed, K. Nad-
arajah, Mat. Lett. 59, 989 (2005)
7. S. Wajeh, Z.S. Ling, X. Xu-Rong, J. Cryst. Growth 255, 332
(2003)
8. A.J.M. Valente, H.D. Burrows, R.F. Pereira, A.C.F. Ribeiro,
J.L.G. Costa Pereira, V.M.M. Lobo, Langmuir 22, 5625 (2006)
9. J. Du, B. Jiang, J. Xie, X. Zeng, J. Disp. Sci. Technol. 22, 529
(2001)
10. L. Yu, T. Lu, Y.X. Luan, J. Liu, G.Y. Xu, Colloid Surf. A 257,
375 (2005)
11. J.C. Wang, P. Neogi, D. Forciniti, J. Chem. Phys. 125, 194717
(2006)
12. V.C. Moore, M.S. Strano, E.H. Haroz, R.H. Hauge, R.E. Smally,
Nanoletters 3, 1379 (2003)
13. H. Ma, M. Luo, L.L. Dai, Phys. Chem. Chem. Phys. 10, 2207
(2008)
14. A.A. Zaman, P. Singh, B.M. Moudgil, J. Colloid Interface Sci.
251, 381 (2002)
15. M.K. Naskar, A. Patra, M. Chatterjee, J. Collod Interface Sci.
297, 271 (2006)
16. H. Shao, Y. Huang, H. Lee, Y.J. Suh, C.O. Kim, J. Appl. Phys.
99, 08N702 (2006)
17. X.V. Zhang, S.P. Ellery, C.M. Friend, H.D. Holland, F.M.
Michel, M.A.A. Schoonen, S.T. Martin, J. Photochem. Photobiol.
A-Chem. 185, 301 (2007)
18. L.E. Brus, J. Chem. Phys. 80, 4403 (1984)
19. J. Tauc, A. Menth, J. Non-Cryst. Solids 8, 569 (1972)
20. P. Mishra, M.A. Dubinskii, UV-Spectroscopy and UV-Laser:
Practical Spectroscopy Series, vol. 30 (CRC Press, New York,
2002)
21. Y. Wang, A. Suna, W. Mahler, R. Kasowaki, J. Chem. Phys. 87,
7315 (1987)
22. G. Schmid, Nanoparticles: From Theory to Application (Wiley,
New York, 2004)
23. M.M. Savosta, V.N. Krivoruchko, I.A. Danilenko, V.Yu. Taren-
kov, T.E. Konstantinova, A.V. Borodin, V.N. Varyukhin, Phys.
Rev. B 69, 024413 (2004)
24. G.K. Wiliamson, W.H. Hall, Acta Meatall. 1, 22 (1953)
25. Z. Sui, X. Chen, L. Wang, Y. Chai, C. Yang, N. Zhao, Chem.
Lett. 34, 100 (2005)
26. G.T. Palomino, J.J.C. Pascual, M.R. Delado, J.V. Parva, C.O.
Arean, Mater. Chem. Phys. 85, 145 (2004)
27. R.A. Fogel, M.J. Rutherford, Am. Mineral. 75, 1311 (1990)
28. W. Chen, Z.G. Wang, Z.J. Lin, L.Y. Lin, J. Appl. Phys.
82, 3111
(1997)
29. T. Arai, T. Yoshida, T. Ogawa, J. Appl. Phys. 62, 396 (1987)
30. M. Agata, H. Kurase, S. Hayashi, K. Yamamoto, Solid State
Commun. 76, 1061 (1990)
31. H. Tang, G. Xu, L. Weng, L. Pan, L. Wang, Acta Mater. 52, 1489
(2004)
32. A.R. West, Solid State Chemistry and its Applications (Wiley,
New York, 1984)
33. J.F. Suyver, S.F. Wuister, J.J. Kelly, A. Meijerink, Nano Lett. 1,
429 (2001)
34. I.I. Yu, T. Isobe, M. Sennu, J. Phys. Chem. Solids 57, 373 (1996)
35. A. Henglein, M. Gutierrez, Ber. Bunsenges Phys. Chem. 87, 852
(1983)
36. U. Sohling, G. Jung, D.U. Saenger, S. Lu, B. Kutsch, M. Mennig,
J. Sol Gel Sci. 13, 685 (1998)
37. A.A. Atia, M.M. Saleh, J. Appl. Electrochem. 33, 171 (2003)
38. F. Zhao, Y.K. Do, J.K. Xu, S.F. Liu, Colloid J. 68, 784 (2006)
39. E.D. Goddard, K.P. Ananthapadmanabhan, Interactions of Sur-
factants with Polymer and Proteins (CRC Press, London, 1993),
p. 20
1208 Nanoscale Res Lett (2009) 4:1197–1208
123