Báo cáo hóa học: " Silver Nanoparticles and Graphitic Carbon Through Thermal Decomposition of a Silver/Acetylenedicarboxylic Salt" ppt
Bạn đang xem bản rút gọn của tài liệu. Xem và tải ngay bản đầy đủ của tài liệu tại đây (673.86 KB, 7 trang )
NANO EXPRESS
Silver Nanoparticles and Graphitic Carbon Through Thermal
Decomposition of a Silver/Acetylenedicarboxylic Salt
Panagiotis Dallas Æ Athanasios B. Bourlinos Æ
Philomela Komninou Æ Michael Karakassides Æ
Dimitrios Niarchos
Received: 24 March 2009 / Accepted: 20 July 2009 / Published online: 17 September 2009
Ó to the authors 2009
Abstract Spherically shaped silver nanoparticles embed-
ded in a carbon matrix were synthesized by thermal
decomposition of a Ag(I)/acetylenedicarboxylic acid salt.
The silver nanoparticles, which are formed either by
pyrolysis at 300 °C in an autoclave or thermolysis in
xylene suspension at reflux temperature, are acting cata-
lytically for the formation of graphite layers. Both reac-
tions proceed through in situ reduction of the silver cations
and polymerization of the central acetylene triple bonds
and the exact temperature of the reaction can be monitored
through DTA analysis. Interestingly, the thermal decom-
position of this silver salt in xylene partly leads to a minor
fraction of quasicrystalline silver, as established by HR-
TEM analysis. The graphitic layers covering the silver
nanoparticles are clearly seen in HR-TEM images and,
furthermore, established by the presence of sp
2
carbon at
the Raman spectrum of both samples.
Keywords Silver nanoparticles Á Graphitization Á
Acetylenedicarboxylic acid Á Nanocomposites
Introduction
Acetylenedicarboxylic acid (ACD) as carboxylic acids
with short aliphatic chains [1] is well known to form
complexes with transition metals such as Cd(II) [2], Cu(II)
[3], Mn(II) [4] or even lanthanide cations [5] either in
single crystal or in powder form. The metal cations are
coordinated with both carboxylate groups in a chelating
mode, thus forming metal-organic chains. Interestingly, the
triple bond centered between the carboxylate units of
acetylenedicarboxylic acid provides new design parameters
for the synthesis of novel structures since the distance
between the ligands can be decreased enough to succeed
polymerization leading to conjugated materials as demon-
strated by Skoulika et al. [6]. As such, acetylenedicarb-
oxylic acid is a promising candidate for the synthesis of
novel metal-organic networks with interesting properties.
Nonetheless, the derived carbon materials obtained after
thermal decomposition of such complexes are yet to be the
target of intense research, especially considering that the
acetylene unit provides an excellent source for carbon,
whereas the central metal cation may act as a catalyst.
On the other hand, in another research field, the field of
nanoscience, applications of noble-metal nanoparticles,
especially silver, have recently grown exponentially. Silver
nanoparticles display unique physical, chemical [7–9], and
biologic properties such as high antibacterial activity
toward a large number of bacterial strains [10, 11] and
furthermore they have been incorporated in various natural
[12], conductive [13] or dendritic [14] polymer matrices
toward the synthesis of advanced nanocomposite materials.
Besides the above mentioned colloidal nanocrystals and
polymer nanocomposites, carbon-supported silver metal
nanoparticles exhibit a wide range of applications in
catalysis, antibacterial activity, thermal conductivity, and
P. Dallas (&) Á A. B. Bourlinos (&) Á D. Niarchos
Institute of Materials Science, NCSR ‘Demokritos’,
15310 Athens, Greece
e-mail: ; ;
A. B. Bourlinos
e-mail:
P. Komninou
Department of Physics, Aristotle University of Thessaloniki,
Thessaloniki, Greece
M. Karakassides
Department of Materials Science and Engineering,
University of Ioannina, Ioannina, Greece
123
Nanoscale Res Lett (2009) 4:1358–1364
DOI 10.1007/s11671-009-9405-8
electronic materials [15, 16]. These hybrid materials are
usually obtained by impregnation of a presynthesized car-
bon support with silver salts and subsequent reduction to
silver metal (i.e., a multistep process). Accordingly, the
one-step fabrication of silver–carbon hybrids would be
much recommended and is highly anticipated.
Recently, an interesting procedure has been proposed
describing the catalytic growth of crystalline graphite
through thermal decomposition of an organometallic iron
complex in solution [17]. This process leads to the catalytic
graphitization of the organic component and simulta-
neously to the formation of magnetic iron oxide nanopar-
ticles. This synthetic route seems to be of high importance
since the graphitization process usually demands high
temperatures, typically in the range 500–1,000 °C[18–20].
To that direction, herein we report an entirely different but
conceptually relevant case of catalytic graphitization based
on the thermal decomposition of the silver acetylenedi-
carboxylate salt, which leads to the reduction of silver
cations to metallic nanoparticles and the simultaneous
formation of a carbon coating. Two different processes
have been employed involving either thermolysis of the
silver salt or thermal decomposition in the solid state.
Given the dramatic effect of several metal nanoparticles on
the growth and morphology of a series of intriguing carbon
nanostructures, the direct thermal decomposition of suit-
able organometallic precursors may give an easy access to
metal-carbon nanocomposites as well as carbogenic nano-
structures with emergent morphologies.
Experimental Section (Scheme 1)
Synthesis of Silver/Acetylenedicarboxylic Salt
The experimental details involve in the first step the syn-
thesis of the precursor salt of Ag(I) with acetylenedicarb-
oxylic acid, (ACD), (Aldrich, 95%). About 425 mg of
AgNO
3
(Riedel De Haan, 99.5%) was dissolved in 15 mL
H
2
O and an aqueous solution of 280 mg ACD (15 mL H
2
O)
was slowly added. A white precipitate was formed imme-
diately. The solid was easily isolated by centrifugation,
washed with water several times in order to remove
residual salts and organics, and finally dried at 50 °C for
24 h away from light. Sample name: Ag/ACD.
Thermolysis of Ag/ACD in Xylene
The white Ag/ACD powder (200 mg) was suspended in
xylene (30 mL) and refluxed for 1 h. Within few minutes
the color of the suspended solid changed from white to
black. The reaction is completed in much lower tempera-
tures than the boiling point of xylene (140 °C) as evi-
denced by DTA analysis of the Ag/ACD salt (Fig. 6a).
After reaction accomplishment, the black powder was
isolated by centrifugation, washed with alcohol and ace-
tone several times, and dried at 50 °C for 24 h. Sample
name: Ag/sol.
Thermal Decomposition of Ag/ACD in the Solid State
Ag/ACD white powder (1 g) was loaded in Teflon equip-
ped stainless steel autoclave and the sealed system was
heated at 300 °C for 2 h at a heating rate of 10 °C min
-1
.
The black powder was washed numerous times with water
and acetone prior to drying. Sample name: Ag/pyr.
Characterization Techniques
XRD patterns were recorded on powder samples using a
Siemens 500 Diffractometer. Cu Ka radiation was used
with a scan rate 0.03 s
-1
. Thermogravimetric and Differ-
ential thermal analysis measurements were recorded on a
Perkin–Elmer Pyris TGA/DTA under airflow with a heat-
ing rate 10 °C min
-1
. Infrared spectra were taken on KBr
(Aldrich, 99%, FT-IR grade) pellets with a FT-IR spec-
trometer of Bruker, Equinox 55/S 123 model. The UV–
visible spectrum was recorded on a Shimadzu 2100 spec-
trometer using ethanol suspensions in quartz cuvettes. The
Raman spectra were recorded using a Raman microscope
system (Renishaw, System 1000) consisting of an optical
microscope (Leica) coupled to a Raman spectrometer
(532 nm).
Results and Discussion
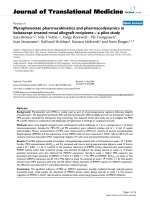
Synthesis, FT-IR and Raman Spectroscopy
Each carboxylate anion unit of the acetylenedicarboxylic
acid coordinates easily with a silver cation, leading to a fast
precipitation process almost immediately after the addition
of the reagents. The white powder that is formed signals
the formation of the precursor silver salt that was first
Ag
+-
OOC-C C-COO
-
Ag
+
AgNO
3
(H
2
O)
+HOOC C
C
COOH
È (140 C
o-
-xylene)
È (300 C
o-
-solid state)
(H
2
O)
White solid
(com
p
letel
y
insoluble)
Scheme 1 A schematic representation of the reaction steps
Nanoscale Res Lett (2009) 4:1358–1364 1359
123
characterized using FT-IR spectroscopy (Fig. 1). The
spectra of the ACD and Ag/ACD are significantly different,
clearly indicating the coordination of both carboxylate
anions with silver cations. The vibration mode centered at
1,700 cm
-1
is assigned to a dimer between two saturated
carboxylic groups of the ACD, while at the Ag/ACD
complex spectrum, the antisymmetric and symmetric
vibration modes of the carboxylate anion appear and are
located at 1,551 and 1,342 cm
-1
, respectively. The dif-
ference between the frequencies of these two bands is
209 cm
-1
, which indicates ‘‘pseudo-unidentate’’ coordi-
nation between the metal sites and the carboxylate anions
[21]. Furthermore, the absence of a peak assigned to
–COOH units in the spectrum of the precursor salt, Ag/
ACD, indicates that all acetylenedicarboxylic moieties are
in anionic form coordinated with silver cations. If the
sample is dried and left as it is, after a few days it obtains a
yellow color, which can be assigned to an interaction of
Ag
?
with acetylene units [22]. After thermal decomposi-
tion of Ag/ACD in the solid state, the IR spectrum of the
corresponding Ag/pyr is exhibiting a spectrum with a weak
absorption band at 1,732 cm
-1
attributed to C=O groups as
well as weak and broad absorption in the range 1,600–
1,000 cm
-1
ascribed to oxygen-containing functional
groups (e.g., C–OH, C–O–C and residual carboxylates) and
carbon double bonds (e.g., from partially unsaturated rings
within graphene layers). Similarly, the FT-IR spectrum of
the Ag/sol sample is quite typical for an extended carbon
double bond network, with strong absorption peaks in the
1,540–1,580 cm
-1
region. Also the presence of a strong
absorption at 1,389 wavenumbers, which is well known to
come from nitrate anions (NO
3
-
), is noticed. In that case
the nitrate anions should be absorbed on the surface of the
nanoparticles.
Further structural information based on the acetylene
triple bond was not possible to be collected due to the
absence of characteristic IR signals, something that is
expected in a symmetric molecule like ACD. Lastly, in a
blank experiment, when neat ACD was refluxed in xylene a
light yellow-brown colored solution was obtained, meaning
that the graphitization is not possible in the absence of
silver.
In order to establish the formation of graphitic carbon
we performed Raman measurements, which are particu-
larly useful in the identification of graphite. The diagrams
corresponding to the Ag/sol and Ag/pyr samples are pre-
sented in Fig. 2. Both spectra are typical of the formation
of sp
2
carbon bonds according to the appearance of a band
at 1,590 cm
-1
(G-band), while a lower percentage of sp
3
carbon bonds is indicated by the second band centered at
1,369 cm
-1
(D-band) [23–25]. We assign the formation of
the graphitic layers to a coupling reaction of the acetylene
units that is catalytically promoted by the simultaneous
formation of silver nanoparticles. Similarly to the role of
2000 1750 1500 1250 1000 750
transmittance
(a) Ag/sol
NO
3
-
2000 1800 1600 1400 1200 1000 800 600
Transmittance (%)
wavenumber (cm
-1
)
wavenumber (cm
-1
)
(b) ACD
(c) Ag/ACD precursor
(d) Ag/pyr
b)
c)
d)
Fig. 1 FT-IR spectra of a Ag/
sol, b ACD, c Ag/ACD, d Ag/
pyr
500 750 1000 1250 1500 1750 2000
500 750 1000 1250 1500 1750 2000
Intensity
Raman shift (cm
-1
)
Raman shift (cm
-1
)
sp
3
sp
2
(a) Ag/pyr
intensity
(b) Ag/sol
sp
3
sp
2
Fig. 2 Raman spectra of
samples a Ag/pyr, b Ag/sol
1360 Nanoscale Res Lett (2009) 4:1358–1364
123
iron oxide nanoparticles in the procedure published by
Walter et al. [17], we propose that the silver nanoparticles
facilitate the reaction among the acetylene units at low
temperatures and relatively mild conditions. For instance,
the catalytic impact of silver toward graphitization has
been previously demonstrated [26].
Structural and Morphological Study: XRD Analysis
and Electron Microscopy
The materials were firstly characterized with XRD analy-
sis. The XRD pattern of the precursor Ag/ACD (Fig. 3a) is
characteristic of an amorphous material. The presence of
two broad bands without any pronounced peak, centered in
2h = 11° and 2h = 32° may be assigned to the glass
support holder and the silver salt, respectively. Since the
band is significantly broad, the material cannot be con-
sidered to exhibit any symmetric ordering and should be
characterized as amorphous. After thermal decomposition
of the precursor in the solid state, the XRD study estab-
lishes the formation of highly crystalline silver nanoparti-
cles in Ag/pyr (Fig. 3b). The small carbon fraction in
Ag/pyr (based on TGA measurements) and the density
contrast between carbon and silver (i.e., carbon filaments
are much lighter) made difficult the observation of the
carbon phase in this sample. Additionally, the XRD pattern
of Ag/sol obtained by thermolysis of Ag/ACD in xylene
also establishes the complete formation of metallic silver
nanoparticles (Fig. 3c). The pattern of the Ag/sol sample
exhibits one extra peak compared to the Ag/pyr pattern,
which is centered at 2h = 28.8 A
˚
. This value is consistent
with the arrangement of turbostratic carbon filaments [27]
and it is quite close to the characteristic interplanar spacing
of graphite (d spacing at 3.35 A
˚
)[28]. Likewise Ag/pyr,
the small carbon fraction and large scattering factor of
silver are responsible for the weak intensity of graphite
peak in Ag/sol. A mean particle size D can be deduced by
applying the Scherrer equation at the strongest peak of the
XRD pattern [29, 30], D = 0.9k/D(2h)cosh, where D is the
crystalline domain size, D(2h) is the full width at half
maximum of the strongest peak and k is the X Ray
wavelength (k = 1.5418 A
˚
), and it is roughly estimated to
be about 30 nm and 20 nm for the Ag/pyr and Ag/sol
sample, respectively, revealing a moderate size distribution
for both samples.
After establishing the complete decomposition of the
silver salt and reduction of the cations toward silver
nanoparticles, we employed TEM microscopy in order to
10 20 30 40 50 60 70 80 90
intensity (a.u)
Ag/ACD precursor
(a)
30 60 90
intensity (a.u)
2θ degrees
2θ degrees
111
200
220
311
222
(b)
(c)
28.8
o
Fig. 3 XRD patterns of all
samples: a Ag/ACD, b Ag/pyr
and c Ag/sol. The hkl indices of
the metallic silver are indicated
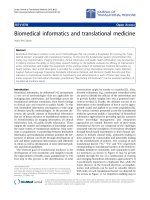
Fig. 4 a HR-TEM image of the
Ag/sol sample. b The
corresponding HR-TEM
analysis of an individual
nanoparticle. The
quasicrystalline phase is marked
and shown as inset. It is a minor
percentage of the overall
crystal. The carbon coating can
be seen surrounding the silver
crystal
Nanoscale Res Lett (2009) 4:1358–1364 1361
123
fully characterize the samples. Besides the expected pres-
ence of spherical silver nanoparticles, two interesting
aspects should be marked in the TEM analysis of both
samples: the appearance of turbostratic graphitic layers at
the Ag/pyr sample and a minor fraction of quasicrystalline
cubic silver phase in the Ag/sol (Figs. 4, 5). Quasicrystals
emerged in the field of materials science in 1984 when an
unexpected fivefold symmetry in the electron diffraction
pattern of an Al–Mn alloy was observed [31]. Later on,
many alloys with a quasicrystalline phase have been syn-
thesized and extensively characterized, and even natural
occurring quasicrystals have been recently found and
studied [32], but to our knowledge this is the first report for
a fivefold symmetry in noble metal nanocrystals. However,
the mechanism that leads to this completely unexpected
symmetry is yet to be revealed and in any case the quasi-
crystalline phase is a minor percent of the overall material.
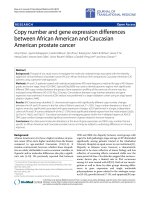
Secondly, in the Ag/pyr sample, curved graphitic fila-
ments are revealed in the HR-TEM images (Fig. 5) form-
ing a matrix where the silver nanoparticles are hosted. The
curvature of the carbon filaments is more pronounced near
the edges and can be ascribed to the previously reported
catalytic effect of silver nanoparticles on the growth of
carbon onions [26]. The silver nanoparticles seem to be the
core areas of the composite, which are interconnected by
the carbon layers. This is in accordance with the reaction
steps that we propose, where the formation of silver
nanoparticles is the catalytic step for the polymerization of
the central acetylene units. And in fact, the pyrolytic pro-
cess is much closer to this mechanism than the solvother-
mal, most probably due to the low reaction time and violent
conditions that are taking place inside the autoclave.
Thermal Analysis
Firstly, the exact reaction point and thermal decomposition
of the silver/acetylenedicarboxylic salt was evaluated
through DTA analysis. The curve (Fig. 6a) shows a strong
exothermic process starting from 110 °C and reaching
its maximum peak at 132 °C, with an enthalpy flow
approximately -103 lV s/mg. Compared to the simple
acetylenedicarboxylic acid, which has a melting point
(decomposition) at 180 °C, the silver salt is significantly
more active. Unfortunately the thermal decomposition of
this salt is extremely violent and explosive and the TGA
curves could not be recorded since this thermogravimetric
measurement exhibits extreme noise and it can even
damage the TG balance.
The weight percentages of carbon and silver in both
samples were obtained with thermogravimetric analysis
under airflow. The TGA/DTA diagrams for the two com-
posites are presented in Fig. 6. The traces of the Ag/pyr
sample present a weight loss due to the thermal decom-
position of the carbon layer, starting at 300 °C and
Fig. 5 HR-TEM images of the
Ag/pyr sample. The graphitic
layers can be seen surrounding
the individual silver
nanoparticles, thus forming a
carbon matrix where the
nanoparticles are encapsulated.
In the last image a single silver
nanoparticle and its typical
interlayer spacing is shown in
magnification
1362 Nanoscale Res Lett (2009) 4:1358–1364
123
completed at 400 °C. A sharp exothermic peak in the DTA
diagram, which is centered at 349 °C, also marks this
thermal decomposition. Accordingly, the calculated weight
percentage of the silver nanoparticles is about 94% wt and
remains a 6% wt which can be assigned to the carbon
coating. A similar thermogravimetric analysis curve is
obtained for the Ag/sol sample with the weight percentage
of carbon being significantly higher (*13% wt) most
probably due to the lower reaction temperature in refluxing
xylene. The corresponding DTA exothermic peak is quite
the same with that of the Ag/pyr sample and it is centered
at 332 °C. It should be noted that during the thermo-
gravimetric analysis measurements and the exposure of the
samples to oxygen, most probably a minor percentage of
silver is oxidized to silver oxide (Ag
2
O) near the surface of
the nanoparticles. Therefore, it is difficult to establish
precisely the silver content of the composites by TGA.
However, since silver is significantly heavier than oxygen
and the oxidation takes place exclusively near the surface
of the nanoparticles, any formation of silver oxide should
be considered negligible and without seriously affecting
our calculations regarding the silver content.
UV–Visible Spectroscopy
The UV–Visible spectrum of the Ag/sol sample was
recorded and is presented in Fig. 7. The spectrum was
recorded in fine dispersion in ethanol after high dilution
and sonication. As it is well known, silver nanoparticles
exhibit an absorption in the UV–Visible region due to their
characteristic surface plasmon resonance frequency. The
spectrum consists of two broad bands centered at 385
(=3.22 eV) and 770 nm (=1.61 eV). The strong absorption
peak centered at 385 nm is well typical for spherically
shaped silver nanoparticles [33]. However, it is slightly
shifted toward lower wavelengths due to the coupling of
the surface plasmon electrons with the sp
2
carbon atoms of
the graphitic layers, in analogy with oligothiophene-coated
gold nanoparticles [34]. Interestingly, the second, very
weak, band is centered at exactly the half frequency
compared to the first band (770 and 385 nm, respectively)
50 100 150 200 250 300 350 400
-10
-5
0
5
10
Heat flow
Temperature (°C)
(a) Ag/ACD precursor
100 200 300 400 500
0
5
10
15
20
25
30
(I) DTA
(II) TGA
Tem
p
erature (°C)
100 200 300 400 500
Temperature (°C)
Heat flow (µV)
(b) Ag/sol
I)
II)
85
90
95
100
weight loss (% wt)
-30
-20
-10
0
10
20
30
I) DTA
II) TGA
Heat flow (µV)
(c) Ag/pyr
I)
II)
94
96
98
100
weight loss (%)
Fig. 6 a DTA curve for the
precursor Ag/ACD salt and
TGA and DTA diagrams
recorded simultaneously for the
samples: b Ag/sol and c Ag/pyr
400 500 600 700 800
absorption (a.u)
wavelen
g
th (nm)
385 nm
770 nm
Fig. 7 UV–Visible absorption spectrum of a fine suspension of
Ag/sol in ethanol
Nanoscale Res Lett (2009) 4:1358–1364 1363
123
and it can be assigned to the in-plane dipole resonance of
the silver nanoparticles [7]. Unlike Ag/sol, the Ag/pyr
sample was completely insoluble in any solvent and hence
the absorption spectrum could not be recorded.
Conclusions
An insoluble, white, Ag(I) salt with acetylenedicarboxylic
acid was synthesized and used for the preparation of
two silver–carbon nanocomposites via different synthetic
routes. As it is indicated from the XRD patterns and TEM
images both reactions lead to the formation of silver
nanoparticles embedded in a carbon matrix. The graphiti-
zation proved to be much better in the solid-state reaction
than in solution, however, the carbon yield is relatively
lower, the reaction temperature is higher and the interesting
fivefold symmetry in the silver nanoparticles is absent. As a
future step toward expansion of this procedure, the violent
reaction between a functional molecule like ACD and
coordinated metal ions can lead to various interesting
morphologies as well as nanostructures.
References
1. E.G. Bakalbassis, M. Korabik, A. Michaelides, J. Mrozinski, C.
Raptopoulou, S. Skoulika, A. Terzis, D. Tsaousis, J. Chem. Soc.
Dalton Trans. 850 (2001)
2. A. Michaelides, D. Tsaousis, S. Skoulika, C. Raptopoulou,
A. Terzis, Acta Crystallogr. Sect. B. Struct. Sci. 54, 657 (1998)
3. M.X. Li, M. Shao, H. Dai, B.L. An, W.C. Lu, Y. Zhu, C.X. Du,
Chin. Chem. Lett. 16(10), 1405 (2005)
4. M. Shao, M.X. Li, H. Dai, W.C. Lu, B.L. An, J. Mol. Struct. 829,
155 (2007)
5. G. Zhang, Q. Wang, Y. Qian, G. Yang, J.S. Ma, J. Mol. Struct.
796, 187 (2006)
6. St. Skoulika, P. Dallas, M.G. Siskos, Y. Deligiannakis,
A. Michaelides, Chem. Mater. 15, 24–4576 (2003)
7. R. Jin, Y.C. Cao, E. Hao, G.S. Metraux, G.C. Schatz, C.A.
Mirkin, Nature. 425, 487 (2003)
8. Q. Zeng, X. Jiang, A. Yu, G. Lu, Nanotechnology. 18, 35708
(2007)
9. S. Navaladian, B. Viswanathan, R.P. Viswanath, T.K. Varad-
arajan, Nanoscale Res. Lett. 2, 44 (2007)
10. A. Panacek, L. Kvitek, R. Prucek, M. Kolar, R. Vecerova,
N. Pizurova, V.K. Sharma, T. Nevezna, R. Zboril, J. Phys. Chem.
B. 110, 16248 (2006)
11. L. Kvitek, A. Panacek, J. Soukopova, M. Kolar, R. Vecerova,
R. Prucek, M. Holecova, R. Zboril, J. Phys. Chem. C. 112, 5825
(2008)
12. R.J.B. Pinto, P.A.A.P. Marques, C.P. Neto, T. Trindade, S. Daina,
P. Sadocco, Acta Biomater. 5, 2279 (2009)
13. P. Dallas, D. Niarchos, D. Vrbanic, N. Boukos, S. Pejovnik,
C. Trapalis, D. Petridis, Polymer. 48, 2007 (2007)
14. M. Gladitz, S. Reinemann, H.J. Radusch, Macromol. Mater. Eng.
294, 178 (2009)
15. C K. Leong, D.D.L. Chung, Carbon. 42, 2323 (2004)
16. E. Borowiak-Palen, M.H. Ruemmeli, T. Gemming, T. Pichler,
R. Jkalenczuk, S.R.P. Silva, Nanotechnology. 17, 2415 (2006)
17. E.C. Walter, T. Beetz, M.Y. Sfeir, L.E. Brus, M.L. Steigerwald,
J. Am. Chem. Soc. 128, 15590 (2006)
18. J. Hu, Y. Bando, J. Zhan, C. Zhi, F. Xu, D. Goldberg, Adv. Mater.
18, 197 (2006)
19. A. Govindaraj, C.N.R. Rao, Pure Appl. Chem. 74, 1571 (2002)
20. L. Zhi, J. Wu, J. Li, U. Kolb, K. Mullen, Angew. Chem. Int. Ed.
44, 2120 (2005)
21. G.B. Deacon, R.J. Philips, Coord. Chem. Rev. 33, 227 (1980)
22. F. Albert Cotton, G. Wilkinson, Advance Inorganic Chemistry
(Interscience, London, 1962)
23. A.C. Ferrari, J. Robertson, Phys. Rev. B. 61, 14095 (2000)
24. F. Tuinstra, J.L. Koenig, J. Chem. Phys. 53, 1126 (1970)
25. M.S. Dresselhaus, G. Dresselhaus, A. Jorio, A.G. Souza Filho,
M.A. Pimenta, R. Satio, Acc. Chem. Res. 35, 1070 (2002)
26. Th. Cabioc’h, E. Thune, M. Jaouen, Phys. Rev. B. 65, 132103
(2002)
27. H. Song, X. Chen, X. Chen, S. Zhang, H. Li, Carbon. 41, 3037
(2003)
28. A.H.R. Palser, Phys. Chem. Chem. Phys. 1, 4459 (1999)
29. H.P. Klug, L.E. Alexander, X Ray Diffraction Procedures for
Polycrystalline and Amorphous Materials (Wiley, New York,
1962), pp. 491–538
30. P. Dallas, V. Georgakilas, D. Niarchos, Ph. Komninou, Th.
Kehagias, D. Petridis, Nanotechnology. 17, 2046 (2006)
31. A.P. Tsai, Acc. Chem. Res. 36, 31 (2003)
32. L. Bindi, P.J. Steinhart, N. Yao, P.J. Lu, Nature. 324, 1306 (2009)
33. K.L. Kelly, E. Coronado, L.L. Zhao, G.C. Schatz, J. Phys. Chem.
B. 107, 668 (2003)
34. B.C. Sih, M.O. Wolf, J. Phys. Chem. B. 110, 22298 (2006)
1364 Nanoscale Res Lett (2009) 4:1358–1364
123