Báo cáo hóa học: " Structural Analysis of Highly Relaxed GaSb Grown on GaAs Substrates with Periodic Interfacial Array of 90° Misfit Dislocations" potx
Bạn đang xem bản rút gọn của tài liệu. Xem và tải ngay bản đầy đủ của tài liệu tại đây (358.19 KB, 5 trang )
NANO EXPRESS
Structural Analysis of Highly Relaxed GaSb Grown on GaAs
Substrates with Periodic Interfacial Array of 90° Misfit
Dislocations
A. Jallipalli Æ G. Balakrishnan Æ S. H. Huang Æ
T. J. Rotter Æ K. Nunna Æ B. L. Liang Æ
L. R. Dawson Æ D. L. Huffaker
Received: 24 June 2009 / Accepted: 12 August 2009 / Published online: 30 August 2009
Ó to the authors 2009
Abstract We report structural analysis of completely
relaxed GaSb epitaxial layers deposited monolithically on
GaAs substrates using interfacial misfit (IMF) array growth
mode. Unlike the traditional tetragonal distortion approach,
strain due to the lattice mismatch is spontaneously relieved
at the heterointerface in this growth. The complete and
instantaneous strain relief at the GaSb/GaAs interface is
achieved by the formation of a two-dimensional Lomer
dislocation network comprising of pure-edge (90°) dislo-
cations along both [110] and [1-10]. In the present analysis,
structural properties of GaSb deposited using both IMF and
non-IMF growths are compared. Moire
´
fringe patterns
along with X-ray diffraction measure the long-range uni-
formity and strain relaxation of the IMF samples. The proof
for the existence of the IMF array and low threading dis-
location density is provided with the help of transmission
electron micrographs for the GaSb epitaxial layer. Our
results indicate that the IMF-grown GaSb is completely
(98.5%) relaxed with very low density of threading dislo-
cations (10
5
cm
-2
), while GaSb deposited using non-IMF
growth is compressively strained and has a higher average
density of threading dislocations ([10
9
cm
-2
).
Keywords Semiconductor Á GaSb/GaAs Á Molecular
beam epitaxy Á Interfacial misfit dislocations (IMF) or
Lomer dislocations Á Strain relief Á Structural properties Á
Moire
´
fringes
Introduction
Antimonide semiconductors have potential application in a
wide range of electronic and opto-electronic devices due to
their unique band-structure alignments, and small effective
mass as well as high mobility for electrons [1–4]. While
recent technical advancements have enabled high quality
lattice matched GaSb epitaxy on native substrates, for
many applications GaAs substrates are desirable. This is
because of the following reasons: GaAs is inexpensive, has
favorable thermal properties, transparent to more (long
wave length) active regions, forms excellent n and p ohmic
contacts, and can be semi-insulating compared to GaSb.
However, the high (7.8%) lattice mismatch between the
GaSb epilayer and the GaAs substrate complicates the
growth of sophisticated device structures. Currently, this
mismatch is accommodated via metamorphic buffer layers
[5] and strain-relief superlattices [6]. In metamorphic
buffer layer approach, initially the strain within the critical
thickness is accommodated by tetragonal distortion fol-
lowed by defect formation and filtering. While this
approach has enabled a number of device demonstrations
[7], it exhibits several deficiencies such as the necessity to
grow thick buffer layers (often [1 lm), poor thermal and
A. Jallipalli (&) Á D. L. Huffaker
Electrical Engineering Department, University of California
at Los Angeles, Los Angeles, CA 90095, USA
e-mail:
D. L. Huffaker
e-mail:
G. Balakrishnan Á T. J. Rotter Á L. R. Dawson
Center for High Technology Materials, University of
New Mexico, Albuquerque, NM 87106, USA
S. H. Huang
Department of Earth and Planetary Sciences, University of
New Mexico, Albuquerque, NM 87131, USA
K. Nunna Á B. L. Liang Á D. L. Huffaker
California NanoSystems Institute, University of California
at Los Angeles, Los Angeles, CA 90095, USA
123
Nanoscale Res Lett (2009) 4:1458–1462
DOI 10.1007/s11671-009-9420-9
electrical conductivity, and has resulted in significant
material degradation through the presence of threading
dislocations (TDs).
Recently, a fundamentally different growth mode,
interfacial misfit dislocation (IMF) growth mode, has been
developed by our group [8, 9]. In this growth, the strain is
relieved instantaneously at the mismatched heterointerface
unlike the traditional tetragonal distortion approach that
relieves the strain after reaching a critical thickness. The
IMF growth offers a ‘‘buffer-free’’ approach to realize
monolithic high quality GaSb deposited on GaAs substrate
with exceptionally low threading dislocation (TD) densities
(*10
5
cm
-2
), despite the high lattice mismatch. The strain
created due to the 7.8% lattice mismatch is relieved at the
GaSb/GaAs interface by the formation of a two-dimen-
sional (2D), periodic IMF arrays comprised of pure-edge
(90°) dislocations along both [110] and [1-10]. To facilitate
the growth of ‘‘buffer-free’’ deposition of GaSb on GaAs
substrate with low TD densities, in complex device struc-
tures, it is essential to understand the structural properties
of IMF-grown GaSb epitaxial layers.
An attempt was made previously to show the proof of
existence of the IMF array at the GaSb/GaAs interface
along [1-10] using cross-sectional transmission electron
micrograph (XTEM) and to calculate the TD density using
KOH etching as shown in Ref. [10]. However, the XTEM
images look only at one-dimensional sections and hence
are not representative of the 2D interface. Also, the quan-
titative analyses like strain relaxation of bulk GaSb
deposited on GaAs substrates, long-range uniformity of the
IMF array in 2D, and accurate TD density calculation for
GaSb that was not presented earlier, are very important in
realizing high quality GaSb bulk layers on GaAs substrate.
In this study, all the issues addressed earlier, namely the
material quality of the GaSb epitaxial layer is quantified
using various analyses like XTEM, selective area electron
diffraction (SAED) double spot pattern, moire
´
fringe pat-
terns, X-ray diffraction (XRD), and plan-view TEM.
Experiments
The samples are grown on GaAs substrates in a VG V80H
molecular beam epitaxy (MBE) reactor equipped with
valved crackers for As and Sb, and an optical pyrometer for
monitoring the substrate temperature. Various samples
comprising GaSb bulk layers are grown on GaAs sub-
strates, using IMF growth. The details of the IMF growth
are presented elsewhere [10]. The thickness of the IMF-
grown GaSb epitaxial layers used for various analyses
range from 15 nm to 5 lm. For example, thick samples
like 5, 0.5 lm are used for XRD analyses, and samples
with medium thickness, like 120 nm, are used for XTEM
and SAED analyses, respectively. For TD density analysis
using plan-view TEMs, the sample is lapped down from
5-lm GaSb epitaxial layer to 45 nm. Very thin 15-nm
sample is grown separately for moire
´
fringe analysis to
facilitate the transmission of electrons through both the
epitaxial layer and the underlying substrate. The sample
required for moire
´
fringe analysis is prepared as follows,
the substrate is lapped down to *10 lm and ion milled to
30 nm, resulting in a net thickness of 45 nm that includes
the 15-nm IMF-grown GaSb epitaxial layer. Another set of
GaSb bulk samples, which are similar to those of the IMF
samples are deposited using non-IMF growth on GaAs
substrate for comparison with the former in various anal-
yses as mentioned earlier. If the interface is As-rich instead
of Ga-rich prior to the deposition of GaSb, no IMF is
observed at the heterointerface and this growth mode is
called non-IMF growth mode. Non-IMF growth is also
similar to that of the IMF growth up to the deposition of
GaAs smoothing layer. After the smoothing layer, Ga
source is turned off and the As-overpressure is on while
bringing the temperature down to 510 °C from 560 °C.
When the substrate temperature is 510 °C, the resulting
surface is As-rich. At this point, both Ga and Sb sources are
turned on. In this case, IMF is not formed at the interface as
is explained in the following paragraphs.
Results and Discussion
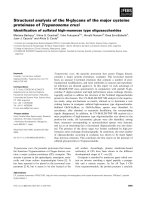
Figure 1 shows the high-resolution TEM (HR-TEM) image
of the GaSb/GaAs interface. The Burgers circuit completed
around each misfit indicates a pure-edge dislocation along
[1-10]. One of such misfit dislocations are shown in Fig. 1
as a bright spot representing the IMF dislocation. Similar
type of burgers vectors are observed along [110] as well.
Hence the dislocation network associated with the IMF
array formation along both [110] and [1-10] is character-
ized as a 2D Lomer dislocation network. In general,
relaxation kinetics favors the formation of 60° dislocations
over 90° dislocations as the former dislocation can glide to
the surface from the interface. However, the latter is more
preferable as it is more efficient in relieving the strain
compared to the 60° dislocations and can be formed under
favorable conditions as shown in Fig.
1.
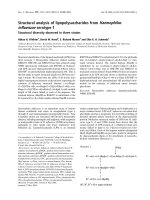
Figure 2a shows the bright-field XTEM image of a
120-nm TD free IMF-grown GaSb epitaxial layer on a
GaAs substrate along zone axis [110]. The IMF is seen as
dark spots in this figure with a periodicity of 5.6 nm. This
periodicity corresponds to exactly one misfit dislocation for
every 14 lattice sites of GaAs or 13 lattice sites of GaSb.
This value is in good agreement with the theoretical peri-
odicity for a relaxed GaSb deposited on GaAs [8]. The
strain created by the lattice mismatch is relieved
Nanoscale Res Lett (2009) 4:1458–1462 1459
123
spontaneously by the formation of the IMF at the GaSb/
GaAs interface. Further proof of spontaneous relaxation of
IMF-based samples is provided via the SAED double spot
pattern as shown in Fig. 2b, which is imaged along zone
axis [110]. The highly resolved diffraction spots in SAED
demonstrate two separate lattice constants associated with
GaAs (a
s
= 5.65 A
˚
) and GaSb (a
f
= 6.09 A
˚
), respectively.
The alignment of the 000 diffraction spot with, for
instance, the two 220 spots indicates that there is no lattice
rotation. In the IMF growth, a sheet of Sb atoms are
deposited on Ga-rich GaAs surface before starting the
growth of bulk GaSb epitaxial layer. If Sb is deposited on
As-rich GaAs surface instead of Ga-rich GaAs surface, the
resulting epitaxial layer will have high defect density as
shown in the bright-field XTEM of Fig. 2c, which is
imaged along [110] for non-IMF grown GaSb sample.
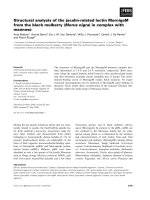
The x-2h scan of symmetric (004) XRD spectra for a
0.5- lm thick GaSb epitaxial layers deposited using IMF
and non-IMF growths, and 5- lm thick sample deposited
using IMF growth are shown in Fig. 3a, b, respectively. In
addition to the broad full width at half maximum (FWHM),
the non-IMF spectrum differs to the IMF spectrum due to
the presence of additional peak near the GaAs substrate as
shown in Fig. 3a. This additional peak in the non-IMF
sample is attributed to the tetragonally distorted GaSb. This
means that initially the in-plane lattice constant of the
epitaxial layer and of the substrate are equal up to critical
thickness, after which the epitaxial layer slowly relaxes to
the original lattice constant of GaSb by relieving the strain
via the formation of misfit and often threading dislocations.
In non-IMF spectrum, this transition of lattice constant is
represented by a negative slope via the transition from
additional peak to the epi-peak. Similar type of behavior
was not observed in the IMF samples, and hence no
tetragonal distortion is attributed to the IMF-grown GaSb
epitaxial layers. The relaxation of the IMF-grown GaSb
epitaxial layer is determined from the analysis of XRD.
The calculation based on the symmetric (004) and asym-
metric (115) XRD measurements show approximately
98.5% (complete) relaxation of the GaSb epitaxial layer,
and similar type of relaxation is observed in GaSb grown
on GaAs with AlSb nucleation layer [11]. We believe that
the broad FWHM (194 arcsecs) of GaSb layers, thinner
than 1 lm, as shown in Fig. 3a is due to the small amount
of residual strain (\2%) in the epitaxial layers after the
creation of the IMF array [10]. As per our observations,
with thicker layers (5 lm) the FWHM decreases consid-
erably to *20 arcsecs in IMF-grown GaSb epitaxial layers
as shown in Fig. 3b.
Figure 4a, b show the bright-field plan-view TEMs
imaged along zone axis [001] for the center and edge of the
IMF sample, respectively. The average TD density was
calculated to be 10
5
cm
-2
from the plan-view TEMs. Even
though, no TDs are observed at the center, very few TDs
are observed at the edge of the IMF sample and are
attributed to the un-optimized IMF growth at sample edges.
Using the plan-view TEM images, the dislocation density
Fig. 1 Burgers circuit completed around one misfit dislocation of the
IMF array at the GaSb/GaAs interface shown with the help of HR-
TEM image, where the dislocation is shown as a bright spot
Fig. 2 a XTEM showing a
periodic IMF array with a
periodicity of 5.6 nm, as dark
spots, at the GaSb/GaAs
interface b SAED double
diffraction pattern of IMF
growth mode, and c XTEM of
non-IMF growth mode with
high threading dislocation
density compared to the IMF
growth mode
1460 Nanoscale Res Lett (2009) 4:1458–1462
123
has been calculated based on the number of dislocations
within the unit area from several wafer surfaces. In the
non-IMF grown GaSb layers, TD density is measured to be
*10
9
cm
-2
as shown in bright-field plan-view TEM
shown in Fig. 4c, which is imaged along zone axis [001].
This confirms the fact that the TD density is reduced in the
IMF growth compared to the non-IMF growth due to
spontaneous strain relaxation. Also no 60° dislocations
were observed in IMF-grown GaSb, which indicates that
the IMF dislocations are non-interacting and pure-edge
(90°) 2D arrays. Since the 90° dislocations can relieve
strain almost completely at the interface, high quality
‘‘buffer-free’’ GaSb epilayers can be deposited monolithi-
cally on GaAs substrates in the IMF growth.
Figure 5a, b shows the two-beam bright-field plan-view
TEM g.3g [g = (220) and (2-20)] obtained from GaSb
epitaxial layers deposited on GaAs substrates using the
IMF growth. These TEMs show moire
´
fringe patterns,
which are the interference patterns that are formed when
two crystals with different orientations or lattice constants
overlap, thus providing an excellent indication of whether
the epitaxial layer is strained. Moire
´
fringes image the
projection of dislocations instead of the dislocations
themselves. The moire
´
fringes shown here are translational
moire
´
fringes as the planes and thereby g vectors are par-
allel to each other. Moire
´
fringe spacing, which is defined
as the spacing between two consecutive white or dark lines
is measured to be 2.8 nm from Fig. 5a, b. The theoretical
spacing for translational moire
´
fringes is given by:
D
tm
¼
1
d
GaSb
À
1
d
GaAs
À1
, where d is the inter-planar spacing
assuming that d
GaSb
= 2.155 nm and d
GaAs
= 0.1999 nm
for {220} reflections and is calculated to be 2.75 nm. The
measured value of 2.8 nm is in good agreement with the
theoretical spacing, which again indicates that the film is
fully relaxed.
Fig. 3 XRD (004) scan of
a 0.5 lm GaSb on GaAs
substrate grown using IMF and
non-IMF growth mode,
illustrating highly relaxed GaSb
for the IMF growth, and b 5 lm
GaSb on GaAs substrate
showing a narrow FWHM of
*20 arcsecs for the GaSb
epitaxial layer
Fig. 4 Plan-view TEM
showing TDs from a center,
b edge of the IMF sample, and
c center of the non-IMF sample
for a 5 lm GaSb epilayer on a
GaAs substrate
Fig. 5 Plan-view TEMs
showing moire
´
fringes of 2D
IMF arrays along a [110]
b [1-10], and c 2D Lomer
dislocation network along both
[110] and [1-10] measured
using diffraction vectors (220),
(2-20), and both (220) and
(2-20), respectively.
Consecutive white and dark
lines represent moire
´
fringes,
and the white circles represent
the edge dislocations
Nanoscale Res Lett (2009) 4:1458–1462 1461
123
Moire
´
fringes are often used to identify dislocations in
semiconductors [12–14] as well as metals [15]. The ter-
minating half lines (THLs) shown in Fig. 5a, b, indicated
by white circles illustrate the projection of pure-edge dis-
locations and are similar to the observations made by other
groups in various material systems [13, 15]. The pure-edge
dislocation density from various areas of the moire
´
fringes
averages to 6.62 9 10
10
cm
-2
. The THLs in the moire
´
fringes might also represent TDs as shown in Ref. [16].
The TDs revealed in this way are attributed to the half-
period shifts in the moire
´
fringes, which are produced as a
result of the interaction between 60° and 90° dislocations.
However, no half-period shifts are observed in the moire
´
fringes of IMF-grown GaSb samples as shown in Fig. 5a,
b. Moreover, no 60° dislocations are observed in the IMF
sample, which are considered to be the main source for the
formation of TD when the former interacts with the 90°
dislocations. Generally, distortions local to the interface,
such as stacking faults are revealed as displacements in
moire
´
fringes. In this study, displacement of the moire
´
fringes is not observed in the IMF samples, hence stacking
faults or partial dislocations are not ascribed to the IMF
growth. The moire
´
fringes are imaged along both [110] and
[1-10] using (220) and (2-20) g vectors as shown in Fig. 5c.
The projection of 2D Lomer dislocation network is
observed to be uniform over a large area that was imaged
(0.72 lm
2
).
Conclusions
In conclusion, high quality ‘‘buffer-free’’ GaSb is grown on
GaAs substrates with very low TD densities (*10
5
cm
-2
)
despite the high (7.8%) lattice mismatch. The strain due to
lattice mismatch is relieved immediately at the GaSb/GaAs
heterointerface with the help of periodic, pure-edge misfit
(IMF) arrays of dislocations along both [110] and [1-10] in
the IMF-grown GaSb. Instead, if the GaSb is deposited
using a non-IMF growth, the resulting epitaxial layer has
very high TD density (10
9
cm
-2
) due to buildup of strain in
tetragonal distortion. Comparing the IMF and non-IMF
samples using XRD and XTEM analyses have shown that
the strain is completely (98.5%) relieved in IMF sample,
whereas it is not the case for non-IMF sample. The plan-
view TEM analysis for both samples also confirmed similar
results, where the TD density is very low for IMF sample
(*10
5
cm
-2
) compared to non-IMF sample (*10
9
cm
-2
).
The long-range uniformity and the strain relief of the IMF-
grown GaSb epitaxial layer measured using the moire
´
fringe patterns have shown a uniform 2D Lomer disloca-
tion network over the entire scan area. The moire
´
fringe
spacing of 2.8 nm agrees well with the theoretical spacing
of 2.75 nm, which proves that the GaSb layer is completely
relaxed. Further proof of strain is also achieved from
SAED measurements, which shows that GaSb and GaAs
has lattice constants almost similar to the expected lattice
constants of the corresponding relaxed materials. We
believe that this approach is useful for the deposition of
‘‘buffer-free’’ high quality GaSb on well-studied GaAs
substrates in complex device structures.
Acknowledgments The authors gratefully acknowledge the finan-
cial support of AFOSR through FA 9550-08-1-0198.
References
1. R.A. Hogg, K. Suzuki, K. Tachibana, L. Finger, K. Hirakawa, Y.
Arakawa, Appl. Phys. Lett. 72, 2856 (1998)
2. L. Mu
¨
ller-Kirsch, R. Heitz, U.W. Pohl, D. Bimberg, I. Ha
¨
usler,
H. Kirmse, W. Neumann, Appl. Phys. Lett. 29, 1027 (2001)
3. V.N. Strocov, G.E. Cirlin, J. Sadowski, J. Kanski, R. Claessen,
Nanotechnology 16, 1326 (2005)
4. V.P. Kunets, S. Easwaran, W.T. Black, D. Guzun, I. Mazur Yu,
N. Goel, T.D. Mishima, M.B. Santos, G.J. Salamo, IEEE Trans.
Elec. Dev. 56(4), 683–687 (2009)
5. J.W. Matthews, A.E. Blakeslee, J. Cryst. Growth 29, 273 (1975)
6. B.R. Bennett, Appl. Phys. Lett. 73, 3736 (1998)
7. Y C. Xin, L.G. Vaughn, L.R. Dawson, A. Stintz, Y. Lin, L.F.
Lester, D.L. Huffaker, J. Appl. Phys. 94, 2133 (2003)
8. A. Jallipalli, G. Balakrishnan, S.H. Huang, L.R. Dawson, D.L.
Huffaker, J. Cryst. Growth 303, 449 (2007)
9. J. Tatebayashi, A. Jallipalli, M.N. Kutty, S.H. Huang, G. Bala-
krishnan, L.R. Dawson, D.L. Huffaker, Appl. Phys. Lett. 91,
141102 (2007)
10. S.H. Huang, G. Balakrishnan, A. Khoshakhalgh, A. Jallipalli,
L.R. Dawson, D.L. Huffaker, Appl. Phys. Lett. 88, 131911 (2006)
11. Z Q. Zhou, Y Q. Xu, R T. Hao, B. Tang, Z W. Ren, Z C. Niu,
Chin. Phys. Lett 26, 018101 (2009)
12. D.B. Williams, C.B. Carter, Transmission Electron Microscopy
Imaging III (Plenum press, New York, 1996)
13. Th. Kehagias, Ph. Komninou, G. Nouet, P. Ruterana, Th.
Karakostas, Phys. Rev. B 64, 195329 (2001)
14. P.B. Hirsch, A. Howie, R.B. Nicholson, D.W. Pashley, M.J.
Whealn, Electron Microscopy of Thin Crystals (Butter Worths,
London, 1969)
15. D.W. Pashley, J.W. Menter, G.A. Bassett, Nature 179, 752 (1957)
16. A. Rocher, E. Snoeck, Mater. Sci. Eng. B 67, 62 (1999)
1462 Nanoscale Res Lett (2009) 4:1458–1462
123