Báo cáo hóa học: " Research Article Identifying Genes Involved in Cyclic Processes by Combining Gene Expression Analysis and Prior Knowledge" pot
Bạn đang xem bản rút gọn của tài liệu. Xem và tải ngay bản đầy đủ của tài liệu tại đây (923.55 KB, 9 trang )
Hindawi Publishing Corporation
EURASIP Journal on Bioinformatics and Systems Biology
Volume 2009, Article ID 683463, 9 pages
doi:10.1155/2009/683463
Research Article
Identifying Genes Involved in Cyclic Processes by Combining
Gene Expression Analysis and Prior Knowledge
Wentao Zhao,
1
Erchin Serpedin (EURASIP Member),
1
and Edward R. Dougherty
1, 2
1
Department of Electrical and Computer Engineering, Texas A&M University, College Station, TX 77843-3128, USA
2
Computational Biology Division, Translational Genomics Research Institute, 400 North Fifth Street, Suite 1600,
Phoenix, AZ 85004, USA
Correspondence should be addressed to Erchin Serpedin,
Received 9 July 2008; Revised 24 December 2008; Accepted 26 January 2009
Recommended by Yufei Huang
Based on time series gene expressions, cyclic genes can be recognized via spectral analysis and statistical periodicity detection
tests. These cyclic genes are usually associated with cyclic biological processes, for example, cell cycle and circadian rhythm. The
power of a scheme is practically measured by comparing the detected periodically expressed genes with experimentally verified
genes participating in a cyclic process. However, in the above mentioned procedure the valuable prior knowledge only serves as
an evaluation benchmark, and it is not fully exploited in the implementation of the algorithm. In addition, partial data sets are
also disregarded due to their nonstationarity. This paper proposes a novel algorithm to identify cyclic-process-involved genes by
integrating the prior knowledge with the gene expression analysis. The proposed algorithm is applied on data sets corresponding
to Saccharomyces cerevisiae and Drosophila melanogaster, respectively. Biological evidences are found to validate the roles of the
discovered genes in cell cycle and circadian rhythm. Dendrograms are presented to cluster the identified genes and to reveal
expression patterns. It is corroborated that the proposed novel identification scheme provides a valuable technique for unveiling
pathways related to cyclic processes.
Copyright © 2009 Wentao Zhao et al. This is an open access article distributed under the Creative Commons Attribution License,
which permits unrestricted use, distribution, and reproduction in any medium, provided the original work is properly cited.
1. Introduction
The eukaryotic cell hosts several cyclic molecular processes,
for example, cell cycle and circadian rhythm. The tran-
scriptional events in these processes can be quantitatively
observed by measuring the concentration of the messenger
RNA (mRNA), which is transcribed from DNA and serves
as the template for synthesizing the corresponding protein.
To achieve this goal, the microarray experiments exploit
high-throughput gene chips to snapshot genome-wide gene
expressions sequentially at discrete time points. The sampled
time series data present three main characteristics. First,
most data sets present small sample size, for example, no
more than 50 data points. Obtaining large sample size data
sets is not financially affordable, and besides, in the long run
the cell culture loses synchronization and the data become
meaningless if they are sampled much later on. Second,
the data might not be evenly sampled, and many time
points could be missing. In order to capture critical events
with minimal cost, biologists usually conduct microarray
experiments and make measurements when these events
happen. Third, the data are highly corrupted by experimental
noise, and a robust stochastic analysis is desired.
Based on time series data, various approaches have been
proposed to identify periodically expressed genes, which are
sometimes believed to be involved in the cell cycle. Assuming
the cell cycle signal to be a simple sinusoid, Spellman et al. [1]
and Whitfield et al. [2] performed Fourier transformations
on the data sampled with different synchronization methods,
Wichertetal.[3] applied the traditional periodogram and
Fisher’s test, while Ahdesm
¨
aki et al. [4] implemented a
robust periodicity test assuming non-Gaussian noise. In [5],
Giurc
ˇ
aneanu explored the stochastic complexity of detecting
periodically expressed genes by means of generalized Gaus-
sian distributions. Alternatively, Luan and Li [6] employed
guide genes and constructed cubic B-spline-based periodic
functions for modeling, while Lu et al. [7] employed up
to third harmonics to fit the data and proposed a periodic
2 EURASIP Journal on Bioinformatics and Systems Biology
normal mixture model. De Lichtenberg et al. [8]compared
the approaches [1, 6, 7] and proposed a new score combining
the periodicity and regulation magnitude. Interestingly,
the mathematically more advanced methods seem not to
achieve a better performance compared with the original
Spellman’s method that relies on the Fast Fourier Transform
(FFT) method. As an important observation, notice that the
majority of these works deal only with evenly sampled data.
When data points are missing, in general for the adopted
methods, the vacancies are usually filled by interpolation in
time domain for all genes, or the genes are disregarded if
there are more than 30% of data samples missing.
The biological experiments generally output unevenly
spaced measurements. The change of sampling frequency
can be attributed to missing data. Besides, the measurements
are usually event-driven, that is, more observations are
recorded when certain biological events happen, and the
observational process is slowed down when the cell remains
quiet or no event of interest occurs. Therefore, the analysis
based on unevenly sampled data sets is practically more
desirable and technically more challenging. Notice that in
the case of uneven sampling, the harmonics exploited in the
discrete Fourier transform (DFT) are no longer orthogonal.
Lomb [9]andScargle[10] demonstrated that a phase
shift suffices to make the sine and cosine terms orthogonal
again, and consequently a spectral estimator can be designed
in the presence of uneven sampling. The Lomb-Scargle
scheme has been exploited by Glynn et al. [11] in analyzing
the budding yeast data set. Notice also that a number of
alternative schemes were proposed recently to cope with
missing and/or irregularly spaced data samples. Stoica and
Sandgren [12] updated the traditional Capon method to
cope with the irregularly sampled data. Wang et al. [13]
designed the missing-data amplitude and phase estimation
(MAPES) approach, which estimated the missing data and
spectra iteratively through the Expectation Maximization
(EM) algorithm. Although Capon and MAPES methods aim
to achieve a better spectral resolution than Lomb-Scargle
periodogram, for small sample size, the simpler Lomb-
Scargle scheme appears to possess better performance in the
presence of realistic biological data [14].
Most of the algorithms proposed in literature identify
cyclic genes by exploiting mathematical models to explain
the gene’s time series pattern. Employing these models and
statistical tests, the periodically expressed genes are normally
identified. Finally, the detected genes are compared with the
genes that had been experimentally discovered to participate
in specific processes like cell cycle. Notice that these prac-
tically verified cycle-involved genes only serve as a golden
benchmark to evaluate the performance of the proposed
identification algorithms. They are not fully exploited in
the implementation of the identification algorithm. Notice
also that most of the existing algorithms fail to utilize all
the available data information. For example, the elutriation
data provided in [1] was usually discarded when performing
the spectral analysis. In other experiments, some data sets
were also disregarded due to either loss of synchronization
or nonstationarity. Herein, we propose a novel algorithm
to detect periodically expressed genes by integrating the
gene expression analysis with the valuable prior knowledge
offered by all available data. The prior knowledge can
consist of two data sets, that is, the set of genes involved
in a cyclic process and the set of noncycle-involved genes
recognized in biological experiments. The cycle-involved
genes are used to initialize the proposed algorithm, and
the noncycle-involved genes are employed to control the
false positives. The expression analysis is composed of the
spectral estimation technique and the computation of gene
expression distance. The underlying approach relies on the
assumption that genes expressing similarly with genes of
a process of interest are also likely to participate in that
process. This assumption is actually exploited to apply
the clustering schemes on the microarray measurements in
order to partition genes into different functional groups.
The proposed algorithm identifies potential cyclic-process-
involved genes and guarantees that the verified cycle genes
will be included with 100% certainty into the output gene set,
and at the same time the verified noncycle-involved genes are
removed from the derived set with 100% certainty. Although
most of the existing power-spectra-based algorithms can be
crafted into the proposed algorithm seamlessly, herein we are
using the Lomb-Scargle periodogram due to its simplicity
and good performance. The proposed algorithm will also lay
a ground for the following cycle pathway research.
2. Methods
The proposed algorithm is composed of a spectral density
analysis and a gene distance computation based on the
time series microarray data. All existing spectral analysis
schemes can be incorporated into the proposed algorithm.
However, the Lomb-Scargle periodogram is recommended
here due to its convenience of implementation and excellent
performance for small sample size. The nonparametric
Spearman’s correlation coefficient is accepted to construct
the measure of distance between two genes.
2.1. Lomb-Scargle Periodogram and Periodic ity Detection.
Microarray measurements usually have a large portion of
missing data points. Besides, the sampling frequency is tuned
to adapt to nonuniformly occurring events. Lomb-Scargle
periodogram appears as an excellent candidate for analyzing
these irregular data [14].
Given m time-series observations (t
l
, x
l
), l = 0, , m−1,
where t stands for the time tag, and x denotes the sampled
expression of a specific gene, the normalized Lomb-Scargle
periodogram at angular frequency ω is defined as follows:
Φ
LS
(ω) =
1
2σ
2
(
m−1
l=0
[x
l
−x]cos[ω(t
l
−τ)])
2
m−1
l
=0
cos
2
[ω(t
l
−τ)]
+
(
m−1
l
=0
[x
l
−x] sin[ω(t
l
−τ)])
2
m−1
l=0
sin
2
[ω(t
l
−τ)]
,
(1)
EURASIP Journal on Bioinformatics and Systems Biology 3
1: Input gene expression measurements, all sampled genes (referred as Ω),
experimentally verified cycle-involved genes (denoted as G),
noncycle-involved genes (represented as F) and priori frequency range
[ω
1
, ω
2
];
2: Perform power spectral analysis on gene expression data;
3: Perform statistical tests so that the periodically expressed genes are
recognized and stored in set C;
4: for each x
i
∈ C do
5: if ω
Φ
max
/
∈[ω
1
, ω
2
] then
6: C
← C −{x
i
}
7: end
8: end
9: G
← G ∪C, F
← F, specify the distance threshold t;
10: repeat /
∗ iterative accumulation ∗/
11: G
← G
;
12: for each x
i
∈ Ω, g
i
∈ G do
13: if d(x
i
, g
i
) <tthen
14: G
← G
∪{x
i
};
15: end
16: end
17: until G
/
=G
;
18: repeat /
∗ false positive control ∗/
19: F
← F
;
20: for each x
i
∈ Ω, f
j
∈ F do
21: if d(x
i
, f
j
) <tthen
22: F
← F
∪{x
i
};
23: end
24: end
25: until F
/
=F
;
26: G
← G −F;
27: Output G;
Algorithm 1: Identifying cyclic process involved genes.
where x and σ
2
stand for the mean and variance of the
sampled data, respectively, and τ is defined as follows:
τ
=
1
2ω
a tan
m−1
l
=0
sin(2ωt
l
)
m−1
l=0
cos(2ωt
l
)
. (2)
Let δ be the greatest common divisor (gcd) for all
intervals t
k
−t
l
(k
/
=l); Eyer and Bartholdi in [15] proved that
the highest frequency that should be searched is given by
f
max
=
ω
max
2π
=
1
2δ
. (3)
Based on the obtained power spectral density, each gene
is to be classified as either cyclic or noncyclic. The null
hypothesis is usually formed to assume that the measure-
ments are generated by a Gaussian noise stochastic process.
For the Lomb-Scargle periodogram, Φ
LS
(ω) was shown
to be exponentially distributed under the null hypothesis
[10], a result which was also exploited in [11]. However,
recently Schwarzenberg-Czerny reported in [16] that a beta
distribution is more appropriate for small sample size
frameworks and the P-value for detecting the largest peak
Φ
max
is given by
P(T>t)
= 1 −
1 −
1 −
2Φ
max
m
m/2
m
. (4)
A rejection of the null hypothesis based on a P-value
threshold implies that the power spectral density contains
a frequency with magnitude substantially greater than the
average value. This indicates that the time series data contain
a periodic signal, and the corresponding gene is cyclic in
expression.
In order to prevent the false positives from overwhelming
the true positives, the multiple testing correction is per-
formed to control the q-value, which is defined as
q
k
= min
k≤j≤n
p
(j)
n
j
,(5)
where n stands for the number of measured genes, and
p
(j)
represents the sorted P-values in ascending order. The
part being minimized is an estimate of False Discovery Rate
(FDR). Given a q-value threshold θ, through which the
number of genes to preserve can then be derived as
k
= max
1≤j≤n
q
j
≤ θ. (6)
2.2. Gene Distance Measure. A gene is identified to be a
cyclic gene if it satisfies either of two conditions: it passes the
periodicity test which is performed on the gene expression
measurements, or it is within a small distance from the ver-
ified cyclic-process-involved genes. Various distance metrics
4 EURASIP Journal on Bioinformatics and Systems Biology
have been proposed in the clustering literature to capture the
distance between genes. These include Pearson’s correlation,
Euclidean distance, city block distance, mutual information.
Because the biological samples are generally highly corrupted
and the rank statistics tests, as nonparametric methods,
usually behave better when extreme observation exists, we
accept here Spearman’s correlation coefficient as the core of
our distance measure. This distance is obtained for two genes
x and y between their expressions across all the available
experiments as follows:
d(x, y)
= 1 −
1 −
6
m
i=1
(x
i
− y
i
)
m(m
2
−1)
,(7)
where (x
i
, y
i
) stand for the rank pair of the measurements
of genes x and y. The parameter m counts the number
of sampling points where both gene x and gene y present
available observations. This distance measure always assumes
values between 0 and 1.
2.3. Algorithm Formulation. The proposed algorithm is
formulated as Algorithm 1. Lines 1 to 9 accept inputs and
initialize the target cyclic gene set with the spectral analysis
results and the prior cycle-involved genes. Inside them lines
4 to 8 exclude genes whose peak periodicity, ω
Φ
max
,isin
contrast with the prior knowledge of the frequency range
[ω
1
, ω
2
] of the researched phenomenon. Lines 10 to 17
represent the iterative accumulation part. They iteratively
insert into the potential cyclic gene set the genes expressed
similarly as the genes within that set. Lines 18 to 25 stand for
the false positive control part, which constructs the control
set iteratively to suppress the potential false positives by using
the prior knowledge. Line 26 subtracts the control set from
the established target set and finalizes the cyclic gene set.
The simulation results on the yeast data set showed that the
iterative accumulation part controls the false positives pretty
well.
The algorithm will surely converge to a set. This is
because in each iteration of the accumulation and false
positive control part, there have to be new members added
into the target gene sets. The number of set members keeps
increasing, and the set in the previous iteration is a subset
of the later set. However, this increase is upper-bounded
by the full gene set that contains all the measured genes.
Therefore, both the iterative accumulation part and false
positive control part converge, and the proposed algorithm
also converges.
Usually some general idea about the phenomenon of
interest can be used to determine the two bounds ω
1
and ω
2
of the frequency range. For example, the circadian rhythm
has a periodicity around 24 hours, which can be somehow
compressed or prolonged by experimental protocols. If no
prior knowledge exists, the set (0,
∞)canbeused.The
other two thresholds are to be specified. The first is the
threshold for the periodicity test. To effectively control the
false alarm rate, multiple testing correction can be applied
and a q-value threshold θ can be specified. In practice,
θ can be chosen around 0.15. This threshold can also be
decided by comparing the spectral analysis results with
the prior knowledge. Such an approach is more attractive
when the proposed algorithm is combined with other
periodicity detection methods. We are inclined to use a
more stringent threshold, which also represents a trade-off
between the number of conserved genes and the number of
experimentally verified genes. The second threshold is the
distance threshold t. It keeps decreasing along the iteration.
For example, the initial value is assigned to be 0.25, which
means high correlation according to Cohen’s rule of thumb
[17]. Each iteration decreases this threshold by 0.05 until it
reaches 0.1, then it remains constant at 0.1. This technique in
practice helps to prevent the amplification of false positives.
3. Results
The proposed algorithm was applied on the data sets
provided by unicellular Saccharomyces cerevisiae (budding
yeast) and multicellular Drosophila melanogaster (fruit fly),
respectively. The in silico results are discussed briefly here.
The full list of identified potential cell cycle genes is presented
in the additional files.
3.1. Case Study 1: Saccharomyces cerevisiae. Although various
time series data sets have been available, including the
experiments on human cells [2], the yeast data set published
by Spellman et al. [1] is still among the most popular research
targets or benchmarks of computational biology, since this
data set excels in its large size of samples and the simplicity
of the genome. The mRNA concentrations of nearly 6200
Open Reading Frames (ORF) were measured for the yeast
strains synchronized by using four different methods, that is,
α factor, cdc15, cdc28, and elutriation. The data set contained
in total 73 sampling points for all genes, while there existed
missing observations for some experiments. The detected
periodicity matched the yeast cell cycle. Our prior knowledge
was derived from two sources: Spellman et al. [1]revised
104 cell cycle genes that were verified in previous biological
experiments, while de Lichtenberg et al. [18] summarized
105 genes that were not involved in the cell cycle.
Spellman et al. [1] designed a periodicity metric, namely,
CDC score, based on the Fast Fourier Transform (FFT) of
three experiments α factor, cdc15, and cdc28. The obser-
vations of elutriation were discarded due to a computation
obstacle. Although later a bunch of other methods were
proposed to identify the cell cycle genes, for example,
[3, 6, 7], de Lichtenberg found that Spellman’s FFT-based
method still excelled in testing power and detected the
most verified cell cycle genes [8]. However, as admitted in
[1], the selection of the number of conserved genes was
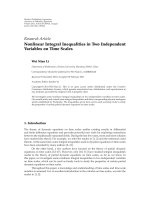
fairly arbitrary. As Figure 1 illustrates, when the number
of conserved genes increases, the number of verified genes
increases at a decreasing rate. Actually, after 400 genes have
been identified, the curve becomes relatively flat. Therefore,
we conserved the 400 genes with top CDC scores as the
initialization set in the proposed algorithm. This means a
more stringent test threshold for the spectral analysis part.
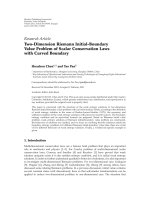
Figure 2 compares the simulation results with the 800
genes identified by Spellman et al. [1]. Before the running of
EURASIP Journal on Bioinformatics and Systems Biology 5
0
10
20
30
40
50
60
70
80
90
100
Number of verified genes
0 100 200 300 400 500 600 700 800
Number of conserved genes
Figure 1: Performance of Spellman et al.’s CDC score on Saccha-
romyces cerevisiae data. A specified number of genes are conserved
as periodically expressed genes. These genes are compared with the
published 104 cell cycle involved genes. The matched genes are
counted. Most experimentally discovered cell cycle genes possess
high periodicity scores. When the number of conserved genes is
greater than 400, Spellman et al. method’s identification ability
degenerates, as shown by the flat tail of the curve.
the false positive control, the proposed algorithm identified
725 genes, in which 104 genes were from the prior experi-
mental knowledge, and 400 genes were from Spellman et al.’s
spectral analysis method. These two sets overlapped in 84
genes. We identified 199 genes that were neither identified by
Spellman et al.’s method nor reported in the prior knowledge
of the 104 genes. The false positive control removed 3 genes
and left 722 genes marked as potential cell cycle involved
genes. The identified genes are provided in the additional
files in MS Excel format.
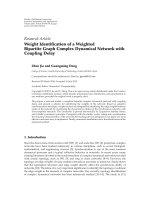
As an example of a gene detected by the proposed
algorithm, Figures 3(a)–3(d) plot time series data for two
genes CWP2 (YKL096W-A) and CCW12 (YLR110C). These
two genes indicated a strong correlation, with the correlation
coefficient 0.19, in their expressions for all four experiments.
Both genes are annotated to encode cell wall mannoprotein.
CWP2 is cell-cycle regulated at the S/G2 phase [19]. It was
assigned a CDC score of 2.031, which ranked 478 in all
ORFs. Therefore, it was selected in Spellman et al.’s 800
genes. A stringent CDC score threshold, for example, 2.37
that conserves 400 genes, will make CWP2 discarded from
cell cycle genes. CCW12 was not selected in Spellman et
al.’s 800 genes because its CDC score was 0.297, which was
very low and ranked 4092 in all genes. It has been found
that the cell wall accounts for around 30% of the cell dry
weight, and its construction tightly coordinated with the
cell cycle [20]. Smits et al. [21] summarized that among
43 discovered cell wall protein encoding genes, in which
CCW12 was not included at that time, more than half of
them were verified to be cell-cycle regulated. In other words,
cell wall proteins are highly likely to be involved in the cell
10 10 84
199
(1)
316
106
(2)
284
(2)
725 genes identified by the proposed algorithm
800 genes identified by Spellman et. al.
400 periodic genes used in initialization of
the proposed algorithm
104 genes verified in previous experiments
Figure 2: Venn graph of identified Saccharomyces cerevisiae genes.
The proposed algorithm identified 722 genes as potential cell cycle
genes. 725 genes were identified before running the false positive
control procedure. False positive control removed 3 genes, which
are marked within the parenthesis. Various sets are differentiated by
their colors.
proliferation process. Based on the similarity between the
expressions of CWP2 and CCW12 in the cell cycle arrest
experiments, we hypothesize that CCW12 is also cell cycle
regulated at phase S/G2.
All the detected 722 genes are hierarchically clustered
in Figure 4. The hierarchical clustering was selected mainly
because it was convenient for visualization, and it avoided
to specify the number of desired clusters. It is worthy
to note that more advanced methods, for example, self
organizing map (SOM) [22] could achieve a better clustering
performance. Most clusters indicate a strong periodicity
pattern, as can be discerned by the red and green regions
which are positioned alternately. There is an exotic cluster,
which exhibits fast oscillation in the cdc15 experiments. This
cluster contains 130 genes that are illustrated in Figure 5.By
examining the existing annotations for these genes, we found
that most of them either encode nucleolar proteins or are
involved in ribosome biogenesis. It has been verified that
ribosome biogenesis consumes up to 80% of proliferating
energy, and it is linked to cell cycle in metazoan cells.
However, in yeast, the ribosome biogenesis is not regulated
by the cell cycle in the same manner as in advanced
organisms due to the closed mitosis of the yeast [23]. Defects
in nucleolar genes halt the cell at the Start checkpoint [24].
The ribosome biogenesis controls the growth of the size and
inhibits the cell cycle until the cell has reached a satisfiable
size [25].
In order to measure valid time series samples, the cell
culture has to be synchronized. In other words, all cells
within the culture should be homogeneous in all aspects,
for example, cell size, DNA, RNA, protein, and other
6 EURASIP Journal on Bioinformatics and Systems Biology
−2
−1.5
−1
−0.5
0
0.5
1
1.5
2
Expression
0 20 40 60 80 100
Time (min)
YKL096W-A
YLR110C
(a) Alpha data set
−2
−1.5
−1
−0.5
0
0.5
1
1.5
2
Expression
50 100 150 200 250
Time (min)
YKL096W-A
YLR110C
(b) cdc15 data set
−3
−2.5
−2
−1.5
−1
−0.5
0
0.5
1
1.5
2
Expression
0 20 40 60 80 100 120 140 160
Time (min)
YKL096W-A
YLR110C
(c) cdc28 data set
−2
−1.5
−1
−0.5
0
0.5
1
1.5
2
Expression
0 50 100 150 200 250 300 350
Time (min)
YKL096W-A
YLR110C
(d) Elutriation data set
Figure 3: YKL096W-A(CWP1) and YLR110C(CCW12) time series expressions in four datasets. Both CWP1 and CCW12 are cell wall
protein encoding genes. CWP1 has been verified to be involved in the cell cycle experiment.
cellular contents. Cooper in [26, 27] argued that the ideal
synchronization is an impossible mission because different
dimensions, like cell size and DNA content, could not be
controlled at the same time. Therefore, current popular
synchronization methods, like serum starvation and thymi-
dine blocking, are only one-dimensional synchronization
methods and fail to achieve a complete synchronization. It
is fully possible that the discovered periodicity is completely
caused by chance or by the specific synchronization method.
Based on the Spellman et al.’s spectral analysis with CDC
scores, it is obvious that the most experimentally verified
cell cycle genes exhibit top CDC scores. Hence, the spectral
analysis is still highly valuable. However, due to the loss of
synchronization and nonstationarity, the choice of threshold
for the periodicity test has to be much more stringent in
order to suppress false positives. When the cell culture is
not ideally synchronized or stationary, the spectral analysis
may fail for some data sets, such as the elutriation data set.
However, the proposed algorithm is still capable to identify
a set of genes which are closely correlated to the verified cell
cycle genes based on all the available data. The exploitation
of the prior knowledge, consisting of experimentally verified
cell cycle genes and noncell-cycle genes, can help to improve
the detection accuracy and combat the negative effects
induced by the loss of synchronization and nonstationarity.
3.2. Case Study 2: Drosophila melanogaster. The multicellular
Drosophila melanogaster serves as a good prototype for the
EURASIP Journal on Bioinformatics and Systems Biology 7
−4
−3
−2
−1
1
0
2
3
4
Alpha cdc15 cdc28 Elu.
Figure 4: Clustering analysis of identified Saccharomyces cerevisiae
genes. Gene expression levels are indicated by the heatmap. There
are 722 genes identified by the proposed algorithm to participate in
the cell cycle. Most genes exhibit strong periodicity, as indicated by
alternately positioned red and green regions.
−1.5
−1
−0.5
0
0.5
1
1.5
Alpha cdc15 cdc28 Elu.
Figure 5: The exotic clustering of identified Saccharomyces Cere-
visiae genes. Gene expression levels are indicated by the heatmap.
This cluster contains 130 genes. The gene expressions in the cdc15
experiment oscillate between low and high levels. Most of these
genesarenucleolargenes.
research of mammalian diseases because it has only 4 pairs
of chromosomes, on which are located abundant genes with
mammalian analogs. Our in silico experiments are performed
on the Drosophila melanogaster data set published by Arbeit-
man et al. [28]. With the usage of cDNA microarrays, the
RNA expression levels of 4028 genes were measured, and
these stood for about one-third of all found fruit fly genes.
The synchronization of the cell culture was yielded by the
Cryonics method. In Arbeitman et al.’s experiments, 75
sequential sampling points were observed, starting right after
fertilization and through embryonic, larval, pupal, and early
−5
−4
−3
−2
−1
1
0
2
3
4
5
Embryo Lava Pupal Male Female
Figure 6: Clustering analysis of identified Drosophila melanogaster
genes. Gene expression levels are indicated by the heatmap. There
are 344 genes identified by the proposed algorithm to be involved
in the circadian rhythm. The dendrogram can be split into the top
and bottom groups, respectively, which are complementary in their
expressions.
days of adulthood. There were 134 experimentally verified
cycling circadian genes [29]. Among these 134 genes, 52
were measured in Arbeitman’s experiment [28]. We did
not locate the set of noncell-cycle genes in the Drosophila
literature. Therefore, the false positive control procedure was
not performed. The least time interval between any two
sampling points was 30 minutes, which was much larger than
the Drosophila’s cell cycle period. However, the pupal data
set had sufficient sampling points to provide insights into the
circadian rhythm.
The spectral analysis was accomplished by applying the
Lomb-Scargle periodogram on the nonuniformly sampled
pupal data. We found that cyclic genes concentrated most
of the power spectral density at the frequency band with
the period of tens of hours. By posing a q-value threshold
at 0.1, 50 genes were preserved for the initialization of the
proposed algorithm. Then, there were 344 genes identified
by the proposed algorithm. A dendrogram for these genes is
illustrated in Figure 6. The top and bottom parts constitute
two complementary groups. Most of the experimentally
verified genes (46 out of 52) are located in the bottom part,
exhibit a transition from the repressed level to the induced
level around the time of 11 hours after fertilization.
Two most extensively studied genes involved in the
Drosophila circadian rhythm are per and clk.InArbeitman’s
experiment, clk showed relatively prominent periodicity in
the pupal stage. However, the period was prolonged to be
more than 24 hours. This was due to the fact that the
synchronization method slowed down the biological process.
Unfortunately, per was not measured in the experiment.
A large portion of identified genes have been verified
to participate in metabolism, a process closely controlled
by circadian rhythm. A cross-species knowledge might be
valuable. However, special precautions must be considered
8 EURASIP Journal on Bioinformatics and Systems Biology
when the two organisms are too different, like the yeast
and fly. The yeast is a unicellular organism with closed
mitosis while fly is multi-cellular with open mitosis. The
difference between multicellular organisms is less prominent.
Therefore, we hypothesize that the prior knowledge of the
Drosophila might be valuable for the identification of more
advanced species, for example, Homosapiens. The complete
list of identified genes is provided in the supplementary
materials [30].
4. Conclusions
A novel algorithm is proposed to identify the cyclic-process-
involved genes through the incorporation of microarray data
analysis with the prior knowledge of genes participating in
the cyclic process. The in silico experiments were conducted
based on the data sets corresponding to the unicellular
Saccharomyces cerevisiae and the multicellular Drosophila
melanogaster. The potential cell cycle and circadian rhythmic
genes were identified and compared with the existing
computational results. It is corroborated that the proposed
algorithm is capable to exploit all the available data and
propose potential cycle-involved genes.
References
[1] P. T. Spellman, G. Sherlock, M. Q. Zhang, et al., “Com-
prehensive identification of cell cycle-regulated genes of the
yeast Saccharomyces cere visiae by microarray hybridization,”
Molecular Biology of the Cell, vol. 9, no. 12, pp. 3273–3297,
1998.
[2] M. L. Whitfield, G. Sherlock, A. J. Saldanha, et al., “Identifi-
cation of genes periodically expressed in the human cell cycle
and their expression in tumors,” Molecular Biology of the Cell,
vol. 13, no. 6, pp. 1977–2000, 2002.
[3] S. Wichert, K. Fonkianos, and K. Strimmer, “Identifying
periodically expressed trascripts in microarry time series
data,” Bioinformatics, vol. 20, no. 1, pp. 5–20, 2004.
[4] M. Ahdesm
¨
aki, H. L
¨
ahdesm
¨
aki, R. Pearson, H. Huttunen,
and O. Yli-Harja, “Robust detection of periodic time series
measured from biological systems,” BMC Bioinfor m atics, vol.
6, article 117, pp. 1–18, 2005.
[5]C.D.Giurc
ˇ
aneanu, “Stochastic complexity for the detection
of periodically expressed genes,” in Proceedings of the 5th
IEEE International Workshop on Genomic Signal Processing and
Statistics (GENSIPS ’07), pp. 1–4, Tuusula, Finland, June 2007.
[6] Y. Luan and H. Li, “Model-based methods for identifying
periodically expressed genes based on time course microarray
gene expression data,” Bioinformatics, vol. 20, no. 3, pp. 332–
339, 2004.
[7] X. Lu, W. Zhang, Z. S. Qin, K. E. Kwast, and J. S. Liu, “Statisti-
cal resynchronization and Bayesian detection of periodically
expressed genes,” Nucleic Acids Research, vol. 32, no. 2, pp.
447–455, 2004.
[8] U. de Lichtenberg, L. J. Jensen, A. Fausbøll, T. S. Jensen,
P. Bork, and S. Brunak, “Comparison of computational
methods for the identification of cell cycle-regulated genes,”
Bioinformatics, vol. 21, no. 7, pp. 1164–1171, 2005.
[9] N. R. Lomb, “Least-squares frequency analysis of unequally
spaced data,” Astrophysics and Space Science,vol.39,no.2,pp.
447–462, 1976.
[10] J. D. Scargle, “Studies in astronomical time series analysis—II.
Statistical aspects of spectral analysis of unevenly spaced data,”
The Astrophysics Journal, vol. 263, pp. 835–853, 1982.
[11] E. F. Glynn, J. Chen, and A. R. Mushegian, “Detecting periodic
patterns in unevenly spaced gene expression time series using
Lomb-Scargle periodograms,” Bioinformatics,vol.22,no.3,
pp. 310–316, 2006.
[12] P. Stoica and N. Sandgren, “Spectral analysis of irregularly-
sampled data: paralleling the regularly-sampled data
approaches,” DigitalSignalProcessing,vol.16,no.6,pp.
712–734, 2006.
[13] Y. Wang, P. Stoica, J. Li, and T. L. Marzetta, “Nonparametric
spectral analysis with missing data via the EM algorithm,”
DigitalSignalProcessing, vol. 15, no. 2, pp. 191–206, 2005.
[14] W. Zhao, K. Agyepong, E. Serpedin, and E. R. Dougherty,
“Detecting periodic genes from irregularly sampled gene
expressions: a comparison study,” EURASIP Journal on Bioin-
formaticsandSystemsBiology, vol. 2008, Article ID 769293, 8
pages, 2008.
[15] L. Eyer and P. Bartholdi, “Variable stars: which Nyquist
frequency?” Astronomy and Astrophysics Suppleme nt Series,
vol. 135, no. 1, pp. 1–3, 1999.
[16] A. Schwarzenberg-Czerny, “The distribution of empirical
periodograms: Lomb-Scargle and PDM spectra,” Monthly
Notices of the Royal Astronomical Society, vol. 301, no. 3, pp.
831–840, 1998.
[17] J. Cohen, Statistical Power Analysis for the Behavioral Sciences,
Lawrence Erlbaum, Hillsdale, NJ, USA, 2nd edition, 1988.
[18] U. de Lichtenberg, R. Wernersson, T. S. Jensen, et al., “New
weakly expressed cell cycle-regulated genes in yeast,” Yea st
, vol.
22, no. 15, pp. 1191–1201, 2005.
[19] L. H. P. Caro, G. J. Smits, P. van Egmond, J. W. Chapman,
and F. M. Klis, “Transcription of multiple cell wall protein-
encoding genes in Saccharomyces cerev isiae is differentially
regulated during the cell cycle,” FEMS Microbiology Letters,
vol. 161, no. 2, pp. 345–349, 1998.
[20] F. M. Klis, A. Boorsma, and P. W. J. De Groot, “Cell wall
construction in Saccharomyces cerevisiae,” Ye as t,vol.23,no.3,
pp. 185–202, 2006.
[21] G. J. Smits, J. C. Kapteyn, H. van den Ende, and F. M. Klis,
“Cell wall dynamics in yeast,” Current Opinion in Microbiology,
vol. 2, no. 4, pp. 348–352, 1999.
[22] P. Tamayo, D. Slonim, J. Mesirov, et al., “Interpreting patterns
of gene expression with self-organizing maps: methods and
application to hematopoietic differentiation,” Proceedings of
the National Academy of Sciences of the United States of
America, vol. 96, no. 6, pp. 2907–2912, 1999.
[23] K. A. Bernstein and S. J. Baserga, “The small subunit
processome is required for cell cycle progression at G1,”
Molecular Biology of the Cell, vol. 15, no. 11, pp. 5038–5046,
2004.
[24] K. A. Bernstein, F. Bleichert, J. M. Bean, F. R. Cross, and S. J.
Baserga, “Ribosome biogenesis is sensed at the start cell cycle
checkpoint,” Molecular Biology of the Cell, vol. 18, no. 3, pp.
953–964, 2007.
[25] G. Thomas, “An encore for ribosome biogenesis in the control
of cell proliferation,” Nature Cell Biology, vol. 2, no. 5, pp. E71–
E72, 2000.
[26] S. Cooper, “Rethinking synchronization of mammalian cells
for cell cycle analysis,” Cellular and Molecular Life Sciences, vol.
60, no. 6, pp. 1099–1106, 2003.
[27] S. Cooper, “Rejoinder: whole-culture synchronization cannot,
and does not, synchronize cells,” Trends in Biotechnology, vol.
22, no. 6, pp. 274–276, 2004.
EURASIP Journal on Bioinformatics and Systems Biology 9
[28] M. N. Arbeitman, E. E. M. Furlong, F. Imam, et al., “Gene
expression during the life cycle of D rosophila melanogaster,”
Science, vol. 297, no. 5590, pp. 2270–2275, 2002.
[29] M. J. McDonald and M. Rosbash, “Microarray analysis and
organization of circadian gene expression in Drosophila,” Cell,
vol. 107, no. 5, pp. 567–578, 2001.
[30] Supplementary Materials, />∼wtzha-
o/FlyCellCycleGenes.xls.