Báo cáo hóa học: " Research Article Spectral Preprocessing for Clustering Time-Series Gene Expressions" potx
Bạn đang xem bản rút gọn của tài liệu. Xem và tải ngay bản đầy đủ của tài liệu tại đây (670.68 KB, 10 trang )
Hindawi Publishing Corporation
EURASIP Journal on Bioinformatics and Systems Biology
Volume 2009, Article ID 713248, 10 pages
doi:10.1155/2009/713248
Research Article
Spectral Preprocessing for Clustering Time-Series
Gene Expressions
Wentao Zhao,
1
Erchin Serpedin (EURASIP Member),
1
and Edward R. Dougherty
2
1
Electrical and Computer Engineering Department, Texas A&M University, College Station, TX 77843, USA
2
Translational Genomics Research Institute, 400 North Fifth Street, Suite 1600, Phoenix, AZ 85004, USA
Correspondence should be addressed to Erchin Serpedin,
Received 31 July 2008; Accepted 19 January 2009
Recommended by Yufei Huang
Based on gene expression profiles, genes can be partitioned into clusters, which might be associated with biological processes or
functions, for example, cell cycle, circadian rhythm, and so forth. This paper proposes a novel clustering preprocessing strategy
which combines clustering with spectral estimation techniques so that the time information present in time series gene expressions
is fully exploited. By comparing the clustering results with a set of biologically annotated yeast cell-cycle genes, the proposed
clustering strategy is corroborated to yield significantly different clusters from those created by the traditional expression-based
schemes. The proposed technique is especially helpful in grouping genes participating in time-regulated processes.
Copyright © 2009 Wentao Zhao et al. This is an open access article distributed under the Creative Commons Attribution License,
which permits unrestricted use, distribution, and reproduction in any medium, provided the original work is properly cited.
1. Introduction
A cell is the basic unit of life, and each cell contains
instructions necessary for its proper functioning. These
instructions are encoded in the form of DNAs that are
replicated and transmitted to its progeny when the cell
divides. mRNAs are middle products in this process. They
are transcribed from DNA segments (genes) and serve
as the templates for protein translation. This conduit of
information constitutes the ce ntral dogma of molecular
biology. The fast evolving gene microarray technology has
enabled simultaneous measurement of genome-wide gene
expressions in terms of mRNA concentrations. There are
two types of microarray data: time series and steady state.
Time-series data are obtained by sequential measurements in
temporal experiments, while steady-state data are produced
by recording gene expressions from independent sources, for
example, different individuals, tissues, experiments, and so
forth. The high costs, ethical concerns, and implementation
issues prevent from collecting large time-series data sets.
Therefore, about 70% of the data sets are steady state [1], and
most of time-series data sets contain only a few time points,
in general less than 20 samples.
Based on microarray measurements, clustering methods
have been exploited to partition genes into subsets. Members
in each subset are assumed to share specific biological
function or participate in the same molecular-level process.
They are termed as coexpressed genes and are supposed
to be located closely in the underlying genetic regulatory
networks. Eisen et al. [2] applied the hierarchical clustering
to partition yeast genes, Tamayo et al. [3] exploited the self-
organizing map (SOM), and Tavazoie et al. [4] employed K-
means clustering to group gene expressions and then search
upstream DNA sequence motifs that contribute to the coex-
pression of genes. Besides the above mentioned successful
applications, Zhou et al. [5] designed a clustering strategy
by minimizing the mutual information between clusters,
and bootstrap techniques were combined with heuristic
search to solve the underlying optimization problem. Also,
Giurc
˘
aneanu et al. [6] exploited the minimum description
length (MDL) principle to determine the number of clusters.
Whether technically advanced schemes represent better solu-
tions for real biological data is still under debate. However,
usually most of the schemes provide valuable alternatives
and insights to each other. Therefore, it was recommended
that several clustering schemes be performed to analyze
the same real data set [7] so that the difference between
clusterings would capture some patterns that otherwise
would be neglected by running only one method.
2 EURASIP Journal on Bioinformatics and Systems Biology
A straightforward application of clustering schemes will
cause the loss of temporal information inherent in the time-
series measurements. This shortcoming has been noticed in
literature. Ramoni et al. [8] designed a model-based Bayesian
method to cluster the time-series data and specified the num-
ber of clusters intelligently, Tabus and Astola [9] proposed to
fit the data by linear dynamic systems, and Ernst et al. [10]
presented an algorithm especially for short time series. In
these models genes in the same cluster were assumed to share
similar time domain profile. The temporal relationships were
also explored via more complex models, that is, genetic
regulatory networks, which can be constructed via more
computationally-demanding algorithms, for example, Zhao
et al. [11] and Liang et al. [12]. However, in general,
the network inference schemes deal only with relatively
small-scale networks consisting of less than hundreds of
genes. Genome wide analysis is beyond the computational
capability of these inference algorithms. Therefore, clustering
methods are usually exploited to partition genes, and the
obtained subsets of genes serve as further research targets,
and more accurate maps of real biological processes are to be
recovered.
Based on time-series data, modern spectral density esti-
mation methods have been exploited to identify periodically
expressed genes. Assuming the cell cycle signal to be a single
sinusoid, Spellman et al. [13] and Whitfield et al. [14]
performed a Fourier transformation on the data sampled
with different synchronization methods, Wichert et al. [15]
applied the traditional periodogram and Fisher’s test, while
Ahdesm
¨
aki et al. [16] implemented a robust periodicity test
procedure assuming non-Gaussian noise. The majority of
these works dealt with evenly sampled data, and missing data
points were usually filled by interpolation in time domain, or
the genes were disregarded if there were too many vacancies.
The biological experiments generally output unequally
spaced measurements. The change of sampling frequency is
due to missing data and the fact that the measurements are
usually event driven, that is, more observations are taken
when certain biological events occur, and the measurement
process is slowed down when the cell remains quiet.
Therefore, an analysis based on unevenly sampled data is
practically desired and technically more challenging. The
harmonics exploited in discrete Fourier transform (DFT) are
no longer orthogonal in the presence of uneven sampling.
Lomb [17]andScargle[18] demonstrated that a phase shift
suffices to make the sine and cosine terms orthogonal again.
The Lomb-Scargle scheme has been exploited in analyzing
the budding yeast data set by Glynn et al. [19]. Stoica and
Sandgren [20] updated the traditional Capon method to
cope with the irregularly sampled data. Notice also that
Wang et al. [ 21] designed the missing-data amplitude and
phase estimation (MAPES) approach, which estimated the
missing data and spectrum iteratively through the usage of
the Expectation Maximization (EM) algorithm. Although
Capon and MAPES methods aim to achieve a better spectral
resolution than Lomb-Scargle periodogram, for small sam-
ple size, the simpler Lomb-Scargle periodogram appears to
possess higher accuracy in the presence of real biological data
sets [22].
This paper proposes a novel clustering preprocessing
procedure which combines the power spectral density anal-
ysis with clustering schemes. Given a set of microarray
measurements, the power spectral density of each gene is
first computed, then the spectral information is fed into
the clustering schemes. The members within the same
cluster will share similar spectral information, therefore
they are supposed to participate in the same temporally
regulated biological process. The assumptions underlying
this statement rely on the following facts: if two genes X
and Y are in the same cluster, their spectral densities are
very close to each other; in the time domain, their gene
expressions may just differ in their phases. The phases are
usually modeled to correspond to different stages of the
same biological processes, for example, cell cycle or circadian
rhythms. The proposed spectral-density-based clustering
actually differentiates the following two cases.
(1) Gene X’s expression and Gene Y’s expression are
uncorrelated in both time and frequency domains.
(2) Gene X and Y expressions are uncorrelated in time
domain, but gene X’s expression is a time-shifted
version of gene Y’s expression.
In the traditional clustering schemes, the distances are
the same for the above two cases (both assuming large
values). However, in the proposed algorithm, the second
case is favorable and presents a lower distance. Therefore, by
exploiting the proposed algorithm, the genes participating in
the same biological process are more likely to be grouped into
the same cluster. Lomb-Scargle periodogram serves as the
spectral density estimation tool since it is computationally
simple and possesses higher accuracy in the presence of
unevenly measured and small-size gene expression data sets.
The appropriate clustering method is determined based on
intense computer simulations. Three major clustering meth-
ods: hierarchical, K-means, and self-organizing map (SOM)
schemes are tested with different configurations. The spectra
and expression-based clusterings are compared with respect
to their ability of grouping cell-cycle genes that have been
experimentally verified. The differences between clusterings
are recorded and compared in terms of information theoretic
quantities.
2. Methods
This section explains how to apply the Lomb-Scargle
periodogram to time-series gene expressions. Next are
formulated briefly the three clustering schemes: hierarchical,
K-means, and self-organizing map (SOM). Afterward, we
discuss how to validate the clusterings and make compar-
isons between them. The notational convention is as follows:
the matrices and vectors are in bold face, and scalars are
represented in regular font.
2.1. Lomb-Scarg le Periodogram. Most spectral analysis meth-
ods, for example, Fourier transform and traditional peri-
odogram employed in Spellman et al. [13]andWichertetal.
[15], rely on evenly sampled data, which are projected
EURASIP Journal on Bioinformatics and Systems Biology 3
Table 1: Distance metric between two genes’ measurements x and y.
Distance Formula of d(x, y)Remarks
Euclidean (x − y)(x − y)
T
T is the matrix transpose.
City block
M
i=1
|x
i
− y
i
| M represents sample size, and i indexes a specific sample.
Cosine 1
−
xy
T
(xx
T
)
1/2
(yy
T
)
1/2
Correlation 1 −
(x − x)(y − y)
T
((x − x)(x − x)
T
)
1/2
((y − y)(y − y)
T
)
1/2
x, y are means of vectors x and y,respectively.
Table 2: Distance metric between two clusters C
i
and C
j
.
Distance Formula of d(C
i
, C
j
)Remarks
Single min d(x, y), x ∈ C
i
, y ∈ C
j
d(x, y) is defined in Table 1.
Complete max d(x, y), x
∈ C
i
, y ∈ C
j
Average
1
|C
i
|·|C
j
|
x∈C
i
y∈C
j
d(x, y) |·|obtains the size of the cluster.
on orthogonal sine and cosine harmonics. However, real
microarray measurements are not evenly observed due to
missing data points and changing sampling frequency. The
uneven sampling ruins data projection’s orthogonality. Lomb
[17] found that a phase shift of the sine and cosine functions
would restore the orthogonality among harmonics. Scar-
gle [18] complemented Lomb’s periodogram by exploiting
its distribution. Since then the established Lomb-Scargle
periodogram has been exploited in numerous fields and
applications, including bioinformatics and genomics (see,
e.g., Glynn et al. [19]).
Given M time-series observations (t
l
, x
l
), l = 0, , M −
1, where t stands for the time tag and x denotes the sampled
expression of a specific gene, the normalized Lomb-Scargle
periodogram for that gene expression at angular frequency ω
is defined as size
Φ
LS
(ω) =
1
2σ
2
M−1
l
=0
[x
l
− x]cos[ω(t
l
− τ)]
2
M−1
l=0
cos
2
[ω(t
l
− τ)]
+
M−1
l=0
[x
l
− x] sin[ω(t
l
− τ)]
2
M−1
l
=0
sin
2
[ω(t
l
− τ)]
,
(1)
where
x and σ
2
stand for the mean and variance of the
sampled data, respectively, and τ is defined as
τ
=
1
2ω
atan
M−1
l
=0
sin(2ωt
l
)
M−1
l=0
cos(2ωt
l
)
. (2)
Let δ be the greatest common divisor (gcd) for all intervals
t
k
−t
l
(k
/
= l), Eyer and Bartholdi [23] proved that the highest
frequencytobesearchedisgivenby
f
max
=
ω
max
2π
=
1
2δ
. (3)
The number of probing frequencies is denoted by
M =
t
M−1
− t
0
δ
,(4)
and the frequency grid can be defined in terms of the
following equation:
ω
l
δ =
2π
M
l, l
= 0, ,
M − 1. (5)
Notice further that the spectra at the front and rear halves
of the frequency grid are symmetric since the microarray
experiments output real values.
Lomb-Scargle periodogram represents an efficient solu-
tion in estimating the spectra of unevenly sampled data sets.
Simulation results also verify its superior performance for
biological data with small sample size and various unevenly
sampled patterns [22].
2.2. Clustering. The obtained Lomb-Scargle power spectral
density will be used as input to clustering schemes as an
alternative to the original gene expression measurements.
Three clustering schemes: Hierachical, K-means, and self-
organizing map (SOM) are used for testing this substitution.
2.2.1. Hierarchical Clustering. The hierarchical clustering
represents the partitioning procedure that assumes the form
of a tree, also known as the dendrogram. The bottom-up
algorithm starts in treating each gene as a cluster. Then at
each higher level, a new cluster is generated by joining the
two closest clusters at the lower level. In order to quantize
the distance between two gene profiles, different metrics have
been proposed in literature, as enumerated in Tabl e 1.
4 EURASIP Journal on Bioinformatics and Systems Biology
1: Input n genes with their expressions or spectral densities;
2: Initialize k
⇐ n, C
i
⇐{x
i
};
3: while k>1 do
4:
{i, j}=min
i,j
d(C
i
, C
j
);
5: Insert C
i
∪ C
j
,deleteC
i
and C
j
;
6: Label all existing clusters with integers 1, 2, ,(k
− 1);
7: k
⇐ k − 1
8: end while
Algorithm 1: Hierarchical clustering algorithm.
1: Input gene expressions or spectral densities, and the desired number of clusters K;
2: Randomly create centroids µ
1
, , µ
K
;
3: Assign each gene x to the cluster i
= arg min
j=1···K
d(µ
j
, x);
4: while members in some clusters change do
5: compute centroids µ
1
, , µ
K
;
6: assign gene x to cluster i
= arg min
j
d(x, µ
j
);
7: end while
Algorithm 2: K-means clustering algorithm.
The correlation is the most popular metric and was
exploitedinEisen’swork[2]. Based on distances between
gene expressions, we can further define the distances between
two gene clusters, that is, linkage methods, as illustrated by
Ta ble 2 .
The single linkage method actually constructs a minimal
spanning tree, and it sometimes builds an undesirable
long chain. The complete linkage method discourages the
chaining effect and in each step increases the cluster diameter
as little as possible. However, it assumes that the true clusters
are compact. Alternatively, the average linkage method
makes a compromise and is usually the preferred method
since it poses no assumption on the structure of clusters. The
selection of distance metric and linkage method depends on
the nature of the real data, and several clustering schemes
were proposed to be tested at the same time so that each
can capture different aspects of the data. The hierarchical
clustering scheme can be formulated in terms of the pseudo
code depicted in Algorithm 1. If a specific number of clusters
c are desired, only line 3 is needed to be changed by
substituting k>cfor k>1.
2.2.2. K-means Cluste ring. The K-means clustering divides
the genes into K predetermined clusters. It iteratively updates
the centroid of each cluster and reassigns each gene to the
cluster with the nearest centroid. Different distance metrics,
as listed in Ta bl e 1, can also be exploited in the K-means
clustering scheme. In each iteration, the new centroid might
be the median or mean of the cluster members. The K-
means clustering can be formulated as Algorithm 2.One
of the problems associated with K-means clustering is that
the iterations may finally converge to a local suboptimum
solution. Therefore, in our simulation we ran the algorithm
5 times and reported the one with the best performance. The
K-means clustering method was exploited by Tavazoie et al.
[4], which combined the clustering with the motif finding
problem.
2.2.3. Self-Organizing Map (SOM) Clustering. The self-
organizing map method is in essence based on a one-layer
neural network, and it is exploited in [3]. Each cluster
centroid maps to a node in the two-dimensional lattice.
It iteratively updates the centroid of each cluster through
competitive learning. At iteration t, a randomly selected
gene’s expression vector x is fed to the learning system, and
the centroid which is closest to the coming gene’s expression
vector is represented in terms of µ
i
. Then each centroid is
updated via
µ
t+1
j
= µ
t
j
+ g(d(i, j),t)
x − µ
t
j
, j = 1, ,K,(6)
where the function d(i, j) defines the distance between two
nodes indexed by i and j in the two-dimensional lattice. It
can be set to 1 if node j is within the neighborhood of node i,
and 0 otherwise. The function g(
·, ·) represents the learning
rate function, and it is monotonically decreasing with the
increase of t or d(i, j). The SOM clustering algorithm can be
formulated as Algorithm 3.
2.3. Performance Evaluation Metric. The three clustering
schemes with inputs of either gene expressions or spectral
densities are to be evaluated in two different ways: how
they group time-regulated genes, and whether they are
significantly different from each other. Different criteria are
defined based on information theoretic quantities.
2.3.1. Validation of Clustering Scheme. Given N genes
with their expression or spectral density information
EURASIP Journal on Bioinformatics and Systems Biology 5
1: Input gene expressions or spectral densities, the desired number of clusters K, and the number of max iterations T;
2: Randomly create centroids µ
1
, , µ
K
;
3: Assign each gene x to the cluster i
= arg min
j=1···K
d(µ
j
, x);
4: for t
= 1toT do
5: Randomly select a gene expresssion x;
6: Find the point i
= arg min
j=1···K
d(µ
j
, x);
7: Update centroids µ
1
, , µ
K
based on (6);
8: end for
9: Assign each gene x to cluster i
= arg min
j=1···K
d(x, µ
j
);
Algorithm 3: SOM clustering algorithm.
{x
1
, x
2
, ,x
N
}=Ω, suppose the clustering scheme
creates a partition of genes containing K clusters C
=
{
C
1
, C
2
, ,C
K
}, any two clusters C
i
and C
j
are mutually
exclusive (C
i
∩ C
j
= φ), and all clusters constitute the
measured gene expressions (
∪
K
i
=1
C
i
= Ω), then the entropy
of the clustering can be exploited to measure the information
of the clustering
H(C)
=−
K
i=1
|C
i
|
N
log
|C
i
|
N
,(7)
where
|·|measures the size of a cluster. Genes cooperate
by participating in the same biological processes, in other
words, singleton clusters are not expected to occur frequently
in the clustering. Therefore, for a given K, the sizes of
clusters should be balanced, and the higher the entropy of
the clustering, the better the clustering scheme.
The clustering schemes can be validated by their ability
to group genes that have been annotated to share similar
biological functions or participate in the same biological
process. One of the most explored processes is the yeast
cell cycle, for which genes have been mostly identified and
their interactions have been proposed in the public database
[24]. Assume a set of genes, denoted as G,hasbeenverified
to participate in a specific process, the joint entropy of the
clustering and the known set can be represented by
H(C, G)
=−
K
i=1
|C
i
∩ G|
N
log
|C
i
∩ G|
N
. (8)
It is desirable that genes with the same functions be inte-
grated in as small number of clusters as possible. Therefore,
the smaller the joint entropy, the better the clustering.
A straightforward performance metric combining both
the clustering entropy and the joint entropy is defined as the
mutual information
I(C, G)
= H(C)+H(G) − H(C, G), (9)
where the H(G) is defined similarly as in (7), and it is
constant across different clustering schemes. This metric
is actually consistent with that proposed in Gibbons and
Roth [25], whereby multiple gene attributes were considered.
Higher mutual information between the clustering C and
the prespecified set G stands for a balanced clustering for all
genes while genes of G are more accumulated, in other words,
it exhibits better performance.
2.3.2. Difference between Two Clusterings. Two clustering
schemes create two different partitions of all the observed
genes. A measure of the distance between two clusterings
is highly valuable when the two schemes do not show a
significant difference in their performance. Various metrics
have been proposed to evaluate the difference between two
clusterings, for example, Fowlkes and Mallows [26], Rand
[27], and more recently Meil
˘
a[28]. We accept Meil
˘
a’s
variation of information (VI) metric because it is more
discriminative, makes no assumption on the clustering
structure, requires no rescaling, neither does it depend on
the sample size.
Assume two different schemes produce two clusterings
C
={C
1
, ,C
K
} and C
={C
1
, ,C
K
}, respectively, then
the mutual information between these two clusterings is
represented by
I(C, C
) =
K
i=1
K
j=1
|C
i
∩ C
j
|
N
· log
N
·|C
i
∩ C
j
|
|C
i
|·|C
j
|
. (10)
Then, the variation of information (VI) is defined as
VI(C, C
) = H(C)+H(C
) − 2I(C, C
). (11)
VI is upper bounded by 2log K. It is zero if and only if the
two clusterings are exactly the same. The greater the variation
of information, the larger the difference between the two
clusterings.
3. Results
The performance of the proposed power spectrum-based
scheme is illustrated through comparisons with three tradi-
tional expression-based clustering schemes: Hierarchical, K-
means, and self-organizing map (SOM). The comparisons
are divided into two parts. In the first part, we evaluate
their ability to group the cell-cycle involved genes, while the
second part is devoted to illustrate the fact that the proposed
schemes construct clusters that are significantly different
from those created by the traditional schemes.
3.1. Clustering Pe rformance Evaluation. These simulations
were performed on the cdc15 data set published by Spellman
et al. [13], which contained 24 time-series expression mea-
surements of 6178 yeast genes. The hierarchical, K-means,
6 EURASIP Journal on Bioinformatics and Systems Biology
200150100500
Number of clusters
Expression, euclidean
Spectral, euclidean
Expression, city block
Spectral, city block
Expression, cosine
Spectral, cosine
Expression, correlation
Spectral, correlation
0
1
2
3
4
5
6
7
8
9
10
Mutual information (bits)
(a)
200150100500
Number of clusters
Expression, euclidean
Spectral, euclidean
Expression, city block
Spectral, city block
Expression, cosine
Spectral, cosine
Expression, correlation
Spectral, correlation
0
2
4
6
8
10
12
14
16
18
20
Mutual information (bits)
(b)
200150100500
Number of clusters
Expression, euclidean
Spectral, euclidean
Expression, city block
Spectral, city block
Expression, cosine
Spectral, cosine
Expression, correlation
Spectral, correlation
0
2
4
6
8
10
12
14
16
18
20
Mutual information (bits)
(c)
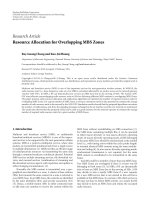
Figure 1: Performance of hierarchical clustering: (a) single linkage, (b) complete linkage, and (c) average linkage. The solid curves represent
the clusterings based on original gene expressions while the dotted curves stand for clusterings based on spectral densities.
and self-organizing map (SOM) clustering schemes were
simulated having as inputs the computed spectral densities
and the original expression data. The hierarchical and K-
means clustering were configured with different distance
and linkage methods, which are defined in Tables 1 and 2,
respectively. The simulations were executed until up to 200
clusters were created.
Cell cycle has served as a research target in molecular
biology for a long time since it plays a crucial rule in
cell division, and medically it underlies the development
EURASIP Journal on Bioinformatics and Systems Biology 7
200150100500
Number of clusters
Expression, euclidean
Spectral, euclidean
Expression, city block
Spectral, city block
Expression, cosine
Spectral, cosine
Expression, correlation
Spectral, correlation
0
2
4
6
8
10
12
14
16
18
20
Mutual information (bits)
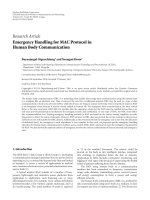
Figure 2: Performance of K-means clustering. The solid curves
represent the clusterings based on original gene expressions while
the dotted curves stand for clusterings based on spectral densities.
of cancer. Experimentally 109 genes have been verified to
participate in the cell-cycle process, and their interactions
were recorded in the public database KEGG [24]. Among
them 104 genes were reported in Spellman’s data set. The
simulations tested how these genes were clustered with other
genes. Intuitively, the more integrated are these 104 genes,
the better is the clustering scheme. On the other hand, it
is hoped that the size of the cluster is relatively balanced,
and there should not be many singleton clusters (clusters
containing only one gene).
The clustering performance is represented by an infor-
mation theoretic quantity, that is, mutual information,
which is defined between the obtained partition of all
measured genes and the set of 104 genes. Higher mutual
information indicates that the 104 cell-cycle genes are closely
integrated into only a few clusters, and most clusters are
balanced in size. In other words, with the same number of
clusters, the higher the mutual information, the better the
performance.
The proposed strategy is surely not constrained to detect
cell cycle genes. However we have to confine our discussion
to cell cycle here because the available data set is right for
the purpose of cell cycle research. Besides, the cell cycle genes
have been identified for a relatively long time with high
confidence.
The simulation results for hierarchical clustering are
illustrated in Figure 1. Each subplot is associated with a
linkage method. Figure 1(a) demonstrates the performance
for the single linkage method. The dotted curves represent
200150100500
Number of clusters
Expression, hierarchical, correlation, complete
Spectral, hierarchical, euclidean, complete
Expression, kmeans correlation
Spectral, kmeans euclidean
Expression, som
Spectral, som
0
2
4
6
8
10
12
14
16
18
20
Mutual information (bits)
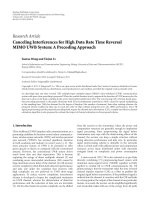
Figure 3: Performance of hierarchical, K-means, and SOM. The
comparison is performed across the complete linkage of hierarchi-
cal, K-means, and SOM. The solid curves represent the clustering
based on original gene expression data while the dotted curves stand
for clustering based on spectral data.
schemes clustering spectral densities while the solid curves
denote schemes clustering original gene expressions. The
mutual information goes up nearly linearly when the
number of clusters increases. Actually, when we delved
into the generated clusters, it was found that most clus-
ters were singletons. The chaining effect took place, and
the single linkage method is not a good candidate for
the purpose of clustering gene expression measurements.
Spectral density-based methods were all better than their
traditional counterparts, which performed clustering on the
original gene expression data. Among all, the Euclidean
method clustering spectral densities achieved the best per-
formance.
Figure 1(b) shows the results for the complete linkage
method of the hierarchical clustering. Each cluster actually
represents a complete subgraph. The complete linkage
method discourages the chaining effect to occur in the single
linkage method. The performance of spectral density-based
clusteringsislowerboundedbytheworstperformances
of the traditional gene expression-based clusterings. For
the gene expression-based clustering, the correlation and
cosine approaches are better than the Euclidean and city-
block approaches, while for the spectral density clustering,
the Euclidean and city-block approaches exhibit the best
performance.
8 EURASIP Journal on Bioinformatics and Systems Biology
200150100500
Number of clusters
Hier exp euc versus hier exp cor
Hier psd euc versus hier psd cor
Hier exp cor versus kmeans exp cor
Hier psd euc versus kmeans psd euc
Hier exp cor versus som exp
Hier psd euc versus som psd
Kmeans exp cor versus som exp
Kmeans psd euc versus som psd
0
1
2
3
4
5
6
7
8
9
10
Variation of information (bits)
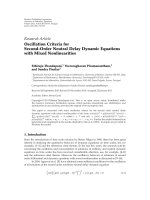
Figure 4: Distance between the two clusterings created by different
methods with the same input. Only the complete linkage for the
hierarchical clustering is considered. The solid curves represent
the clustering based on original gene expression data while the
dotted curves stand for clustering based on spectral densities.
Abbreviations are exploited for the conciseness of labels as follows:
hier (hierarchical clustering), euc (Euclidean), cor (correlation), psd
(power spectral density), exp (expression data).
Figure 1(c) plots the results for the average linkage
method of the hierarchical clustering. The average linkage
is the most widely deployed method since it makes a
compromise between the single and the complete methods,
and it does not assume any structure on the underlying data.
However, in the presence of real gene expression data, it
is not as good as the complete linkage method. Different
distance metrics differ in terms of their ability to group
the involved cell-cycle genes. For clustering expression data,
the cosine and correlation approaches still achieve the best
performance, but they exhibit poorer performance than the
spectra-based Euclidean and city-block methods.
Configured also with various distance metrics, the K-
means algorithm was applied on both the spectral and
original gene expression data. To avoid converging to local
suboptimal solutions, all K-means clustering schemes were
executed 5 times, and the best performance was reported.
For clustering expression data, the correlation and cosine
approaches are still the best choices while for spectra-based
schemes, the Euclidean and city-block approaches still exceed
the other schemes (see Figure 2).
200150100500
Number of clusters
Hier exp euc versus hier psd euc
Hier exp cor versus hier psd cor
Kmeans exp euc versus kmeans psd euc
Kmeans exp cor versus kmeans psd cor
Som exp versus som psd
Hier exp cor versus som exp
0
1
2
3
4
5
6
7
8
9
10
Variation of information (bits)
Figure 5: Distance between two clusterings created by the same
method assuming different inputs. The comparison is performed
across the complete linkage of hierarchical, K-means, and SOM.
The dashed curve is provided with the purpose of reference.
Abbreviations are exploited for the conciseness of labels as follows:
hier (hierarchical clustering), euc (Euclidean), cor (correlation), psd
(power spectral density), exp (expression data).
Figure 3 compares the performance of hierarchical and
K-means clustering schemes with that of SOM. The best
schemes of hierarchical and K-means were displayed. It
turns out that SOM is the best performing scheme, K-
means locates in the middle, whereas the hierarchical
clustering is the worst, although the discrepancy looks
not significant. Among all schemes, the spectral density-
based SOM achieves the best performance. Although the
discrepancy between the best spectral-based clustering and
the best gene expression-based clustering is not obvious,
they actually create significantly different clusters. This
difference can be captured by the distance metric between
clusterings.
The inferior performance of correlation and cosine
metrics with spectra input is partially due to the flat spectra
for those genes with no time-regulated patterns. The flat
spectrum in the denominator will cause the distance metrics
to be highly biased. It is also worthwhile to note that
in literature other distance metrics have been proposed,
for example, coherence [29] and mutual information [30].
However, these metrics involve the estimation of joint
distribution, which usually requires large sample sizes. Such a
requirement cannot be satisfied in general by the microarray
experiments. Extra normalization of the spectrum can be
EURASIP Journal on Bioinformatics and Systems Biology 9
performed, but simulation shows that it does not provide a
significant or consistent improvement.
3.2. Distance between Clusterings. A testing of the distance
between spectra-based and gene expression-based cluster-
ings also reveals the value of the proposed scheme. The
variation of information metric approach, proposed by Meil
˘
a
[28], is exploited to measure the difference between the two
clusterings. The basic principle resumes to: the higher the
variation of information, the greater the difference.
Figure 4 demonstrates the distance between the two
clusterings with the same input, either computed using
spectral densities or measured based on gene expressions. For
the hierarchical clustering, only the complete linkage method
is considered since it possesses the best performance in terms
of grouping the known cell-cycle genes. The complete set of
distances between any two schemes is depicted in the addi-
tional File 1 [31]. Figure 4 conserves only the salient general
patterns for conciseness. For hierarchical clustering of gene
expression data, the correlation and Euclidean schemes differ
more, and the distance between these two is the highest
curve when the number of clusters is greater than 120. The
distance between the correlation and Euclidean hierarchical
clusterings is even much larger than the distance between
the clusterings created by the hierarchical scheme and K-
means or SOM. However, when clustering spectral densities,
all schemes display quite similar patterns and exhibit closely
located performances. This means that clustering spectral
densities is stable across different clustering schemes.
Figure 5 compares the same clustering methods assum-
ing different inputs. Comparing with the scale of Figure 4,
the distance between different clusterings with the same
input is much smaller than the distance between clusterings
that assume different input types. The distance between any
two schemes that assume the same input is below 7 bits when
the number of clusters is ranging from 0 to 200, as shown in
Figure 4 or the dashed curve in Figure 5, while the distance
between the clusterings created by the same scheme assuming
two different input types is above 8 bits when the number of
clusters is ranging from 100 to 200. This shows that changing
the input type from gene expression to spectral density has
produced a significant different clustering scheme. For the
complete plots of the distance between clusterings produced
by various schemes assuming different input types, please
refer to the additional File 2 [31].
4. Conclusion
A novel clustering preprocessing strategy is proposed to
combine the traditional clustering schemes with power
spectral analysis of time-series gene expression measure-
ments. The simulation results corroborate that the proposed
approach achieves a better clustering for hierarchical, K-
means, and self-organizing map (SOM) in most cases.
Besides, it constructs a significantly different partition
relative to traditional clustering strategies. When deploying
the hierarchical or K-means clustering methods based on
the spectral density, the Euclidean and city-block distance
metrics appear to be more appealing than the cosine or
correlation distance metrics. The proposed novel algorithm
is valuable since it provides additional information about
temporal regulated genetic processes, for example, cell cycle.
Acknowledgments
This work was supported by the National Cancer Institute
(CA-90301) and the National Science Foundation (ECS-
0355227 and CCF-0514644).
References
[1] I. Simon, Z. Siegfried, J. Ernst, and Z. Bar-Joseph, “Combined
static and dynamic analysis for determining the quality of
time-series expression profiles,” Nature Biotechnology, vol. 23,
no. 12, pp. 1503–1508, 2005.
[2] M. B. Eisen, P. T. Spellman, P. O. Brown, and D. Botstein,
“Cluster analysis and display of genome-wide expression
patterns,” Proceedings of the National Academy of Sciences of
the United States of America, vol. 95, no. 25, pp. 14863–14868,
1998.
[3] P. Tamayo, D. Slonim, J. Mesirov, et al., “Interpreting patterns
of gene expression with self-organizing maps: methods and
application to hematopoietic differentiation,” Proceedings of
the National Academy of Sciences of the United States of
America, vol. 96, no. 6, pp. 2907–2912, 1999.
[4] S. Tavazoie, J. D. Hughes, M. J. Campbell, R. J. Cho, and
G. M. Church, “Systematic determination of genetic network
architecture,” Nature Genetics, vol. 22, no. 3, pp. 281–285,
1999.
[5] X. Zhou, X. Wang, E. R. Dougherty, D. Russ, and E. Suh, “Gene
clustering based on clusterwide mutual information,” Journal
of Computational Biology, vol. 11, no. 1, pp. 147–161, 2004.
[6] C. D. Giurc
˘
aneanu, I. T
˘
abus¸, J. Astola, J. Ollila, and M.
Vihinen, “Fast iterative gene clustering based on information
theoretic criteria for selecting the cluster structure,” Journal of
Computational Biology, vol. 11, no. 4, pp. 660–682, 2004.
[7] P. D’Haeseleer, “How does gene expression clustering work?”
Nature Biotechnology, vol. 23, no. 12, pp. 1499–1501, 2005.
[8] M. F. Ramoni, P. Sebastiani, and I. S. Kohane, “Cluster analysis
of gene expression dynamics,” Proceedings of the National
Academy of Sciences of the United States of America, vol. 99, no.
14, pp. 9121–9126, 2002.
[9] I. Tabus and J. Astola, “Clustering the non-uniformly sampled
time series of gene expression data,” in Proceedings of the
International Symposium on Signal Processing and Applications
(ISSPA ’03), vol. 2, pp. 61–64, Paris, France, July 2003.
[10] J. Ernst, G. J. Nau, and Z. Bar-Joseph, “Clustering short
time series gene expression data,” Bioinformatics, vol. 21,
supplement 1, pp. i159–i168, 2005.
[11] W. Zhao, E. Serpedin, and E. R. Dougherty, “Inferring gene
regulatory networks from time series data using the minimum
description length principle,” Bioinformatics, vol. 22, no. 17,
pp. 2129–2135, 2006.
[12] S. Liang, S. Fuhrman, and R. Somogyi, “Reveal, a general
reverse engineering algorithm for inference of genetic network
architectures,” in Proceedings of the Pacific Symposium on
Biocomputing, vol. 3, pp. 18–29, Maui, Hawaii, USA, January
1998.
[13] P. T. Spellman, G. Sherlock, M. Q. Zhang, et al., “Com-
prehensive identification of cell cycle-regulated genes of the
10 EURASIP Journal on Bioinformatics and Systems Biology
yeast Saccharomyces cerevisiae by microarray hybridization,”
Molecular Biology of the Cell, vol. 9, no. 12, pp. 3273–3297,
1998.
[14] M. L. Whitfield, G. Sherlock, A. J. Saldanha, et al., “Identifi-
cation of genes periodically expressed in the human cell cycle
and their expression in tumors,” Molecular Biology of the Cell,
vol. 13, no. 6, pp. 1977–2000, 2002.
[15] S. Wichert, K. Fonkianos, and K. Strimmer, “Identifying
periodically expressed trascripts in microarry time series
data,” Bioinformatics, vol. 20, no. 1, pp. 5–20, 2004.
[16] M. Ahdesm
¨
aki, H. L
¨
ahdesm
¨
aki, R. Pearson, H. Huttunen,
and O. Yli-Harja, “Robust detection of periodic time series
measured from biological systems,” BMC Bioinfor m atics, vol.
6, article 117, pp. 1–18, 2005.
[17] N. R. Lomb, “Least-squares frequency analysis of unequally
spaced data,” Astrophysics and Space Science,vol.39,no.2,pp.
447–462, 1976.
[18] J. D. Scargle, “Studies in astronomical time series analysis—II.
Statistical aspects of spectral analysis of unevenly spaced data,”
The Astrophysics Journal, vol. 263, no. 99, pp. 835–853, 1982.
[19] E. F. Glynn, J. Chen, and A. R. Mushegian, “Detecting periodic
patterns in unevenly spaced gene expression time series using
Lomb-Scargle periodograms,” Bioinfor matics,vol.22,no.3,
pp. 310–316, 2006.
[20] P. Stoica and N. Sandgren, “Spectral analysis of irregularly-
sampled data: paralleling the regularly-sampled data
approaches,” DigitalSignalProcessing,vol.16,no.6,pp.
712–734, 2006.
[21] Y. Wang, P. Stoica, J. Li, and T. L. Marzetta, “Nonparametric
spectral analysis with missing data via the EM algorithm,”
DigitalSignalProcessing, vol. 15, no. 2, pp. 191–206, 2005.
[22] W. Zhao, K. Agyepong, E. Serpedin, and E. R. Dougherty,
“Detecting periodic genes from irregularly sampled gene
expressions: a comparison study,” EURASIP Journal on Bioin-
formatics and Systems Biology, vol. 2008, Article ID 769293, 8
pages, 2008.
[23] L. Eyer and P. Bartholdi, “Variable stars: which Nyquist
frequency?” Astronomy and Astrophysics, vol. 135, no. 1, pp.
1–3, 1999.
[24] “KEGG Yeast Cell Cycle Pathway,” ome
.ad.jp/kegg/pathway/sce/sce04111.html.
[25] F. D. Gibbons and F. P. Roth, “Judging the quality of gene
expression-based clustering methods using gene annotation,”
Genome Research, vol. 12, no. 10, pp. 1574–1581, 2002.
[26] E. Fowlkes and C. Mallows, “A method for comparing two
hierarchical clusterings,” Journal of the American Statistical
Association, vol. 78, no. 383, pp. 553–569, 1983.
[27] W. M. Rand, “Objective criteria for the evaluation of clustering
methods,” Journal of the American Statistical Assoc iation, vol.
66, no. 336, pp. 846–850, 1971.
[28] M. Meil
˘
a, “Comparing clusterings—an information based
distance,” Journal of Multivariate Analysis,vol.98,no.5,pp.
873–895, 2007.
[29] A. J. Butte, L. Bao, B. Y. Reis, T. W. Watkins, and I. S.
Kohane, “Comparing the similarity of time-series gene expres-
sion using signal processing metrics,” Journal of Biomedical
Informatics, vol. 34, no. 6, pp. 396–405, 2001.
[30] D. R. Brillinger, “Second-order moments and mutual infor-
mation in the analysis of time series,” in Recent Advances in
Statistical Methods, pp. 64–76, Imperial College Press, London,
UK, 2002.
[31] “Supplementary Materials,” />∼wtzhao/EurasipBSBClutering.htm.