Báo cáo hóa học: " Research Article A Hybrid Technique for the Periodicity Characterization of Genomic Sequence Data" ppt
Bạn đang xem bản rút gọn của tài liệu. Xem và tải ngay bản đầy đủ của tài liệu tại đây (845.96 KB, 8 trang )
Hindawi Publishing Corporation
EURASIP Journal on Bioinformatics and Systems Biology
Volume 2009, Article ID 924601, 8 pages
doi:10.1155/2009/924601
Research Article
A Hybrid Technique for the Periodicity Characterization of
Genomic Sequence Data
Julien Epps
1, 2
1
School of Electrical Engineering and Telecommunications, The University of New South Wales, Sydney NSW 2052, Australia
2
National Information Communication Technology Australia (NICTA), Australian Technology Park, Eveleigh 1430, Australia
Correspondence should be addressed to Julien Epps,
Received 29 May 2008; Revised 13 October 2008; Accepted 21 January 2009
Recommended by Ulisses Braga-Neto
Many studies of biological sequence data have examined sequence structure in terms of periodicity, and various methods for
measuring periodicity have been suggested for this purpose. This paper compares two such methods, autocorrelation and the
Fourier transform, using synthetic periodic sequences, and explains the differences in periodicity estimates produced by each. A
hybrid autocorrelation—integer period discrete Fourier transform is proposed that combines the advantages of both techniques.
Collectively, this representation and a recently proposed variant on the discrete Fourier transform offer alternatives to the widely
used autocorrelation for the periodicity characterization of sequence data. Finally, these methods are compared for various
tetramers of interest in C. elegans chromosome I.
Copyright © 2009 Julien Epps. This is an open access article distributed under the Creative Commons Attribution License, which
permits unrestricted use, distribution, and reproduction in any medium, provided the original work is properly cited.
1. Introduction
The detection of structure within the DNA sequence has long
captivated the interest of the research community. Among
the various statistical characterizations of sequence data,
one measure of structure within sequences is the degree
of correlation or periodicity at various displacements along
the sequence. Periodicity characterization of sequence data
provides a compact and informative representation that has
been used in many studies of structure within genomic
sequences, including DNA sequence analysis [1], gene and
exon detection [2], tandem repeat detection [3], and DNA
sequence search and retrieval [4].
To measure such periodicity, autocorrelation has been
widely employed [1, 5–11]. Similarly, Fourier analysis and
its variants have been used for periodicity characterization
of sequences [4, 9, 12–24]. In some cases [25, 26], the
Fourier transform of the autocorrelation sequence has also
been computed, however using existing symbolic-numeric
mappings such as binary indicator sequences [27], this
transform can also be calculated without first determining
the autocorrelation. Other recent promising approaches to
periodicity characterization for biological sequences include
the periodicity transform [28], the exactly periodic subspace
decomposition [3], and maximum-likelihood statistical peri-
odicity [29], however these techniques have yet to be
adopted by biologists for the purposes of sequence structure
characterization.
Studies of structure within sequences, such as those ref-
erenced above, have tended to use either the autocorrelation
or the Fourier transform, and to the author’s knowledge,
the limitations of each have not been compared in this
context. In this paper, the limitations of both approaches are
investigated using synthetic symbolic sequences, and caveats
to their characterization of sequence data are discussed. A
hybrid approach to periodicity characterization of symbolic
sequence data is introduced, and its use is illustrated in a
comparative manner on a study of tetramers in C. elegans.
2. Periodicity Measures for Symbolic
Sequence Characterizati on
2.1. Definition of Periodic ity. Perhaps the most common
definition of exact periodicity in a general sequence s[n]is
s[n + p]
= s[n] ∀n ∈ Z,(1)
2 EURASIP Journal on Bioinformatics and Systems Biology
for some p
∈ Z
+
. Assuming s[n]canberepresented
numerically as x[n], this definition admits the following
decomposition:
x[n]
=
∞
k=−∞
x
p
[k]δ
p
[k − n], (2)
where
x
p
[n] =
⎧
⎨
⎩
x[n]0≤ n<p,
0 elsewhere,
(3)
is the numerical representation of a repeated symbol or
pattern, and δ
p
[n] is a periodic binary impulse train:
δ
p
[n] = δ[n − kp] ∀k ∈ Z. (4)
While this expression of x[n] in terms of a binary impulse
train is perhaps not so common in signal processing of
numericalsequences,thereverseistrueforDNAsequences,
which have been represented numerically using binary
indicator sequences [27] in many studies (e.g., [13, 19, 23,
24, 30]).
2.2. Autocorrelation. The autocorrelation of a finite length
numerical sequence x[n]isdefinedas
r
xx
[ρ] =
N−1
n=0
x[n]x[(n − ρ)modN], (5)
where n is the sequence index, ρ is the lag, and N is the length
of the sequence. The application of the autocorrelation as
defined in (5) to a symbolic sequence s[n]requiresanumeri-
cal representation x[n]. The binary indicator sequences [27],
which are sufficiently general as to form the basis for many
different representations of DNA sequences, are employed in
this analysis to represent s[n]intermsofM binary signals:
b
m
[n] =
⎧
⎨
⎩
1ifs[n] = S
m
, m = 1, 2, , M,
0 otherwise,
(6)
where M is the number of symbols (or patterns of
symbols, such as a polynucleotide) S
1
, , S
M
,towhich
the numerical values a
1
, , a
M
are assigned, respectively,
resulting in M components x
m
[n] = a
m
b
m
[n]. Assuming
a
1
/
= a
2
/
= ···
/
= a
M
, the numerical representation can thus
be unambiguously expressed as
x[n]
=
M
m=1
x
m
[n] =
M
m=1
a
m
b
m
[n]. (7)
Note that applying the decomposition in (2)toanexactly
periodic sequence results in x
p
[n] comprising a sequence
of the numerical values a
m
that correspond to the repeated
pattern of symbols.
Alternatively, the autocorrelation can be defined directly
on a symbolic sequence s[n], as used in [20]:
r
ss
[ρ] =
⎧
⎨
⎩
1ifs[n] = s[n − ρ]
0 otherwise,
(8)
so that the autocorrelation at a lag, or period, p
∈ Z
+
for
a symbol (or pattern of symbols) is simply the count of the
number of instances of that symbol at a spacing of ρ.
Consider now a sequence containing a symbol (or
pattern of symbols) S
m
that repeats with exactly period
p, so that the numerical representation of the sequence
has a component x
m
[n] = a
m
b
m
[n] = a
m
δ
p
[n]. The
autocorrelation of this component x
m
[n], for a segment of
finite length N, has the following expression:
r
x
m
x
m
[ρ] =
N−1
n=0
a
m
δ
p
[n]a
m
δ
p
[(n − ρ)modN]
= a
2
m
E
δ
p
δ
p
[ρ],
(9)
where E
δ
p
=N/p is the energy of δ
p
[n] over a segment of
finite length N. Thus a shortcoming of the autocorrelation
for sequence characterization is that an exactly p-periodic
sequence will show not only a peak at ρ
= p, but also peaks
at values of ρ that are integer multiples of p (an example is
given in Figure 1(a)). Note that similar artifacts can be found
in other periodicity detection methods (e.g., [29]).
2.3. Fourier Interpretation of Periodicity. In many applica-
tions, including sequence analysis, the discrete Fourier trans-
form has been used to determine the periodic component(s)
of a numerical sequence x[n]. The discrete Fourier transform
(DFT) of a numerical sequence x[n]isdefinedas
X[k]
=
N−1
n=0
x[n]exp
−
j
2πnk
N
, k = 0, 1, , N − 1,
(10)
where k is the discrete frequency index. Since the DFT has
sinusoidal basis functions, the notion of periodicity in the
Fourier sense is described in terms of the frequencies of those
basis functions onto which the projections of x[n] are the
largest in magnitude. That is, the magnitude of the DFT at
afrequencyk,
|X[k]|, is often taken as an estimate of the
relative amount of that frequency component occurring in
x[n][13, 19, 23, 24], from which the relative contribution of
a particular period p
= N/k can be estimated.
Assuming a numerical representation x[n] of the kind
shown in (7), the linearity property of the DFT means that
the DFT of a symbolic sequence s[n] can be determined as
X[k]
=
M
m=1
a
m
B
m
[k], (11)
where the B
m
[k] are determined according to (10).
For the purposes of characterizing sequence data using
periodicity, it can be noted that positive integer periods are
generally of most interest. This means firstly that N and k
need to be carefully chosen to allow fast Fourier transform-
based calculation of S[k]forperiodsρ
= 1, 2, , P,whereP
is the longest period to be estimated. Secondly, calculating
the DFT at other frequencies k
/
= N/ρ is unnecessary. For
EURASIP Journal on Bioinformatics and Systems Biology 3
these reasons, the integer period DFT (IPDFT) was proposed
as an alternative to the DFT [19]:
X[ρ]
=
N−1
n=0
x[n]exp
−
j
2πn
ρ
, ρ = 1, 2, , P ≤ N.
(12)
Using a similar process to that described above in (10)and
(11), the numerical representation of a symbolic sequence
x[n] can also be transformed using the IPDFT to produce
aspectrumX[ρ] that is linear in period (ρ) rather than
in frequency (k). For the periodicity characterization of
sequences, usually the magnitude
|X[ρ]| is of greatest
interest. Some care is needed in the interpretation of the
IPDFT, since for a binary periodic sequence such as δ
p
[n]
of fixed length N,
|X[ρ]| willdecreaseforlongerperiodsdue
to the fact that the energy of δ
p
[n]isN/p.
Consider now the effect of representing an exactly
periodic sequence component x
m
[n] using the IPDFT. From
(2) and the convolution theorem, X
m
[ρ] = X
m
p
[ρ]Δ
p
[ρ],
where Δ
p
[ρ] is the IPDFT of δ
p
[n]. In particular, if x
m
p
[n]
is assumed to be aperiodic, consider the IPDFT of δ
p
[n]:
Δ
p
[ρ] =
⎧
⎪
⎪
⎨
⎪
⎪
⎩
N−1
n=0
1 · exp
−
j2πn
ρ
n = kp, k ∈ Z
0 otherwise
=
(N−1)/p
k=0
exp
−
j2πkp
ρ
=
⎧
⎪
⎪
⎪
⎪
⎪
⎪
⎨
⎪
⎪
⎪
⎪
⎪
⎪
⎩
N − 1
p
ρ =
p
l
,forl
∈ Z
+
(N−1)/p
k=k
0
exp
−
j2πkp
ρ
otherwise,
(13)
where k
0
=(N − 1)/p/ρρ. That is, |Δ
p
[ρ]| is relatively
large for ρ
= p/l, and relatively small for ρ
/
= p/l.From
this, we see that a shortcoming of Fourier transform
approaches such as the IPDFT for sequence characterization
by periodicity is that they produce not only a peak at ρ
= p,
but also peaks at values of ρ that are integer divisors of the
period p (see example in Figure 1(b)). For the DFT, this effect
is also seen, but instead for indices whose value is k
= Nl/p ∈
{
0, 1, , N − 1} (i.e., harmonics of the frequency 2π/p with
integer frequency indices).
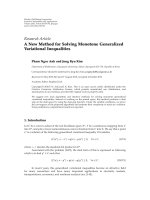
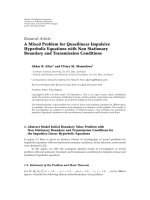
2.4. Periodic ity of a Synthetic Sequence Using Autocorrelation
and DFT. To illustrate the shortcomings of the autocorre-
lation and DFT discussed in Sections 2.2 and 2.3, consider
the periodicity characterization of an example signal x
E
[n] =
δ
p
[n] (i.e., exact monomer periodicity x
p
[n] = δ[n]), where
p
= 12 and N = 10000. The autocorrelation and IPDFT are
shown in Figures 1(a) and 1(b), respectively, from which the
ambiguities in period estimate discussed in Sections 2.2 and
2.3 can be clearly seen.
3530252015105
Period
0
200
400
600
800
Autocorrelation
(a)
3530252015105
Period
0
200
400
600
800
IPDFT
(b)
3530252015105
Period
0
200
400
600
800
Hybrid
(c)
Figure 1: Periodicity characterization of the period-12 synthetic
signal x
E
[n] using (a) autocorrelation, (b) integer period DFT, and
(c) hybrid autocorrelation-IPDFT.
3. Hybrid Autocorrelation-IPDFT
Periodicity Estimation
3.1. Hybrid Autocorrelation-IPDFT. From Figure 1,itis
apparent that the autocorrelation and IPDFT are comple-
mentary, and that their combination can improve peri-
odicity estimation. This is the motivation for the hybrid
autocorrelation-IPDFT period estimate:
H
x
[ρ] = r
xx
[ρ]|X[ρ]|. (14)
For the simple example signal x
E
[n]fromSection 2.4,
the calculation of H
x
[ρ] results in a single, unambiguous
periodicity estimate, as seen in Figure 1(c).
An alternative, more flexible formulation is
H
x
[ρ] =
r
xx
[ρ]
1−α
|X[ρ]|
α
, (15)
where α
∈ [0, 1], which may be helpful for biologists who
have conventionally used either the autocorrelation (α
=
0) or the Fourier transform (α = 1). For the purpose of
sequence periodicity visualization, for example, α could be
represented as a parameter available for real-time control, so
that a biologist viewing a periodicity characterization of a
sequence might subjectively assign a relative weight to each
of the autocorrelation and Fourier transform components.
Care is needed, however, with the application of (15), since
(r
xx
[ρ])
1−α
is only well defined for r
xx
[ρ] ≥ 0forallρ.Note
that this is satisfied by the autocorrelation defined in (8),
in addition to a number of DNA numerical representations
(several example representations are discussed in [30]).
It is further noted that (14)and(15) do not have a
straightforward physical interpretation, in contrast to r
xx
[ρ]
and
|X[ρ]|.
4 EURASIP Journal on Bioinformatics and Systems Biology
3530252015105
Period
0
500
1000
1500
Autocorrelation
(a)
3530252015105
Period
0
500
1000
IPDFT
(b)
3530252015105
Period
0
200
400
600
Hybrid
(c)
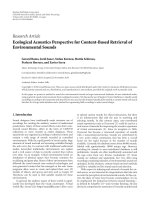
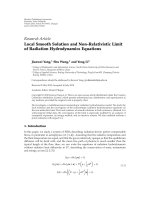
Figure 2: Periodicity characterization of a period-7, 10 and 12
synthetic signal using (a) autocorrelation, (b) integer period DFT,
and (c) hybrid autocorrelation-IPDFT.
Applying the hybrid autocorrelation-IPDFT period esti-
mate to another example, synthetic signal with multiple exact
periodic components (N
= 10000) further illustrates the
shortcomings of the autocorrelation and IPDFT, and suggests
the hybrid approach as suitable for periodicity analyses, as
seen in Figure 2.
3.2. Evaluation of Periodicity Estimation in Noise. In the
absence of an obvious objective evaluation metric for peri-
odicity characterization approaches, one limited approach is
to compare their accuracies for the problem of estimating
a single periodic component that has been obscured by
noise. Specifically, suppose a periodic binary impulse train
δ
p
[n] is degraded by random binary noise, simulating the
effect of the DNA substitution process, to produce a binary
pseudo-periodic signal x[n]. Then estimates of the signal
periodicity using each of the autocorrelation, integer period
DFT and hybrid autocorrelation-IPDFT can be calculated,
respectively, as
p
A
= arg max
ρ>1
r
xx
[ρ]
,
p
I
= arg max
ρ>1
(|X[ρ]|),
p
H
= arg max
ρ>1
H
x
[ρ]
,
(16)
where H
x
[ρ] is calculated using (14) throughout both this
section and Section 4.
A comparison of the periodicity estimates was conducted
by generating synthetic periodic signals of length N
= 10000,
introducing various amounts of substitution (noise) and
50454035302520151050
Percent substitution
0
50
100
Error rate (%)
(a)
50454035302520151050
Percent substitution
0
50
100
Error rate (%)
(b)
50454035302520151050
Percent substitution
0
50
100
Error rate (%)
(c)
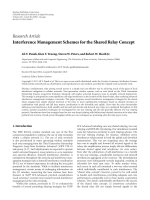
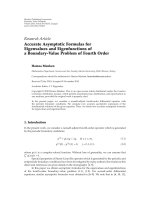
Figure 3: Error rate versus substitutions averaged over 100
instances of sequences of length 10000 with (a) p
= 7, (b) p = 23,
(c) p
= 24, for period estimates using autocorrelation ( ), integer
period DFT (- - -), and hybrid autocorrelation-IPDFT (—).
estimating p
A
, p
I
,andp
H
. This process was repeated 100
times for each combination of period and substitution rate
tested. The resulting average period error rates are shown
as a function of substitution rate for three example values
of period p in Figure 3 (p small, p larger and prime, and p
larger and highly composite), and as a function of the period
in Figure 4. These results confirm earlier observations that
the IPDFT provides more robust period estimates for prime
periods than the autocorrelation, while the reverse is true
for highly composite periods. The results also show that the
hybrid technique is often able to provide a lower period error
rate than either the autocorrelation or the IPDFT. Exceptions
to this occur for some prime periods (see Figure 4), where the
poorer performance of the autocorrelation seems to slightly
adversely affect the hybrid estimate p
H
relative to the IPDFT-
only estimate p
I
.
3.3. Evaluation of Multiple Periodic ity Estimation. For peri-
odicity characterization, a more relevant evaluation criterion
is the extent to which all periodicities present can be
detected correctly. Since an exhaustive evaluation is imprac-
tical, in this work, synthetic sequences comprising three
randomly chosen integer periodic components p
1
, p
2
, p
3
∈
{
2, 3, ,40 | p
1
/
= p
2
/
= p
3
} were constructed, and the fre-
quency with which all three periods were correctly detected
was measured. When multiple perfectly periodic compo-
nents are present in a binary signal, the shorter periods will
be favoured during estimation, as a result of their greater
occurrence in a fixed-length signal. Hence, when combining
EURASIP Journal on Bioinformatics and Systems Biology 5
403530252015105
Period (bp)
0
20
40
60
80
100
Error rate (%)
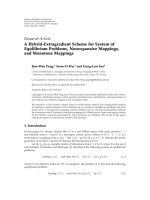
Figure 4: Error rate versus period averaged over 100 instances of
sequences of length 10000 with a substitution rate of 30%, for
period estimates using autocorrelation ( ), integer period DFT
(- - -), and hybrid autocorrelation-IPDFT (—).
20105210.5
Erosion γ%
0
5
10
15
20
25
30
35
40
45
50
55
All periods correct (%)
Figure 5: Percentage of sequence instances for which all three
periods were correctly estimated in order of strength versus
erosion γ, over 500 instances of sequences of length 10000 with
three randomly chosen integer periodic components, estimated
using autocorrelation ( ), integer period DFT (- - -), and hybrid
autocorrelation-IPDFT (—).
three periodic components, the shorter period components
were randomly eroded to give an equal occurrence between
all periods. In the general case of multiple periodicities,
some periodic components will be stronger than others.
To simulate this, the p
2
-periodic component was further
randomly eroded by γ% and the p
3
-periodic component was
further randomly eroded by 2γ%, that is, larger values of
γ correspond to a more dominant p
1
component. Erosions
of greater than about 20% were experimentally found to
degrade the accuracy of all three period estimates, using all
methods. Finally, the percentage of instances for which the
periods p
1
, p
2
,andp
3
were correctly estimated in correct
order of strength according to the 3-best period estimates,
calculated similarly to equations (16), was determined. The
results, shown in Figure 5, strongly support the validity of the
proposed hybrid autocorrelation-IPDFT technique relative
to the autocorrelation and IPDFT.
It is noted that the signal processing literature includes
examples of methods for detecting multiple periodic sig-
nal components, such as the MUSIC algorithm [31]. For
comparative purposes, the above experiment was repeated
403530252015105
Period
0
500
Autocorrelation
(a)
403530252015105
Period
0
500
IPDFT
(b)
403530252015105
Period
0
500
Hybrid
(c)
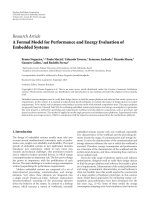
Figure 6: (a) Autocorrelation from [1], (b) integer period
DFT magnitude, and (c) hybrid autocorrelation-IPDFT of TATA
tetramers from C. elegans chromosome I.
employing MUSIC to estimate the strengths of the periodic
components. Results indicated that MUSIC was unable
to consistently estimate either the periods or the relative
strengths of the three components, returning no instances
of all three periods correct and in the correct order. The
dominant period estimate often contained the common
factors of two or more of the true periodic components,
an artifact attributable to the superposition of harmonic
spectra reinforcing multiples of the individual component
fundamentals that coincide in frequency. Two assumptions
of MUSIC are not valid for this application: (i) the periodic
components are not sinusoidal (although they can be rep-
resented as a harmonic series of sinusoids), (ii) the periodic
components and noise may not be uncorrelated.
4. Application to DNA Sequence Data
Having discussed the differences between the autocorrelation
and DFT for synthetic sequences, we now investigate the
effect of using the IPDFT and hybrid autocorrelation-
IPDFT in place of the autocorrelation on real sequence
data. Numerous researchers have used autocorrelation [1, 5–
10, 32]; here we compare with examples from the study
of tetramer periodicity in the C. elegans genome using
autocorrelation by Kumar et al. [1].
In the investigation of TATA tetramers, particular men-
tion was made of the strong period-2 component [1],
which features prominently in estimates by all three tech-
niques, as seen in Figure 2. In the autocorrelation estimate
(Figure 6(a)), the period-10 component appears to have been
virtually completely masked by the period-2 component.
6 EURASIP Journal on Bioinformatics and Systems Biology
403530252015105
Period
0
500
Autocorrelation
(a)
403530252015105
Period
0
100
200
IPDFT
(b)
403530252015105
Period
0
100
Hybrid
(c)
Figure 7: (a) Autocorrelation from [1], (b) integer period
DFT magnitude, and (c) hybrid autocorrelation-IPDFT of TGCC
tetramers from C. elegans chromosome I.
In contrast, the period-10 component features strongly in
the IPDFT (Figure 6(b)) and hybrid (Figure 6(c)) estimates.
Although this period-10 component was not mentioned in
the analysis of TATA tetramers specifically, it was found to be
characteristic of all other C. elegans tetramers analyzed in [1].
Note also that the IPDFT reveals a strong period-25
component, not at all evident in the autocorrelation. This
surprising result was verified by constructing a synthetic
sequence with perfect periodic components at p
= 2and
p
= 25, and examining its autocorrelation and IPDFT. The
autocorrelation of the sequence did not display visually any
significant peak at p
= 25 until the period-2 component
had been eroded by at least 80%. In contrast, the IPDFT
showed a clear peak at p
= 25 with no period-2 erosion
at all. The period-25 component has rarely been noted in
previous literature, however in [11], a filtered distribution
of distances between TA dinucleotides shows a strong peak
at p
= 25, which Salih et al. attribute to a 5-base periodicity
associated with the period-10 consensus sequence structure
for C. elegans.
In the investigation of TGCC tetramers (see Figure 7),
the periodic components at 8 and 35 bp were noted in
[1]. The proposed hybrid technique also produces peaks
at these periods (mainly due to the autocorrelation in
this instance), however it additionally finds period-12 and
period-39 components. Note that the IPDFT produces a
strong peak at a 6 bp period (presumably due to being an
integer divisor of 12), however in the hybrid result, this is
effectively suppressed by the autocorrelation.
In [1], mention is made of the period-10 and 11
behaviour of AGAA tetramers. As seen in Figure 8, the
403530252015105
Period
400
600
Autocorrelation
(a)
403530252015105
Period
0
200
400
IPDFT
(b)
403530252015105
Period
200
400
Hybrid
(c)
Figure 8: (a) Autocorrelation from [1], (b) integer period
DFT magnitude, and (c) hybrid autocorrelation-IPDFT of AGAA
tetramers from C. elegans chromosome I.
403530252015105
Period
2.2
2.4
2.6
2.8
×10
5
Autocorrelation
(a)
403530252015105
Period
0
2000
4000
IPDFT
(b)
403530252015105
Period
0
2
×10
4
Hybrid
(c)
Figure 9: (a) Autocorrelation from [1], (b) integer period DFT
magnitude, and (c) hybrid autocorrelation-IPDFT of WWWW
tetramers from C. elegans chromosome I.
autocorrelation finds a dominant peak at 9 bp, while the
hybrid technique is more convincing in revealing period-
10 behavior. Note that, as previously, the period-5 IPDFT
component (presumably due to the 10 bp periodicity) is
effectively attenuated in the hybrid result.
EURASIP Journal on Bioinformatics and Systems Biology 7
In the investigation of WWWW tetramers (where W
represents either A or T), the autocorrelation (Figure 9(a)),
as in [1], is dominated by the period-10 component. A
very similar characteristic is observed in the distribution of
distances between TT to TT dinucleotides in [11], and in
the distribution of AAAA to AAAA tetramer distances in
[33], suggesting a strong influence by these motifs. While
the dominance of the period-10 component is similar for
the IPDFT, it also detects a relatively strong period-25
component, perhaps due to TA dinucleotide periodicity,
as discussed above for TATA tetramers. In this example,
the hybrid autocorrelation-IPDFT result is biased towards
the IPDFT, as a result of the IPDFT having a larger
dynamic range than the autocorrelation. Here, the effect
is not detrimental, having the effect of suppressing the
spurious peaks at periods 20, 30, and 40, however in other
applications it may be desirable to offset the autocorrelation
and/or IPDFT to produce a minimum value of zero prior
to calculating the hybrid autocorrelation-IPDFT period
estimate.
5. Conclusion
This paper has made two contributions to the periodicity
characterization of sequence data. Firstly, the origins of
ambiguities in period estimates for symbolic sequences due
to multiples or sub multiples of the true period in the auto-
correlation and Fourier transform methods, respectively,
were explained. This is significant because these two methods
account for perhaps the majority of the periodicity analysis
seen in biology literature, and yet, to the author’s knowledge,
their limitations have not been discussed in this context.
Secondly, a hybrid autocorrelation-IPDFT technique for
periodicity characterization of sequences has been proposed.
This technique has been shown to provide improved accu-
racy relative to the autocorrelation and IPDFT for period
estimation in noise and multiple periodicity estimation,
for synthetic sequence data. Comparative results from a
preliminary investigation of tetramers in C. elegans chromo-
some I suggest that the proposed approach yields estimates
that are consistently less prone to attribute significance to
integer multiples or divisors of the true period(s). Thus, the
hybrid autocorrelation-IPDFT is putatively advanced as a
useful tool for biologists in their quest to reveal and explain
structure within biological sequences. Future work will
include studies of different types of periodicity in sequence
data from other organisms, using IPDFT-based and hybrid
techniques.
Acknowledgments
The author would like to thank two anonymous reviewers
for a number of helpful suggestions, which have certainly
improved the quality of this paper. Thanks are also due to
Professor Eliathamby Ambikairajah for helpful discussions.
This research was supported by a University of New South
Wales Faculty of Engineering Early Career Research Grant for
genomic signal processing, 2009.
References
[1] L. Kumar, M. Futschik, and H. Herzel, “DNA motifs and
sequence periodicities,” In Silico Biology,vol.6,no.1-2,pp.
71–78, 2006.
[2] E. N. Trifonov, “3-, 10.5-, 200- and 400-base periodicities in
genome sequences,” Physica A, vol. 249, no. 1–4, pp. 511–516,
1998.
[3] D. D. Muresan and T. W. Parks, “Orthogonal, exactly periodic
subspace decomposition,” IEEE Transactions on Signal Process-
ing, vol. 51, no. 9, pp. 2270–2279, 2003.
[4] E. Santo and N. Dimitrova, “Improvement of spectral analysis
as a genomic analysis tool,” in Proceedings of the 5th IEEE
International Workshop on Genomic Signal Processing and
Statistics (GENSIPS ’07), Tuusula, Finland, June 2007.
[5] P. Bernaola-Galv
´
an, P. Carpena, R. Rom
´
an-Rold
´
an, and J. L.
Oliver, “Study of statistical correlations in DNA sequences,”
Gene, vol. 300, no. 1-2, pp. 105–115, 2002.
[6] N. Chakravarthy, A. Spanias, L. D. Iasemidis, and K. Tsakalis,
“Autoregressive modeling and feature analysis of DNA
sequences,” EURASIP Journal on Applied Signal Processing, vol.
2004, no. 1, pp. 13–28, 2004.
[7] H.Herzel,E.N.Trifonov,O.Weiss,andI.Große,“Interpreting
correlations in biosequences,” Physica A, vol. 249, no. 1–4, pp.
449–459, 1998.
[8] W. Li, “The study of correlation structures of DNA sequences:
a critical review,” Computers and Chemistry, vol. 21, no. 4, pp.
257–271, 1997.
[9] A. D. McLachlan, “Multichannel Fourier analysis of patterns
in protein sequences,” The Journal of P hysical Chemistry, vol.
97, no. 12, pp. 3000–3006, 1993.
[10] C K. Peng, S. V. Buldyrev, A. L. Goldberger, et al., “Long-
range correlations in nucleotide sequences,” Nature, vol. 356,
no. 6365, pp. 168–170, 1992.
[11] F. Salih, B. Salih, and E. N. Trifonov, “Sequence structure of
hidden 10.4-base repeat in the nucleosomes of C. elegans,”
Journal of Biomolecular Structure and Dynamics, vol. 26, no.
3, pp. 273–281, 2008.
[12] V. Afreixo, P. J. S. G. Ferreira, and D. Santos, “Fourier analysis
of symbolic data: a brief review,” DigitalSignalProcessing, vol.
14, no. 6, pp. 523–530, 2004.
[13] D. Anastassiou, “Genomic signal processing,” IEEE Signal
Processing Magazine, vol. 18, no. 4, pp. 8–20, 2001.
[14]J.A.Berger,S.K.Mitra,andJ.Astola,“Powerspectrum
analysis for DNA sequences,” in Proceedings of the 7th Inter-
national Symposium on Signal Processing and Its Applications
(ISSPA ’03), vol. 2, pp. 29–32, Paris, France, July 2003.
[15] E. Coward, “Equivalence of two Fourier methods for biologi-
cal sequences,” Journal of Mathematical Biology, vol. 36, no. 1,
pp. 64–70, 1997.
[16] S. Datta and A. Asif, “A fast DFT based gene prediction
algorithm for identification of protein coding regions,” in
Proceedings of IEEE International Conference on Acoustics,
Speech and Signal Processing (ICASSP ’05) , vol. 5, pp. 653–656,
Philadelphia, Pa, USA, March 2005.
[17] G. Dodin, P. Vandergheynst, P. Levoir, C. Cordier, and L.
Marcourt, “Fourier and wavelet transform analysis, a tool for
visualizing regular patterns in DNA sequences,” Journal of
Theoretical Biology, vol. 206, no. 3, pp. 323–326, 2000.
[18] V. A . Emanuele II, T. T. Tran, a nd G. T. Zhou, “A fou rie r
product method for detecting approximate tandem repeats
in DNA,” in Proceedings of the 13th IEEE/SP Workshop
on Statistical Signal Processing (SSP ’05), pp. 1390–1395,
Bordeaux, France, July 2005.
8 EURASIP Journal on Bioinformatics and Systems Biology
[19] J. Epps, E. Ambikairajah, and M. Akhtar, “An integer period
DFT for biological sequence processing,” in Proceedings of the
6th IEEE International Workshop on Genomic Signal Processing
and Statistics (GENSIPS ’08), pp. 1–4, Phoenix, Ariz, USA,
June 2008.
[20] B. Issac, H. Singh, H. Kaur, and G. P. S. Raghava, “Locating
probable genes using Fourier transform approach,” Bioinfor-
matics, vol. 18, no. 1, pp. 196–197, 2002.
[21] V. Ju. Makeev and V. G. Tumanyan, “Search of periodicities
in primary structure of biopolymers: a general Fourier
approach,” Computer Applications in the Biosciences, vol. 12,
no. 1, pp. 49–54, 1996.
[22] B. D. Silverman and R. Linsker, “A measure of DNA periodic-
ity,” Journal of Theoretical Biology, vol. 118, no. 3, pp. 295–300,
1986.
[23] S. Tiwari, S. Ramachandran, A. Bhattacharya, S. Bhattacharya,
and R. Ramaswamy, “Prediction of probable genes by Fourier
analysis of genomic sequences,” Computer Applications in the
Biosciences, vol. 13, no. 3, pp. 263–270, 1997.
[24] W. Wang and D. H. Johnson, “Computing linear transforms of
symbolic signals,” IEEE Transactions on Signal Processing, vol.
50, no. 3, pp. 628–634, 2002.
[25] S. Hosid, E. N. Trifonov, and A. Bolshoy, “Sequence period-
icity of Escher ichia coli is concentrated in intergenic regions,”
BMC Molecular Biology, vol. 5, article 14, pp. 1–7, 2004.
[26] P. Worning, L. J. Jensen, K. E. Nelson, S. Brunak, and D. W.
Ussery, “Structural analysis of DNA sequence: evidence for
lateral gene transfer in Thermotoga maritima,” Nucleic Acids
Research, vol. 28, no. 3, pp. 706–709, 2000.
[27] R. F. Voss, “Evolution of long-range fractal correlations and
1/f noise in DNA base sequences,” Physical Review Letters, vol.
68, no. 25, pp. 3805–3808, 1992.
[28] W. A. Sethares and T. W. Staley, “Periodicity transforms,” IEEE
Transactions on Signal Processing, vol. 47, no. 11, pp. 2953–
2964, 1999.
[29] R. Arora and W. A. Sethares, “Detection of periodicities in
gene sequences: a maximum likelihood approach,” in Proceed-
ings of the 5th IEEE International Workshop on Genomic Signal
Processing and Statistics (GENSIPS ’07), Tuusula, Finland, June
2007.
[30] M. Akhtar, J. Epps, and E. Ambikairajah, “Signal processing
in sequence analysis: advances in eukaryotic gene prediction,”
IEEE Journal on Selected Topics in Signal Processing, vol. 2, no.
3, pp. 310–321, 2008.
[31] R. O. Schmidt, “Multiple emitter location and signal param-
eter estimation,” IEEE Transactions on Antennas and Propaga-
tion, vol. 34, no. 3, pp. 276–280, 1986.
[32] W. Li, T. G. Marr, and K. Kaneko, “Understanding long-range
correlations in DNA sequences,” Physica D, vol. 75, no. 1–3,
pp. 392–416, 1994.
[33] A. Fire, R. Alcazar, and F. Tan, “Unusual DNA structures
associated with germline genetic activity in Caenorhabditis
elegans,” Genetics, vol. 173, no. 3, pp. 1259–1273, 2006.