Báo cáo hóa học: " Editorial Video Tracking in Complex Scenes for Surveillance Applications" potx
Bạn đang xem bản rút gọn của tài liệu. Xem và tải ngay bản đầy đủ của tài liệu tại đây (3.3 MB, 13 trang )
Hindawi Publishing Corporation
EURASIP Journal on Image and Video Processing
Volume 2008, Article ID 659024, 13 pages
doi:10.1155/2008/659024
Research Article
Quality Assessment of Stereoscopic Images
Alexandre Benoit,
1
Patrick Le Callet (EURASIP Member),
1
Patrizio Campisi (EURASIP Member),
2
and Romain Cousseau
1
1
Ecole Polytechnique de l’Universit
´
e de Nantes, IRCCyN, rue Chritian Pauc, 44306 Nantes Cedex 3, France
2
Dipartimento di Elettronica Applicata, Universit
`
a degli Studi Roma Tre, Via della Vasca Navale 84, 00146 Roma, Italy
Correspondence should be addressed to Patrizio Campisi,
Received 31 March 2008; Revised 1 July 2008; Accepted 14 October 2008
Recommended by Stefano Tubaro
Several metrics have been proposed in literature to assess the perceptual quality of two-dimensional images. However, no similar
effort has been devoted to quality assessment of stereoscopic images. Therefore, in this paper, we review the different issues related
to 3D visualization, and we propose a quality metric for the assessment of stereopairs using the fusion of 2D quality metrics and of
the depth information. The proposed metric is evaluated using the SAMVIQ methodology for subjective assessment. Specifically,
distortions deriving from coding are taken into account and the quality degradation of the stereopair is estimated by means of
subjective tests.
Copyright © 2008 Alexandre Benoit et al. This is an open access article distributed under the Creative Commons Attribution
License, which permits unrestricted use, distribution, and reproduction in any medium, provided the original work is properly
cited.
1. INTRODUCTION
3D imaging is a wide research area driven both by the
entertainment industry and by scientific applications. Some
of the most recently advances have been recently published in
[1]. From John Logie Baird who introduced the first version
of stereo TV, many techniques have been developed [2]:
stereoscopic vision with polarizing glasses, autostereoscopic
displays for free viewpoint TV, or sophisticated holographic
systems. In parallel, methods for 3D scene representation [3]
and data content broadcasting [4] have been widely studied.
Applications are numerous. They range from entertain-
ment (videos, games) to more specialized applications such
as the educational ones [5] and medical applications like
body exploration [6, 7], therapeutic purposes [8], and so
forth.
Several signal processing operations [9, 10]havebeen
specifically designed for stereoscopic images. Therefore, the
necessity to define standardized protocols to assess the
perceived quality of the processed stereo images is evident.
Quality assessment of multimedia content is achievable
either through subjective tests or through objective metrics.
The best way to assess image and video quality would
surely be to run subjective tests according to standardized
protocols, which are defined in order to obtain correct,
universal, and reliable quality evaluations. However, the
use of subjective tests is a time consuming approach.
Furthermore, the analysis of the obtained results is not
straightforward. Therefore, the definition of objective met-
rics reliably predicting the perceived quality of images
would be a great improvement in the quality assessment
field.
Agreateffort has been devoted by both the academic
and the industrial communities to develop objective metrics
able to quantitatively evaluate the amount of degradation
undergonebyasignal,animage,oravideosequence.In
fact objective metrics can be used to accomplish different
tasks. Among the multitude of possible applications, it is
worth pointing out that they can be used for benchmarking
purposes to choose among several processing systems which
can be used for the same purpose on a digital media;
the system providing the best metric value will be used.
Moreover, when image and video delivery takes place in an
error prone scenario, objective quality metrics can be used as
side information for the image and video server to take the
necessary actions to improve the quality of the received data,
like prefiltering, optimal bit assignment algorithms, error
concealment methods, and so on.
However, although several subjective and objective qual-
ity assessment methods have been proposed in literature for
2 EURASIP Journal on Image and Video Processing
images and videos, no comparable effort has been devoted
to the quality assessment of stereoscopic images. With the
widespread of 3D technology applied to different fields such
as entertainment, CAD, medical applications, to cite only a
few, 3D images and videos need to be processed. Therefore,
the necessity to define both subjective procedures and
objective metrics to assess the quality of the processed stereo
images is becoming an issue of paramount importance.
From a visual point of view, 3D perception involves new
critical points which have to be taken into account. First,
subjective experiments [11–13]havetobeperformedin
order to identify the main new issues. Indeed, compared
to 2D images, perception of stereo content involves several
peculiar elements which cannot be considered when dealing
with the fruition of 2D content. Previous research tried to
identify these new factors, including the notion of “presence”
[14] which is related to the sensation of immersion in the 3D
visual scene. Moreover, the different technologies on which
3D displays are based on and are so different that two issues
must be considered: what is the impact of each technology
on the observer viewing experience and in a more general
way, independently of the technology, which factors have to
be taken into account to quantify 3D image quality and how
do they impact on visual perception? Subjective experiments
must be conducted to understand these two problems and
therelatedmodelshavetobedesigned.
Taking into account these considerations, we first pro-
pose to review quality issues for 3D images and recent
works on this purpose. Regarding the wide open area, we
then proposed to limit our study to stereopair images. Both
subjective and objective assessments are addressed within
this context taking care of the heritage of 2D image quality
assessment. The first attempt to build objective quality
metrics specifically tailored to stereo images was proposed
in [15] where a metric making use of reliable 2D metrics
applied to both the left and the right views has been
proposed. However, the depth information is not taken into
account
In this paper, we take a different perspective by using also
the depth information to design an objective metric for 3D
quality assessment.
The paper is organized as follows. In Section 2,quality
issues for 3D content display are briefly summarized.
Section 3 presents an overview of 3D subjective test used
in this work. Sections 4 and 5 present, respectively, the
objective quality metric we propose and the related results. In
Section 6, the obtained results are analyzed and conclusions
are drawn.
2. QUALITY ISSUES IN 3D
Because of the different physiological mechanisms on which
the fruition of stereo images is based with respect to those
involved when 2D content is analyzed, several new issues
have to be taken into account.
Generally speaking, 3D perception is based on various
depth cues such as illumination, relative size, motion,
occlusion, texture gradient, geometric perspective, disparity,
and many others. However, a very effective depth perception
sensation is obtained by viewing a scene from slightly
different viewing positions. From a physiological point
of view, given a scene in the real world, 2D slightly
different scenes are projected on the retina of each eye.
This implies that the 3D depth information is lost at this
stage. Then, the primary visual cortex in the brain fuses
the corresponding points of the stereopair by means of the
stereopsis mechanism and a prior knowledge on the 3D
world. Therefore, humans can perceive the depth starting
from the bidimensional images on the retina of each eye.
When 3D imaging systems try to mimic the behaviour
of the human visual system, the role of the eyes is taken
over by stereo cameras which capture a scene from slightly
different positions. The depth information can be obtained
using stereo vision techniques by means of the disparity,
the relative displacement of the stereo camera as well as its
geometry.
2.1. 3D perception and 3D displays
In the literature, 3D content visualization criteria generally
include image quality, naturalness, viewing experience, and
depth perception. These criteria are linked to the specific
display technology and also to the used data format. Since
several display technologies have been developed, it is of
paramount importance to study their impact on image
quality, depth perception, naturalness, and so forth.
Roughly speaking, the systems used to display stereo
images present alternatively to the left and the right eyes two
slightly different images in such a way that the human visual
system gets a perception of depth. More in detail, the 3D
rendering systems can be classified as either autostereoscopic
or stereoscopic displays. Autostereoscopic displays do not
need any special viewing glasses, but the viewing angle is not
very wide. On the other side, stereoscopic displays require
viewing glasses such as anaglyphic lenses, polarized glasses
for passive systems, or liquid crystal shutter glasses for active
systems. These systems allow the left and right images to
be projected onto a screen with different polarization or
colours. They are more affordable than autostereoscopic
displays and they can be used in commercial theatre as well
as in a home environment.
Then, considering one 3D imaging system, effects such
as crosstalk between views, key-stone distortion, depth-plane
curvature, puppet theater effect, cardboard effect, shear
distortion, picket-fence effect, and image flipping can appear
[12]. Also, compared to bidimensional data, raw stereo data
representation requires higher storage capacity and higher
bandwidth for transmission. Therefore, in order to make
these technologies deployable in real-life applications, coding
schemes have to be developed and their effect on visual
perception must be carefully analyzed. Previous studies
already report distortion effects such as blocking, blur-
ring, jerkiness, and ghosting. As a general rule, perception
and quality constancy regarding field of view have to be
investigated and the impact of depth representation, data
formats, and compressions have to be clearly identified. Both
the technological and the psychovisual factors influencing
stereopairs fruition are summarized in Ta ble 1 .
AlexandreBenoitetal. 3
Table 1: Issues in 3D from a technological and visual perception
point of view.
Technology factors Impact on perception
Data formats Impact of depth
Compression Quality constancy
Depth representation Field of view
Crosstalk Viewing experience
Distorsions Presence
2.2. Subjective studies
In [16], a wide variety of subjective tests to identify how
depth information retrieval, crosstalk, depth representation,
and asymmetrical compression impact on image quality,
naturalness, viewing experience presence, and visual strain
are described. These studies are related to specific 3D display,
but general considerations can be drawn for a much larger
audition. Some experiments on asymmetric JPEG coding
on stereopairs have highlighted that observers give a global
score depending on the image of the stereopair having the
lowest quality. The same experiments were performed with
asymmetric blur in [17]. However, in this case, the final score
depends on the image of the stereopair having the highest
quality. Therefore, the perceived quality of a stereopair,
whose images have been asymmetrically distorted, strictly
depends on the applied distortions, which is related to the
level of the human visual system masking effects. Following
the impact of asymmetric stereo images coding, tests were
carried out in order to identify the impact of eye dominance.
In [16, 18, 19], no effect of eye dominance was noticed
for image quality evaluation. Nevertheless, in [20], it was
observed that eye dominance improves the performance of
visual search task by aiding visual perception in binocular
vision, and the eye dominance effect in 3D perception
and asymmetric view coding was also analyzed. To clarify
this contradiction, other experiments should be designed in
order to clearly identify the role to eye dominance.
In [21] a depth perception threshold model is designed
and a 3D display benchmark is performed in order to identify
the most suitable technology for depth representation.
Nevertheless, the mechanisms related to depth perceptions
have still to be fully understood.
The impact of the depth information on the perceived
3D image quality is one of the main issues that has to
be investigated and it is still controversial. Recent studies
[16, 22] hypothesize that, from a psychovisual point of view,
depth is not related to the perceived three-dimensional effect.
Nevertheless, other studies point out the importance of
depth for quality perception. For example in [23] a blurring
filter, whose blur intensity depends on the depth of the area
where it is applied, is used to enhance the viewing experience.
This work is validated by the study reported in [24]which
shows that blurring 3D images reduce discrepancy between
responses of accommodation and convergence, so that blur
increases viewers’ experience. Also, methods which aim
at enhancing the local depth information on objects are
proposed, as in [25], where the algorithm directly impacts on
the image quality by taking into account depth information.
This overview, although incomplete, shows that the role
of depth in the perception mechanism of stereo images is
still not clearly identified. Nevertheless, depth information is
required to design objective quality metrics in order to take
into account viewers’ experience as well as signal processing
operations affecting depth information.
2.3. Discussion
2.3.1. Human perception and visual comfort
Since 3D displays design requires the knowledge of the
mechanisms driving 3D perception, human perception
investigations must be conducted, several factors have to
be taken into account such as accommodation issues,
and intereye masking effect can appear. Also physiological
differences between people (interpupillary distance [26, 27],
age [28, 29], etc.) impact on individual perception. One
of the most well known effects is related to visual fatigue
and visual discomfort [11, 30, 31]. Indeed, as 3D displays
allow the synthesis of objects at different distances from the
screen, artificial 3D content visualization can introduce an
accommodation and convergence discrepancy [32]. Indeed,
when viewing real 3D objects, both eyes converge on the
object and accommodation is naturally performed at the
object depth position. Nevertheless, when viewing an object
by means of a 3D screen, the eyes still converge at the virtual
object position but the accommodation has to be performed
at the screen depth level. This discrepancy is one of the causes
of visual fatigue and may also impact on visual functions
performance.
2.3.2. Safety and health issues
In addition to human factors related only to 3D perceptions,
it is important to identify all the cues related to human
vision performance degradation prevention for such display
technologies. Indeed, some recent studies [33, 34
] enlighten
some possible problems created by 3D display like decline
of visual functions after experiments requiring vergence
adaptation on 3D content. Also, asymmetrical image distor-
tions can cause vision degradation such as myopia increase
[32]. Some ophthalmologists remain concerned that viewing
stereoscopic images may cause strabismus, an abnormality
in binocular alignment in young children. However, there
is no evidence that the fruition of stereoscopic images
causes strabismus except for what is reported in [35]. An
extensive survey on the potential health problems related to
3D technologies is given in [32].
2.3.3. Further development
This brief overview shows that the design of a 3D quality
metric is a very challenging goal that involves many factors
interacting each other in a way that still needs to be clearly
modeled. At a first level of approximation, a preliminary
analysis can be done by focusing on a specific technology
4 EURASIP Journal on Image and Video Processing
and by studying the influence of a limited set of parameters
on the perceived quality of 3D images. In [15], in the
process of defining an objective quality metric specifically
designed for stereoscopic images, we evaluate whether 2D
image quality objective metrics are also suited for quality
assessment of stereo images. This method showed interesting
results when considering image distortions such as burr,
JPEG, and JPEG2000 compression applied symmetrically to
the stereopair images. Nevertheless, since depth information
is not exploited, particular aspects of the 3D perception such
as viewing experience and visual comfort are not taken into
account. Therefore, in this paper, we enhance the preliminary
study made in [15] by including also the depth information
in order to design an objective quality metric for stereo
images which takes into account the basic mechanisms of
the human visual system involved in the fruition of stereo
images.
3. SUBJECTIVE STEREO IMAGE
QUALITY ASSESSMENT
In general the design of objective quality assessment metrics
needs to be validated by subjective quality assessment. Then
the definition of specific test setups for subjective test
experiments is required. Methods have been proposed for
2D quality such as double stimulus continuous quality scale
(DSCQS) [36] and SAMVIQ [37]. We choose to follow
the SAMVIQ protocol which stability allows to conduct
the experiments in a more reliable way. More precisely,
the test was performed in a controlled environment as
recommended in ITU BT 500-11 [36], by using displays
with active liquid crystal shutter glasses. SAMVIQ is a
methodology for subjective test of multimedia applications
using computer displays, whose application can be extended
to embrace the full format television environment as well.
The method proposed by SAMVIQ specification makes
it possible to combine quality evaluation capabilities and
ability to discriminate similar levels of quality, using an
implicit comparison process. The proposed approach is
based on a random access process to play sequence files.
Observers can start and stop the evaluation process as they
wish and can follow their own paces in rating, modifying
grades, repeating play out when needed. Therefore, SAMVIQ
can be defined as a multistimuli continuous quality scale
method using explicit and hidden references. It provides
an absolute measure of the subjective quality of distorted
sequences which can be compared directly with the reference.
As the assessors can directly compare the impaired sequences
among themselves and against the reference, they can grade
them accordingly. This feature permits a high degree of
resolution in the grades given to the systems. Moreover,
there is no continuous sequential presentation of items as in
DSCQS method, which reduces possible errors due to lack of
concentration, thus offering higher reliability. Nevertheless,
since each sequence can be played and assessed as many
times as the observer wants, the SAMVIQ protocol is time
consumingandalimitednumberoftestscanbedone.
At the end of the test sessions, the difference mean
opinion score (DMOS) for the ithimageiscomputedas
Figure 1: Experimental setup: the user is facing the screen with
crystal shutter glasses.
the difference between the MOS for the hidden reference,
namely, MOS
hr
, and the one relative to the image i, MOS
i
,
DMOS
= MOS
hr
−MOS
i
. (1)
3.1. Test setup
Figure 1 shows the experimental setup we have used and
which is detailed hereafter.
In this paper, we perform subjective tests using six
stereo images shown in Figure 2. We consider for each
image five degradation levels per image distortion (JPEG
and JPEG2000) which leads to sixty degraded images plus
the six original images. More in detail, the image mean
size is 512
× 448 pixels viewed at standard resolution
(no upscaling, centred on the display) on a 1024
× 768
frame resolution, 21” Samsung SyncMaster 1100 MB display.
JPEG2000 compressions used bit rates ranging from 0.16 bits
per pixel (bpp) to 0.71 bpp while JPEG compression involved
bit rates ranging from 0.24 bpp to 1.3 bpp.
3.2. Human subjects
Seventeen observers, mostly males familiar with subjective
quality tests, with an average age of 28.2 years and a standard
deviation of 6.7 took part in the test. The observers had a
visual acuity, evaluated at a three-meter distance, at least
9 out of 10. Three observers have discarded because the
correlations between their individual scores and the mean
opinion score were lower than a fixed threshold that has
been set to 0.85. Each subject was individually briefed about
the goal of the experiment, and a demonstration of the
experimental procedure was given.
Each observer participated in two 30-minute sessions.
For each image evaluation step, observers were asked to score
the quality of the original stereo image (reference image),
the hidden reference, and seven degraded versions on a
continuous scale ranging from 0 to 100. Each distorted image
was picked up in a random order. Each observer scored the
sixty-six images available in the test. Subjective experiments
lead to ninety DMOS values.
AlexandreBenoitetal. 5
Figure 2: Left views of the tested stereopairs.
4. OBJECTIVE STEREO QUALITY ASSESSMENT
4.1. Overview of the proposed approach
In [15], we have introduced a metric for stereo images quality
assessment which relies on the use of some well-known 2D
quality metrics. Among the ones we have used in [15], it is
worth to briefly summarize the Structural SIMilarity (SSIM)
[38] and C4 [39] which have been used also in the proposed
approach as follows:
(i) Structural SIMilarity (SSIM) is an objective metric
for assessing perceptual image quality, working under
the assumption that human visual perception is
highly adapted for extracting structural information
from a scene. Quality evaluation is thus based on the
degradation of this structural information assuming
that error visibility should not be equated with loss of
quality as some distortions may be clearly visible but
not so annoying. Finally SSIM directly evaluates the
structural changes between two complex-structured
signals.
(ii) C4 is a metric based on the comparison between
the structural information extracted from the dis-
torted and the original images. This method exploits
an implementation of an elaborated model of the
human visual system. The full process can be
decomposed into two phases. During the first step,
perceptual representation is built for the original and
the distorted images, then, during the second stage,
representations are compared in order to compute a
quality score.
In [15], all the employed 2D metrics have been applied
separately on each image (left and right eyes) and fusion
methods, to obtain one overall score for the given stereopair,
have been investigated. The correlation between DMOS
and each of the objective metrics for each of considered
distortions has been calculated after a “mapping” operation
in order to evaluate the performances of the metrics. More
in detail “mapping” refers to the application of nonlinear
function as recommended by VQEG [40]inordertomap
metrics scores into subjective score space. For each condition,
parameters of the mapping function have been optimized. As
a preliminary result the average of both left and right eyes
measures gave the best result among the employed fusion
methods.
However, in the metric design in [15] no information
about the depth perception was taken into account. As
outlined in Section 2, the lack of depth information can lead
to discrepancy between 2D and 3D quality measures. Indeed,
for example, in some cases, the degradation of the single
images of a stereopair by using a blurring filter can help to
get better stereo viewing experience, whereas the measure of
the 2D degradation does not correlate with the enhanced
quality of stereo perception [24]. Therefore, in this paper,
we take this fact into account and, starting from the metric
designed in [15], we investigate the amount of information
added, if any, into the quality assessment process using depth
information. To this purpose, we propose to enhance the
original model by considering information strictly related to
the nature of the stereo images. Specifically, we choose to
focus on the disparity information. Indeed, as well known
[1, 41], the sense of stereo vision is related to the difference
in the viewpoint between eyes. Given two corresponding
points in the left and the right images of a stereopair,
the vector between the two points is called disparity. In
general, disparity can be used to reproduce one of the
two images of the stereopairs having the other one. More
in detail, two different disparity computation algorithms
have been selected for our purposes: the one described in
[42], namely, “bpVision” and the one presented in [43],
namely, “kz1”. These two algorithms model the disparity
by means of Markov random field (MRF). Nevertheless,
bpVision algorithm uses belief propagation for inference,
6 EURASIP Journal on Image and Video Processing
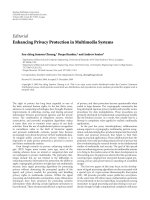
Original image JPEG2000, 0.8 bpp JPEG2000, 0.24 bpp JPEG2000, 0.08 bpp
Left views of a
stereopair
Corresponding
disparity
Figure 3: Original disparity map (left) and disparity maps computed after different JPG2000 compressions using bpVision algorithm.
Disp. Or
Disp. Dg
Left. Or
Left. Dg
Right. Or
Right. Dg
Q
Q
Q
disp
Mean
Combination
C
Final quality
score: Qf
Global disparity distortion
(D
dg
)
Average image distortion (M)
Figure 4: Quality estimation of stereopairs using original left
and right views (Left.Or, Right.Or) compared with the degraded
versions (Left.Dg, Right.Dg) and the related original disparity map
compared to the degraded disparity map (Disp.Or and Disp.Dg)
using a global approach.
while kz1 algorithm uses graph cuts and their formulations
of the MRF are different. The comparative study presented
in [44] shows that performances of the two methods are
close to each other and superior to those of other algorithms
proposed in literature. Graph cuts based methods give
smoother results because they are able to find a lower-energy
solution. On the other hand, belief propagation can maintain
some structures which are lost in the graph cuts solution.
From a computational cost point of view, accelerated belief
propagation methods such as bpVision are faster than graph
cuts based methods.
When distortions occur because of transmission on
error prone channels or signal processing operations, the
disparity map of the given stereopair is altered; see for
example Figure 3 where the original disparity map together
with the disparity map of a JPEG2000 coded stereopair
is displayed. These considerations suggest us to employ
also this information to assess the perceived quality of the
stereopair. However, only after validation of the quality
model by means of subjective experiments we can infer that
the depth information is relevant to the stereo image quality
evaluation process.
For the proposed metric, we measure the quality of the
distorted stereopair by measuring the following.
(i) The difference between original (left or right) images
and the corresponding (left or right) distorted
version. For this purpose, one can use usual 2D
perceptual quality metric such as SSIM or C4. As in
[15], the two measures per pair are averaged in order
to get the global 2D image distortion measure M.
(ii) The difference between the disparity map of the
original stereopair and the disparity map of the dis-
torted stereopair. It is worth pointing out that since
disparity maps are not natural images, perceptual-
based distortion metrics cannot be applied.
The combination of this information is made in two different
manners.
The first approach (sketched in Figure 4)istomeasurea
global disparity distortion and to combine this information
with the one coming from the evaluation of the stereopair as
a couple of two 2D images [15]. In this way, we investigate
the impact of the quality estimation in a global approach.
We evaluate individually the left and right views using either
SSIM or C4 2D metrics and mean the results. The so
obtained 2D quality score is fused with the score related to
the disparity distortion measure.
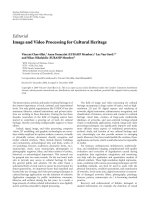
In the second approach (sketched in Figure 5), the dis-
parity distortion is measured locally and then it is fused with
the quality measures coming from 2D quality assessment
performed independently to the left and right images of the
stereopair. The final score is the mean score of left and right
distortions measures. SSIM is appropriate for this approach
since SSIM measures are available for each pixel of the images
by using the SSIM map (that we call M
map
). On the other
hand, C4 cannot be used since its algorithm focuses on
AlexandreBenoitetal. 7
Disp. Or
Disp. Dg
Left. Or
Left. Dg
Right. Or
Right. Dg
Q
Q
Q
disp
Mean
Mean
Mean
C
C
Combination
Combination
Final quality
score: Ddl
1
Local disparity distortion
(Euclidian distance)
Ddl
left
Ddl
right
Figure 5: Quality estimation of stereopairs using original left and right views (Left.Or, Right.Or) compared with the degraded versions
(Left.Dg, Right.Dg) and the related original disparity map compared to the degraded disparity map (Disp.Or and Disp.Dg) using a local
approach.
discrete areas on the image. The two different proposed
approaches are detailed in the two following subsections.
4.2. Image quality and global
disparity distortion measure
In this first approach, the impact of the global disparity
distortion measure D
dg
is computed using the correlation
coefficient between the original disparity maps and the corre-
sponding disparity maps processed after image degradation.
The final quality measure d is obtained after the fusion
of the disparity distortion measure D
dg
, and the averaged left
and right image distortion measures M. These two measures
both rank from 0 (maximum error measure) to 1 (no error
measured). Two different fusion rules, shown in (2), have
been tested. Moreover, the disparity distortion measure D
dg
has been considered by itself for comparison purposes, note
that other combinations can be considered but we focused
on these ones in order to limit the over training with
subjective data due to many possible combination. The main
objective is not to determine the best possible combination
but to find out a tradeoff tendency. Main differences between
chosen combinations are related to the weight assigned to
disparity distortions compared to intraimage (left or right)
distortions: d
3
only considers the disparity distortion while
d
1
and d
2
combine both disparity and intraimage distortions
(actually, d
1
gives more weight to the disparity distortion; d
2
first focuses on the 2D distortion measures and adds a cross
factor related to the disparity distortion measure):
d
1
= M·
D
dg
,
d
2
= M·
1+D
dg
,
d
3
= D
dg
.
(2)
By using C4 and SSIM metrics, we obtain seven different
global metrics to perform quality assessment: SSIM (no
disparity), C4 (no disparity), d
3
(disparity only), SSIM using
d
1
, C4 using d
1
, SSIM using d
2
, and C4 using d
2
.Themetric
d
1
limits the influence of the disparity distortion measure
while d
2
givesmoreweighttothismeasure.
Note that the correlation coefficient computation for dis-
parity distortion measure can be replaced by other methods.
For example, root mean square error (RMSE) can be used
since this method is currently involved in disparity algorithm
performances evaluation in [45], but in our context, global
RMSE gives quality metrics with lower performances. We
choose to present only correlation coefficient-based metrics
in order to make the paper more readable.
4.3. Image quality and local
disparity distortion measure
In this second approach, we propose an enhancement of
the metric proposed in the previous section by using the
local SSIM metric in conjunction with the local disparity
distortions measures. Indeed, SSIM estimates image quality
by evaluating three factors: luminance, contrast, and struc-
ture constancy (refer to [38] for more details). Here, we add
the contribution of a fourth factor related to the disparity
distortion measure, this “weight” being related to disparity
constancy. Following this idea, we propose to measure locally
the disparity distortion using the Euclidian distance thus
obtaining a weight for the local measure (no distortion gives
1, while the maximum distortion measure gives 0). The
proposed metric is thus evaluated by measuring the local
SSIM measure map M
map
and by fusing it with the local
disparity distortion measure using point-wise product. The
evaluated disparity distortion measure for each pixel p for
each view is the following (here for the left view):
Ddl
left
(p)=M
map left
(p)
1−
Disp.Or(p)
2
−Disp.Dg(p)
2
255
.
(3)
The final quality value Ddl
1
is obtained by first computing
the mean value of the N pixels of Ddl
left
and Ddl
right
maps
and by averaging both results (see Figure 5) as follows:
Ddl
1
=
1
2
1
N
N
Ddl
left
(p)+
1
N
N
Ddl
right
(p)
. (4)
8 EURASIP Journal on Image and Video Processing
Left SSIM map (M
map-left
) Local disparity distortion Ddl
left
Figure 6: Sample of local SSIM enhancement; from left to right: original SSIM map, the local disparity distortion map, and the Ddl
left
map.
Original image Blur JPEG compression JPEG2000 compression
Image
Disparity
(bpVision algorithm)
Figure 7: Sample of image degradations applied to the same image and the corresponding disparity maps.
Figure 6 shows examples of a 2D SSIM map result (here for
the left view), the local disparity distortion map obtained
with Euclidian distance measure, and the corresponding
Ddl
left
map.
5. RESULTS
We have computed these quality metrics on stereopairs when
applying JPEG, JPEG2000 compression, and blur filtering.
Figure 7 shows examples of image degradation and the
corresponding disparity maps.
Contrary to [15] where the metrics were evaluated
independently on each image distortion, we evaluate here
the performance of the metrics on all distortions at the same
time (e.g., mapping is applied on the overall database). As a
consequence, we consider simultaneously a larger spectrum
of possible distortions. We report the performance of all the
considered metrics in the same table in order to compare
them directly.
Results before mapping are presented in Ta bl e 2 .We
show the correlation coefficient CC between the measured
subjective DMOS (ERRATA Section 3.3, (1) CORRIGE
Section 3, (1)) and the scores obtained with the proposed
objective metrics, CC being a reliable performance mono-
tonicity indicator [40]. The original SSIM and C4 metrics
are compared with the new approaches including disparity
distortion information, using the two disparity computation
algorithms bpVision and kz1.
Significant performance improvements can be observed
with the SSIM-based metrics (SSIM with d
1
, d
2
,andDdl
1
)
using the bpVision disparity algorithm. When comparing the
correlation coefficientofbothoriginal2Dobjectivequality
M proposed in [15] and the disparity distortion d
3
,with
the new proposed metrics, we can see that they are less
correlated to the subjective DMOS than the proposed new
metrics d
1
, d
2
,andDdl
1
. Indeed, the original SSIM metric
and disparity degradation give correlation coefficient equal
to 0.77 and 0.67, respectively, while SSIM d
1
, d
2
,andDdl
1
metrics give correlation coefficient values equal to 0.84,
0.85, and 0.88, respectively. Then, linear combinations of 2D
metrics and disparity distortion measure give better results in
the SSIM case. More in detail, when considering SSIM Ddl
1
metric with the bpVision disparity algorithm, the resulting
correlation coefficient performs even better and gives results
close to C4 metric, the correlation coefficient difference being
only 0.03.
In parallel, global metrics based on C4 are not enhanced
by the added disparity information. Since C4 model is a
perceptual metric, this fact may confirm that quality for
static 3D images does not depend on the depth information
as hypothesized in [16, 22]. However, when the disparity
computation algorithm kz1 is used, results are more con-
tradictory. In fact the disparity distortion d
3
using kz1 is
much less correlated with the subjective DMOS than when
using bpVision algorithm (correlation coefficient varies from
0.59 for kz1 to 0.67 for bpVision). As a consequence, its
contribution in the proposed metric is expected not to be
efficient. As expected, the performance of global approaches
d
1
and d
2
, and local metrics Ddl
1
do not increase the
performance of the original SSIM metric, with a correlation
AlexandreBenoitetal. 9
Table 2: Metrics’ performances synthesis before mapping.
SSIM [27] SSIM d
1
SSIM d
2
C4 [27]C4d
1
C4 d
2
d
3
SSIM Ddl
1
CC
1
bpVision
0.77
0.84 0.85
0.91
0.91 0.90 0.67 0.88
CC
2
kz1 0.78 0.79 0.89 0.88 0.59 0.79
0
10
20
30
40
50
60
70
80
Original SSIM
01020304050607080
DMOS
(a)
0
10
20
30
40
50
60
70
80
Original C4
0
10 20 30 40 50 60 70 80
DMOS
(b)
Figure 8: Couple of points (DMOS, mapped objective score) for original SSIM and C4 metrics.
coefficient increase of 0.02, while it decreases with C4-based
metric.
Therefore, we can observe that combining the dispar-
ity distortion measure with SSIM metric enhances per-
formances and gives results close to perceptual objective
metrics such as C4. Also, the smoother disparity maps
computed by the kz1 algorithm do not allow a significant
performance increase while the sharper belief propagation
method (bpVision) performs better.
Figure 8 shows couples of points (DMOS, mapped
objective score) for SSIM and C4 original metrics. We can
see from this figure that C4 correlation coefficientishigher
while its RMSE is slightly lower.
Figure 9 compares plotted DMOS versus mapped objec-
tive score for SSIM using d
2
metric for both disparity
algorithms. We can see that kz1 disparity computation
algorithm gives a more disperse plot and, as a consequence,
alowercorrelationcoefficient. The smoother disparity maps
of the kz1 algorithm are less correlated with perceived image
quality than bpVision algorithm.
Figure 10 shows DMOS versus mapped objective score
for SSIM Ddl
1
metric with different symbols per type of
image distortion. We can see that no particular distortion
has a specific localization in the plot, which means that the
performances of the metric do not depend on the distortion
type. Also, compared to the original SSIM 2D metric, the
correlation coefficient has increased and it is close to the C4
perceptual metric.
Ta bl e 3 presents more complete results obtained after
data mapping, performed as detailed in Section 4.1.After
this operation, more indicators metric performance becomes
available such as root mean square error (RMSE on a unitary
scale) between the subjective DMOS and the objective
metrics. A low RMSE value indicates a reliable accuracy
of the metric with regard to the subjective DMOS. Also,
the outlier ratio (OR) is available and indicates the relative
number of samples which are out of the subjective DMOS
confidence interval (95%) as specified in [40]. This outlier
ratio indicates the consistency of the metric with regard
to the subjective measures (the lower value presents better
consistency). Note that we use the confidence interval of
subjective DMOS measures since such measure is based
on the mean score given by a set of observers during the
subjective evaluation session.
Compared to the original metrics coming from [15]
which do not take into account the disparity information,
the increase of the correlation coefficient due to mapping
is less significant for the new metrics. We obtain a maxi-
mum correlation coefficient increase of 0.03 with the new
metrics (d
1
, d
2
,andDdl
1
) while the original SSIM metric
increased by 0.08 and C4 without disparity increased by
0.01. This shows that the SSIM-based metrics which include
disparity distortion measures are basically more correlated
with the DMOS without the help of mapping. In addition,
considering metrics based on bpVision algorithm, RMSE
remains stable. More precisely, SSIM-based methods (d
1
, d
2
)
do not increase the original RMSE while Ddl
1
allows to
decrease it. In parallel, results after mapping confirm the
poor results obtained when kz1 disparity algorithm is used
in these new metrics. When observing the outliers ratios,
we can see that with the bpVision disparity computation
algorithm the ratios are lower than the ones obtained with
10 EURASIP Journal on Image and Video Processing
0
10
20
30
40
50
60
70
80
SSIM d
2
using bpVision
01020304050607080
DMOS
(a)
0
10
20
30
40
50
60
70
80
SSIM d
2
using kz1
01020304050607080
DMOS
(b)
Figure 9: Couple of points (DMOS, mapped objective score) for SSIM d
2
metric using bpVision and kz1 disparity computation algorithm.
Table 3: Metrics’ performances synthesis after mapping.
SSIM [27] SSIM d
1
SSIM d
2
C4 [27]C4d
1
C4 d
2
D
3
SSIM Ddl
1
CC bpVision 0.85 0.86 0.86 0.92 0.92 0.90 0.70 0.90
RMSE bpVision 0.47 0.46 0.46 0.36 0.37 0.40 0.65 0.41
OR bpVision 4% 4% 4% 1% 2% 2% 15% 2%
CC kz1 0.85 0.80 0.80 0.92 0.89 0.88 0.64 0.82
RMSE kz1 0.47 0.54 0.55 0.36 0.41 0.44 0.90 0.51
OR kz1 4% 10% 11% 1% 2% 5% 27% 7%
0
10
20
30
40
50
60
70
80
SSIM Ddl
1
01020304050607080
DMOS
JPEG
Linear
J2K
Blur
Figure 10: Couple of points (DMOS, mapped objective score) for
SSIM Ddl
1
metrics.
kz1 algorithm, and they are very close to the original SSIM
and C4 2D metrics values. Belief propagation method for
disparity computation is still more correlated with subjective
results.
Table 4: Metrics’ performances significance measure using Fisher
test.
M[27]versusd
1
M[27]versusd
2
M[27]versusDdl
1
F statistic 0.2011 0.2530 0.2344
In order to validate such metric performance increase
assumption, significance tests such as Fisher r-to Z statistical
test [46] confirm that the correlation values difference
between the original SSIM-based metric and the three new
SSIM- and bpVision-based metrics d
1
, d
2
,andDdl
1
is signif-
icantly different (see Ta bl e 4 ). In this table, the computed
probabilities associated to the F statistic, which compare the
differences among the previous and the new metrics, are
reported. All these values are greater than the critical value
0.05 such that the assumption of homoscedasticity is met for
each proposed new metric.
To summarize, belief propagation-based disparity (bpVi-
sion algorithm) enhances the SSIM metric and gives results
close to a perceptually based metric like C4. The choice
between C4 and SSIM with Ddl
1
metric can be done by
taking into account the computational cost of the two
algorithms. In fact, C4 is a very time consuming algorithm
since it integrates a global contrast sensitivity function
inspired by the human visual system followed by a number
of image filtering performed to determine salient areas where
human beings are most likely to discriminate artifacts. In
AlexandreBenoitetal. 11
0
5
10
15
20
25
Computing time (sec)
01.21.41.61.822.22.42.62.8
×10
5
512 ×512
Image
Number of pixels
C4
SSIM
Ddl
1
Figure 11: Evolution of the computation time of C4 and enhanced
SSIM with Ddl
1
metrics versus the image size (number of pixels).
order to compare the algorithm computational efficiency,
we have evaluated the computational time of both the C4
algorithm and the SSIM local method using Ddl
1
metric on
an Intel Quad Core 2.4 GHz based computer equipped with
4 Gb of RAM (each algorithm using only one thread). We
report on Figure 11, the evolution of the computation time
versus the image resolution for the two considered stereo
metrics. As shown in Figure 11, the computational time of
both metrics increases with the image resolution. However, a
significant difference can be observed between the 2 metrics;
in fact SSIM with disparity-based method is at least 5 times
faster. For example, when the metrics are computed for
pictures of size 512
× 512 pixels, the computational time of
C4 is approximately 20 seconds while for SSIM enhanced
metric with Ddl
1
3 seconds are enough to perform the
computation. To summarize, the considered metrics give
similar quality evaluation performances but the SSIM-based
metric computational time is much lower.
6. DISCUSSION AND CONCLUSIONS
In this paper, we have first reviewed the main quality issues in
stereo data, highlighting the different aspects of both stereo
technologies and stereo perception. From quality evaluation
to the viewing experience, 3D involves additional factors with
respect to the fruition of bidimensional content. The main
goal of this paper is to introduce an objective quality metric
for stereo images quality assessment. The proposed metric
relies on both the use of 2D metrics and depth information.
The presented results give some hints about the complex
problem of stereo quality metric design. First we can notice
that C4 well correlates with the subjective experiments when
no disparity information is used and that it is not enhanced
by the added disparity distortion information. This confirms
in a way the assumption that depth does not impact on the
quality assessment given in [16, 22].
Then, it has been shown that SSIM is enhanced when
adding the disparity distortion contribution. This fact may
be related to the fact that the luminance, contrast, and
structure criterion evaluation of the original SSIM are not
sufficient to assess quality from a perceptual point of view.
Then, the use of the disparity information brings to an
enhancement of the original metric. As for the disparity
computation algorithm, it has been shown that, within this
framework, belief propagation-based algorithms are more
efficient than graph cuts based methods. Indeed, the sharper
disparity maps coming from belief propagation are more
correlated with subjective quality metrics than smoother
graph cuts maps.
Finally, we have pointed out that the 3D quality assess-
ment method based on the use of 2D C4 metric is as efficient
as the enhanced SSIM with local disparity distortion measure
introduced in this paper but has a higher computational
cost. In this paper, we proposed an approach involving 2D
quality metrics while taking into account the stereo disparity
information; this can be considered as the final limit of the
conventional 2D approaches. It is worth pointing out that
dealing with stereo data introduces a new perspective; in
fact instead of dealing with quality assessment we should
refer to quality of experience. Indeed, since 3D involves
new perception factors such as the feeling of immersion,
presence [14], and so forth, image quality is not anymore
sufficient to represent the quality of the experience done by
the observer when immersed in a stereo environment. Then,
it is necessary to build a new setup which would take into
account all the factors related to 3D. The first attempt has
been drawn in [16] where image quality contributes with
depth information to a more global “naturalness” model
which contributes to a main “3D visual experience” model.
But the impact of depth and visual comfort is still waiting to
be investigated. New test setups have to be defined to identify
all the factors related to 3D visual experience.
Our results show that the depth information can improve
quality metric but the relation with image “naturalness,”
“viewing experience,” and “presence” has still to be investi-
gated in depth, depending also on the different 3D display
technology used. Some of these factors have been explored
from a subjective point of view in [16]butacomplete
analysis which could bring the definition of a universal and
objective quality metric for quality of experience assessment
forstereoimagesandvideoisstillfartocome.
ACKNOWLEDGMENT
This work was supported by FuturIm@ge project within the
“Media and Networks” French cluster.
REFERENCES
[1] IEEE Signal Processing Magazine, special section-multiview
imaging and 3DTV, November 2007.
[2]P.Benzie,J.Watson,P.Surman,etal.,“Asurveyof3DTV
displays: techniques and technologies,” IEEE Transactions on
12 EURASIP Journal on Image and Video Processing
Circuits and Systems for Video Technology, vol. 17, no. 11, pp.
1647–1658, 2007.
[3] A. A. Alatan, Y. Yemez, U. Gudukbay, et al., “Scene representa-
tion technologies for 3DTV—a survey,” IEEE Transactions on
Circuits and Systems for Video Technology, vol. 17, no. 11, pp.
1587–1605, 2007.
[4] A. Smolic, K. Mueller, N. Stefanoski, et al., “Coding algorithms
for 3DTV—a survey,” IEEE Transactions on Circuits and
Systems for Video Technology, vol. 17, no. 11, pp. 1606–1620,
2007.
[5] A. M. William and D. L. Bailey, “Stereoscopic visualization
of scientific and medical content,” in Proceedings of the 33rd
International Conference and Exhibition on Computer Graphics
and Interactive Techniques (SIGGRAPH ’06), p. 26, ACM,
Boston, Mass, USA, July-August 2006.
[6] P. Ljung, C. Winskog, A. Persson, C. Lundstrom, and A.
Ynnerman, “Forensic virtual autopsies by direct volume ren-
dering [DSP applications],” IEEE Signal Processing Magazine,
vol. 24, no. 6, pp. 112–116, 2007.
[7] C F. Westin, “Extracting brain connectivity from diffusion
MRI [life sciences],” IEEE Sig nal Processing Magazine, vol. 24,
no. 6, pp. 124–152, 2007.
[8] Y. A. W. De Kort and W. A. Ijsselsteijn, “Reality check: the
role of realism in stress reduction using media technology,”
Cyberpsychology & Behavior, vol. 9, no. 2, pp. 230–233, 2006.
[9] M. Z. Brown, D. Burschka, and G. D. Hager, “Advances in
computational stereo,” IEEE Transactions on Pattern Analysis
and Machine Intelligence, vol. 25, no. 8, pp. 993–1008, 2003.
[10]A.Puri,R.V.Kollarits,andB.G.Haskell,“Basicsof
stereoscopic video, new compression results with MPEG-
2 and a proposal for MPEG-4,” Signal Processing: Image
Communication, vol. 10, no. 1–3, pp. 201–234, 1997.
[11] M. T. M. Lambooij, W. A. Ijsselsteijn, and I. Heynderickx,
“Visual discomfort in stereoscopic displays: a review,” in
Stereoscopic Displays and Virtual Reality Systems XIV, vol. 6490
of Proceedings of SPIE, pp. 1–13, San Jose, Calif, USA, January
2007.
[12] L. M. J. Meesters, W. A. IJsselsteijn, and P. J. H. Seuntiens, “A
survey of perceptual evaluations and requirements of three-
dimensional TV,” IEEE Transactions on Circuits and Systems for
Video Technology, vol. 14, no. 3, pp. 381–391, 2004.
[13] C. Fehn, “3D TV broadcasting,” in 3D Videocommunication,
pp. 23–38, John Wiley & Sons, New York, NY, USA, January
2006.
[14] W. A. Ijsselsteijn, J. Freeman, and H. de Ridder, “Presence:
where are we?” Cyberpsychology & Behavior,vol.4,no.2,pp.
179–182, 2001.
[15] P. Campisi, P. Le Callet, and E. Marini, “Stereoscopic images
quality assessment,” in Proceedings of 15th European Sig-
nal Processing Conference (EUSIPCO ’07), Poznan, Poland,
September 2007.
[16] P. Seuntiens, Visual experience of 3D TV, Ph.D. thesis,
Eindhoven University, Eindhoven, The Netherlands, 2006.
[17]D.V.Meegan,L.B.Stelmach,andW.J.Tam,“Unequal
weighting of monocular inputs in binocular combination:
implications for the compression of stereoscopic imagery,”
Journal of Ex perimental Psychology: Applied,vol.7,no.2,pp.
143–153, 2001.
[18] H. Kalva, L. Christodoulou, and B. Furht, “Evaluation of
3DTV service using asymmetric view coding based on MPEG-
2,” in Proceedings of 3DTV-Conference, L. Christodoulou, Ed.,
pp. 1–4, Kos Island, Greece, May 2007.
[19]A.P.Mapp,H.Ono,andR.Barbeito,“Whatdoesthe
dominant eye dominate? A brief and somewhat contentious
review,” Perception and Psychophysics, vol. 65, no. 2, pp. 310–
317, 2003.
[20] E. Shneor and S. Hochstein, “Eff
ects of eye dominance in
visual perception,” in Proceedings of the Vision International
Congress, vol. 1282 of International Congress Series, pp. 719–
723, London, UK, April 2005.
[21] N. Holliman, B. Froner, and S. Liversedge, “An application
driven comparison of depth perception on desktop 3D
displays,” in Stereoscopic Displays and Virtual Reality Systems
XIV,A.J.Woods,N.A.Dodgson,J.O.Merritt,M.T.Bolas,
and I. E. McDowall, Eds., vol. 6490 of Proceedings of SPIE,pp.
1–22, San Jose, Calif, USA, January 2007.
[22] R. G. Kaptein, A. Kuijsters, M. T. M. Lambooij, W. A.
IJsselsteijn, and I. Heynderickx, “Performance evaluation of
3D-TV systems,” in Image Quality and System Performance V,
S. P. Farnand and F. Gaykema, Eds., vol. 6808 of Proceedings of
SPIE, pp. 1–11, San Jose, Calif, USA, January 2008.
[23] M. Zwicker, S. Yea, A. Vetro, C. Forlines, W. Matusik, and
H. Pfister, “Display pre-filtering for multi-view video com-
pression,” in Proceedings of the 15th International Conference
on Multimedia (Multimedia ’07), pp. 1046–1053, Augsburg,
Germany, September 2007.
[24] Y. Okada, K. Ukai, J. S. Wolffsohn, B. Gilmartin, A. Iijima, and
T. Bando, “Target spatial frequency determines the response to
conflicting defocus- and convergence-driven accommodative
stimuli,” Vision Research, vol. 46, no. 4, pp. 475–484, 2006.
[25] N. Holliman, “Smoothing region boundaries in variable depth
mapping for real-time stereoscopic images,” in Stereoscopic
Displays and Virtual Reality Systems XII, vol. 5664 of Proceed-
ings of SPIE, pp. 281–292, San Jose, Calif, USA, January 2005.
[26] N. A. Dodgso, “Variation and extrema of human interpupil-
lary distance,” in Stereoscopic Displays and Virtual Reality
Systems XI, vol. 5291 of Proceedings of SPIE, pp. 36–46, San
Jose, Calif, USA, May 2004.
[27]J.K.Bahn,J Y.Son,Y J.Choi,K.Kham,andC.S.
Chung, “Effects of interpupillary distance and AC/A ratio
on binocular fusion and depth perception,” in Proceedings of
the 9th International D isplay Workshops (IDW ’02), pp. 1303–
1306, Hiroshima, Japan, December 2002.
[28]J.F.Norman,T.E.Dawson,andA.K.Butler,“Theeffects
of age upon the perception of depth and 3-D shape from
differential motion and binocular disparity,” Perception, vol.
29, no. 11, pp. 1335–1359, 2000.
[29] J.F.Norman,A.M.Clayton,C.F.Shular,andS.R.Thompson,
“Aging and the perception of depth and 3-D shape from
motion parallax,” Psychology and Aging, vol. 19, no. 3, pp. 506–
514, 2004.
[30] S. Yano, S. Ide, T. Mitsuhashi, and H. Thwaites, “A study
of visual fatigue and visual comfort for 3D HDTV/HDTV
images,” Displays, vol. 23, no. 4, pp. 191–201, 2002.
[31] F. L. Kooi and M. Lucassen, “Visual comfort of binocular and
3D displays,” in Human Vision and Electronic Imaging VI,B.
E. Rogowitz and T. N. Pappas, Eds., vol. 4299 of Proceedings of
SPIE, pp. 586–592, San Jose, Calif, USA, January 2001.
[32] K. Ukai and P. A. Howarth, “Visual fatigue caused by
viewing stereoscopic motion images: background, theories,
and observations,” Displays, vol. 29, no. 2, pp. 106–116, 2008.
[33] M. Emoto, T. Niida, and F. Okano, “Repeated vergence
adaptation causes the decline of visual functions in watching
stereoscopic television,” Journal of Display Technology
, vol. 1,
no. 2, pp. 328–340, 2005.
[34] K. Ukai, “Human factors for stereoscopic images,” in Proceed-
ings of the IEEE International Conference on Multimedia and
Expo (ICME ’06), pp. 1697–1700, Toronto, Canada, July 2006.
AlexandreBenoitetal. 13
[35] S. Tsukuda and Y. Murai, “A case report of manifest esotropia
after viewing anaglyph stereoscopic movie,” Japanese Orthop-
tic Journal, vol. 18, pp. 69–72, 1988.
[36] ITU-R BT.500-11, Methodology for the Subjective Assessment
of the Quality of Television Pictures.
[37] EBU Project Group B/VIM Video in Multimedia, SAMVIQ:
Subjective Assessment Methodology for Video Quality. May
2003.
[38] Z. Wang, A. C. Bovik, H. R. Sheikh, and E. P. Simoncelli,
“Image quality assessment: from error visibility to structural
similarity,” IEEE Transactions on Image Processing, vol. 13, no.
4, pp. 600–612, 2004.
[39]M.Carnec,P.LeCallet,andD.Barba,“Animagequality
assessment method based on perception of structural infor-
mation,” in Proceedings of the IEEE International Conference
on Image Processing (ICIP ’03), vol. 2, pp. 185–188, Barcelona,
Spain, September 2003.
[40] VQEG, Video Quality Expert Group, rdoc
.gov/vqeg.
[41] O. Schreer, P. Kauff,andT.Sikora,Eds.,3D Videocommuni-
cation: Algorithms, Concepts and Real-Time Systems in Human
Centered Communication, John Wiley & Sons, New York, NY,
USA, 2005.
[42] P. F. Felzenszwalb and D. P. Huttenlocher, “Efficient belief
propagation for early vision,” International Journal of Com-
puter Vision, vol. 70, no. 1, pp. 41–54, 2006.
[43] V. Kolmogorov and R. Zabih, “Multi-camera scene recon-
struction via graph cuts,” in Proceedings of the 7th European
Conference on Computer Vision, pp. 82–96, Copenhagen,
Denmark, May 2002.
[44] M. F. Tappen and W. T. Freeman, “Comparison of graph
cuts with belief propagation for stereo, using identical MRF
parameters,” in Proceedings of the 9th IEEE International
Conference on Computer Vision (ICCV ’03), vol. 2, pp. 900–
907, Nice, France, October 2003.
[45] D. Scharstein and R. Szeliski, “A taxonomy and evaluation of
dense two-frame stereo correspondence algorithms,” Interna-
tional Journal of Computer Vision, vol. 47, no. 1–3, pp. 7–42,
2002.
[46] R. A. Fisher, Statistical Methods for Research Workers,Oliver
and Boyd, Edinburgh, UK, 1925.