Báo cáo hóa học: " Research Article Image Segmentation Method Using Thresholds Automatically Determined from Picture Contents" pot
Bạn đang xem bản rút gọn của tài liệu. Xem và tải ngay bản đầy đủ của tài liệu tại đây (2.35 MB, 15 trang )
Hindawi Publishing Corporation
EURASIP Journal on Image and Video Processing
Volume 2009, Article ID 140492, 15 pages
doi:10.1155/2009/140492
Research Article
Image Segmentation Method Using Thresholds Automatically
Determined from Picture Contents
Yuan Been Chen
1, 2
and Oscal T C. Chen
1
1
Department of Electrical Engineering, National Chung Cheng University, Chia-Yi 62102, Taiwan
2
Department of Electronic Engineering, Chienkuo Technology University, Changhua City 500, Taiwan
Correspondence should be addressed to Yuan Been Chen,
Received 1 June 2008; Revised 5 November 2008; Accepted 28 January 2009
Recommended by Jean-Philippe Thiran
Image segmentation has become an indispensable task in many image and video applications. This work develops an image
segmentation method based on the modified edge-following scheme where different thresholds are automatically determined
according to areas with varied contents in a picture, thus yielding suitable segmentation results in different areas. First, the
iterative threshold selection technique is modified to calculate the initial-point threshold of the whole image or a particular
block. Second, the quad-tree decomposition that starts from the whole image employs gray-level gradient characteristics of the
currently-processed block to decide further decomposition or not. After the quad-tree decomposition, the initial-point threshold
in each decomposed block is adopted to determine initial points. Additionally, the contour threshold is determined based on
the histogram of gradients in each decomposed block. Particularly, contour thresholds could eliminate inappropriate contours
to increase the accuracy of the search and minimize the required searching time. Finally, the edge-following method is modified
and then conducted based on initial points and contour thresholds to find contours precisely and rapidly. By using the Berkeley
segmentation data set with realistic images, the proposed method is demonstrated to take the least computational time for
achieving fairly good segmentation performance in various image types.
Copyright © 2009 Y. B. Chen and O. T C. Chen. This is an open access article distributed under the Creative Commons
Attribution License, which permits unrestricted use, distribution, and reproduction in any medium, provided the original work is
properly cited.
1. Introduction
Image segmentation is an important signal processing tool
that is widely employed in many applications including
object detection [1], object-based coding [2–4], object
tracking [5], image retrieval [6], and clinical organ or
tissue identification [7]. To accomplish segmentations in
these applications, the methods can be generally classified
as region-based and edge-based techniques. The region-
based segmentation techniques such as semisupervised sta-
tistical region refinement [8], watershed [9], region growing
[10], and Markov-random-field parameter estimation [11]
focus on grouping pixels to become regions which have
uniform properties like grayscale, texture, and so forth. The
edge-based segmentation techniques such as Canny edge
detector [12], active contour [13], and edge following [14–
16] emphasize on detecting significant gray-level changes
near object boundaries. Regarding to the above-mentioned
methods, the segmenting mechanisms associated with users
can be further categorized as either supervised segmentation
or unsupervised segmentation.
The advantage of the region-based segmentation is
that the segmented results can have coherent regions,
linking edges, no gaps from missing edge pixels, and so
on. However, its drawback is that decisions about region
memberships are often more difficult than those about edge
detections. In the literature, the Semisupervised Statistical
Region Refinement (SSRR) method developed by Nock and
Nielsen is to segment an image with user-defined biases
which indicate regions with distinctive subparts [8]. SSRR
is fairly accurate because the supervised segmentation is not
easily influenced by noise, but is highly time-consuming.
The unsupervised DISCovering Objects in Video (DISCOV)
technique developed by Liu and Chen could discover the
major object of interest by an appearance model and a
motion model [1]. The watershed method that is applicable
2 EURASIP Journal on Image and Video Processing
to nonspecific image type is also unsupervised [9, 17]. The
implementation manners of the watershed method can be
classified into rain falling and water immersion [18]. Some
recent watershed methods use the prior information-based
difference function instead of the more-frequently-used
gradient function to improve the segmented results [19]and
employ the marker images as probes to explore a gradient
space of an unknown image and thus to determine the best-
matched object [20]. The advantage of the watershed method
is that it can segment multiple objects in a single threshold
setting. The disadvantage of the watershed method is that
the different types of images need different thresholds. If the
thresholds are not set correctly, then the objects are under-
segmented or over-segmented. Additionally, slight changes in
the threshold can significantly alter the segmentation results.
In [21, 22], the systematic approach was demonstrated to
analyze nature images by using a Binary Partition Tree
(BPT) for the purposes of archiving and segmentation.
BPTs are generated based on a region merging process
which is uniquely specified by a region model, a merging
order, and a merging criterion. By studying the evolution of
region statistics, this unsupervised method highlights nodes
which represent the boundary between salient details and
provide a set of tree levels from which segmentations can
be derived.
The edge-based segmentation can simplify the analysis
by drastically minimizing the amount of pixels from an
image to be processed, while still preserving adequate object
structures. The drawback of the edge-based segmentation
is that the noise may result in an erroneous edge. In the
literature, the Canny edge detector employed the hysteresis
threshold that adapts to the amount of noise in an image,
to eliminate streaking of edge contours where the detector
is optimized by three criteria of detection, localization,
and single response [12]. The standard deviation of the
Gaussian function associated with the detector is adequately
determined by users. The Live Wire On the Fly (LWOF)
method proposed by Falcao et al. helps the user to obtain
an optimized route between two initial points [23]. The
user can follow the object contour and select many adequate
initial points to accomplish that an enclosed contour is
found.ThebenefitofLWOFisthatitisadaptivetoany
type of images. Even with very complex backgrounds, LWOF
can enlist human assistance in determining the contour.
However, LWOF is limited in that if a picture has multiple
objects, each object needs to be segmented individually and
the supervised operation significantly increases the operating
time. The other frequently adopted edge-based segmentation
is the snake method first presented by Kass et al. [24]. In this
method, after an initial contour is established, partial local
energy minima are calculated to derive the correct contour.
The flaw of the snake method is that it must choose an initial
contour manually. The operating time rises with the number
of objects segmented. Moreover, if the object is located
within another object, then the initial contours are also
difficult to select. On the other hand, Yu proposed a super-
vised multiscale segmentation method in which every pixel
becomes a node, and the likelihood of two nodes belonging
together is interpreted by a weight attached to the edge
linking these two pixel nodes [25]. Such approach allows that
image segmentation becomes a weighted graph partitioning
problem that is solved by average cuts of normalized affinity.
The above-mentioned supervised segmentation methods are
suitable for conducting detailed processing to objects of
segmentation under user’s assistance. In the unsupervised
snake method also named as the active contour scheme,
the geodesic active contours and level sets were proposed to
detect and track multiple moving objects in video sequences
[26, 27]. However, the active contour scheme is generally
applied when segmenting stand-alone objects within an
image. For instance, an object located within the complicated
background may not be easily segmented. Additionally, con-
tours that are close together cannot be precisely segmented.
Relevant study, the Extended-Gradient Vector Flow (E-GVF)
snake method proposed by Chuang and Lie has improved
upon the conventional snake method [28]. The E-GVF snake
method can automatically derive a set of seeds from the
local gradient information surrounding each point, and thus
can achieve unsupervised segmentation without manually
specifying the initial contour. The noncontrast-based edge
descriptor and mathematical morphology method were
developed by Kim and Park and Gao et al., respectively,
for unsupervised segmentation to assist object-based video
coding [29, 30].
The conventional edge-following method is another
edge-based segmentation approach that can be applied to
nonspecific image type [14, 31]. The fundamental step
of the edge-following method attempts to find the initial
points of an object. With these initial points, the method
then follows on contours of an object until it finds all
points matching the criteria, or it hits the boundary of a
picture. The advantage of the conventional edge-following
method is its simplicity, since it only has to compute the
gradients of the eight points surrounding a contour point to
obtain the next contour point. The search time for the next
contour point is significantly reduced because many points
within an object are never used. However, the limitation
of the conventional edge-following method is that it is
easily influenced by noise, causing it to fall into the wrong
edge. This wrong edge can form a wrong route to result in
an invalid segmented area. Moreover, the fact that initial
points are manually selected by users may affect accuracy
of segmentation results due to inconsistence in different
times for selection. To improve on these drawbacks, the
initial-point threshold calculated from the histogram of
gradients in an entire image is adopted to locate positions
of initial points automatically [15]. Additionally, the contour
thresholds are employed to eliminate inappropriate contours
to increase the accuracy of the search and to minimize the
required searching time. However, this method is limited
in that the initial-point threshold and contour threshold
remain unchanged throughout the whole image. Hence,
optimized segmentations cannot always be attained in areas
with complicated and smooth gradients. If the same initial-
point threshold is employed throughout an image with areas
having different characteristics, for example, a half of the
image is smooth, and the other half has major changes in
gradients, then the adequately segmented results can clearly
EURASIP Journal on Image and Video Processing 3
Smooth
Complicated
(a) (b)
0 50 100
0
1000
2000
0 50 100
0
1000
2000
0 50 100
0
200
400
0 100 200
0
200
400
0 50 100
0
200
400
0 50 100
0
1000
2000
0 50 100
0
2000
4000
0 100 200
0
500
0 100 200
0
100
200
0 50 100
0
2000
4000
0 100 200
0
500
1000
0 100 200
0
100
200
0 50 100
0
1000
2000
0 50 100
0
1000
2000
0 100 200
0
200
400
0 100 200
0
100
200
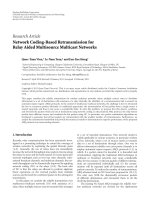
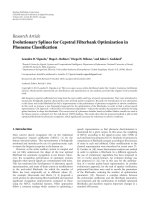
Figure 1: Content characteristics of the “garden” image. (a) Image partitioned into 16 blocks. (b) Histogram formed by average values of
gradients for all points in each block.
only be obtained from one side of the image, while the
objects from the other side are not accurately segmented.
This work proposes a robust segmentation method that is
suitable for nonspecific image type. Based on the hierarchical
segmentation under a quad-tree decomposition [32, 33],
an image is adequately decomposed into many blocks and
subblocks according to the image contents. The initial-point
threshold in each block is determined by the modified
iterative threshold selection technique and the initial-point
threshold of its parent block. Additionally, the contour
threshold is calculated based on the histogram of gradients
in each block. Using these two thresholds, the modified edge-
following scheme is developed to automatically and rapidly
attain fairly good segmentation results. Segmentations on
various types of images are performed during simulations
to obtain the accuracy of segmentations using methods such
as the proposed, watershed, active contour, and others. To
do fair comparison, the data set and benchmarks from the
Computer Vision Group, University of California at Berkeley
were used [34]. Simulation results demonstrate that the
proposed method is superior to the conventional methods
to some extent. Owing to avoiding human interferences
and reducing operating time, the proposed method is more
robust and suitable to various image and video applications
than the conventional segmentation methods.
2. Proposed Robust Image
Segmentation Method
This work develops a robust image segmentation method
based on the modified edge-following technique, where
different thresholds are automatically generated according to
the characteristics of local areas. Taking the “garden” image
in Figure 1(a) as an example, Figure 1(b) divides this image
into 16 bocks and calculates the average value of gradients
between the currently processed point and its neighboring
points in eight compass directions to plot a histogram of
the average values from all points in each block. Looking at
these histograms, the complicated part circled in the diagram
represents the area of extreme changes in gradients. With a
larger variation of gradients, the threshold for this area must
also be larger than that adopted in the smooth area to prevent
over-segmentation. To adapt to variations of gradients in
each area, the quad-tree decomposition is adopted to divide
an image into four blocks at an equal size and would
continue to divide further depending on complexities of
the blocks. If the criteria for further decomposition are
satisfied, then the block or subblock is divided into four
subblocks or smaller subblocks; otherwise, it would stop
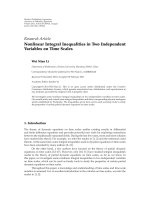
here. The proposed decomposition would continue until all
blocks and subblocks are completely obtained, as shown
in Figure 2. During the quad-tree decomposition process,
different threshold values can be determined for each
decomposed block, according to variations in the gradients
of each decomposed block, to attain accurate segmentation
results. The major differences between the proposed robust
image segmentation method and our previous work [15]
are quad-tree decomposition, adaptive thresholds in each
decomposed blocks, and direction judgment in the edge
following. To clearly illustrate the proposed method, four
stages are introduced. First, the iterative threshold selection
technique is modified to calculate the initial-point threshold
of the whole image or a particular block from the quad-
tree decomposition. Second, the quad-tree decomposition
is applied to establish decomposed blocks, where gray-level
gradient characteristics in each block are computed for
deciding further decomposition or not. After the quad-tree
decomposition, the contour threshold of each decomposed
block is calculated in the third stage. Initial-point thresholds
4 EURASIP Journal on Image and Video Processing
(a) (b)
Figure 2: Blocks and subblocks resulted from the quad-tree decom-
position process. (a) Original image. (b) Decomposed blocks.
2, 10, −6
1, 9,
−7
0, 8,
−8
7, 15,
−1
6, 14,
−2
5, 13,
−3
4, 12,
−4
3, 11,
−5
Figure 3: Values of d representing eight compass directions.
are used to determine the initial points while contour
thresholds can eliminate inappropriate contours to increase
the accuracy of search and minimize the required searching
time. Finally, the modified edge-following method is used to
discover complete contours of objects. Details of each stage
are described below.
2.1. Stage of Applying the Modified Iterative Threshold
Selection Technique. In this stage, the gradient between the
currently processed point (x, y) and its neighboring point in
one of eight compass directions is first determined by using
the following equation:
G
d
(x, y) =|I(x, y) − I(x
d
, y
d
)|,(1)
where (x
d
, y
d
)neighborsto(x, y) in direction d,andI(x, y)
and I(x
d
, y
d
) denote the gray-level values at locations (x, y)
and (x
d
, y
d
), respectively. Here, d is a value denoting one of
the eight compass directions as shown in Figure 3.Ford>7,
the remainder of d divided by 8 is taken. When d<0, d is
added by a multiple of 8 to become a positive value smaller
than 8. Hence, “1”, “9”, and “
−7” denote the same directions.
This will be useful in Section 2.4.
G(x, y) is defined to take a mean of G
d
(x, y)ineight
directions for the point (x, y) in the following equation:
G(x, y) =
1
8
7
d=0
G
d
(x, y). (2)
The iterative threshold selection technique that was proposed
by Ridler and Calvard to segment the foreground and back-
ground is modified to calculate the initial-point threshold
of the whole image or a particular block from the quad-
tree decomposition, for identifying initial points [35]. The
modified iterative threshold selection technique is illustrated
as follows.
(1) Let k
= 0, T
k
= (MAX[G(x, y) | (x, y) ∈
all points in a decomposed block])/2, where MAX
is a function to select the maximum value.
(2) T
k
is adopted to classify all points in a decomposed
block into initial and noninitial points. A point with
G(x, y) ≥ T
k
is an initial point, while a point with
G(x, y) <T
k
is a noninitial point. The groups of
initial and noninitial points are denoted by I and NI,
respectively. In these two groups, the averaged
G(x, y)
is computed by
u
k
=
(x,y)∈I
G(x, y)
#I
,
v
k
=
(x,y)∈NI
G(x, y)
#NI
,
(3)
where #I and #NI denote the numbers of initial and
noninitial points, respectively,
(3)
T
k+1
= round(w
I
× u
k
+ w
NI
× v
k
), (4)
where round(λ) rounds off the value of λ to the
nearest integer number. w
I
and w
NI
, ranging from
0 to 1, denote the weighting values of initial and
noninitial groups, respectively. Additionally, w
I
+
w
NI
= 1.
(4) If T
k+1
/
= T
k
, then k = k + 1 and go to Step 2, else
Tg
= T
k
.
Notably, T
k
is limited to the range between 0 and 255,
and rounded off into a specific integer in the iterative
procedure so that the above-mentioned iteration always
converges. Usually, w
I
and w
NI
are set to 0.5 to allow Tg
locating in the middle of two groups. To avoid missing
some initial points in low-contrast areas of an image with
complicated contents, w
NI
can be increased to lower Tg.
However, with an increasing decomposition level in the
quad-tree decomposition process, w
NI
can be lowered for
a small decomposed block that has a consistent contrast.
Taking the “alumgrns” image in Figure 4 as an example, the
initial-point threshold Tg of the entire image calculated by
the modified iterative threshold selection is 16 under w
I
=
w
NI
= 0.5. The rough contour formed by initial points can
befoundasdepictedinFigure 4(b), but the contour is not
intact. Hence, the quad-tree decomposition in the following
stage would take this Tg as the basis to compute the initial-
point threshold value of each decomposed block depending
on the complexity of each area.
2.2. Stage of the Quad-Tree Decomposition Process. In this
stage, the whole image is partitioned into many blocks by
using quad-tree decomposition. The quad-tree decomposi-
tion process starts with the initial-point threshold, mean and
standard deviations derived from the entire image on the
top level. At each block, the process determines the initial-
point threshold and whether this block should be further
decomposed. For the whole image or each block, Figure 5
EURASIP Journal on Image and Video Processing 5
(a) (b)
Figure 4: “alumgrns” image. (a) Original image. (b) White points
with
G(x, y) >Tg.
shows the flow chart of the quad-tree decomposition to
determine whether the currently processed block is further
decomposed and to calculate the initial-point threshold of
this block. Assume that the block B
t
with a mean M
t
and
a standard deviation S
t
of gray-level gradients is currently
processed. The parent block of B
t
is represented by B
t−1
in
which initial-point threshold, mean and standard deviations
are denoted by Tg
t−1
, M
t−1
and S
t−1
,respectively.While
G(x, y) of each point in the block B
t
is smaller than Tg
t−1
,
the block B
t
does not contain any initial point and thus
its initial-point threshold Tg
t
is set to Tg
t−1
in order to
avoid the initial-point generation. Under such a situation,
there is no further decomposition in the block B
t
. On the
other hand, when
G(x, y) of any point of the block B
t
is
larger than Tg
t−1
, the block B
t
is further decomposed into
four subblocks. Additionally, Tg
t
is temporarily given by the
value computed by the modified iterative threshold selection
technique in the block B
t
.IfM
t
<M
t−1
and S
t
<S
t−1
, then
the block B
t
would contain a smoother area than the block
B
t−1
.LetTg
t
= Tg
t−1
to prevent the reduction of the initial-
point threshold from yielding the undesired initial points.
If M
t
≥ M
t−1
and S
t
≥ S
t−1
, the complexity of the block
B
t
is increased. In this situation, the block B
t
may contain
contour points, but may also include many undesired noises
or complicated image contents. Hence, raising the initial-
point threshold by Tg
t
= MAX(Tg
t
, Tg
t−1
) to allow that
Tg
t
≥ Tg
t−1
can eliminate the noises and reduce the over-
segmentation result in the block B
t
. Otherwise, the initial
point threshold Tg
t
of the block B
t
that may contain objects
is remained as the value from the modified iterative threshold
selection technique conducted in the block B
t
.
During the quad-tree decomposition process, w
I
can be
set by a value smaller than 0.5 at the first decomposition
level to lower Tg for capably attaining initial points from
low-contrast areas. Additionally, w
I
is increased with a
decomposition level. For the smallest decomposed block in
the last decomposition level, w
I
can be a value larger than
or equal to 0.5 for increasing Tg to avoid the undesired
initial points. Notably, the initial-point thresholds of blocks
with drastic gray-level changes would rise, whereas the
initial-point thresholds of blocks with smooth gray-level
changes would fall. This approach of determining initial-
point threshold can obtain adequate initial points based on
the complexity of image contents.
After the quad-tree decomposition is finished, the posi-
tions and moving directions of initial points in each block are
recorded accordingly.
(1) (x, y) is a point from a decomposed block B
t
.
(2) If
G(x, y) ≥ Tg
t
then (x, y) is labeled as the
initial point and d
∗
is recorded where G
d
∗
(x, y) =
MAX[G
d
(x, y), for 0 ≤ d ≤ 7].
(3) Repeat step 2 for all points in the block B
t
.
2.3. Stage of Determining the Contour Threshold Tc. At the
end of the quad-tree decomposition process, the gradients
of each decomposed block are computed to determine the
contour threshold Tc. According to (1), the largest value of
G
d
(x, y) in the eight directions is G
d
∗
(x, y), where d
∗
is a
specific value of d for yielding the maximum G
d
(x, y). The
histogram of G
d
∗
(x, y) from all points of the decomposed
block is calculated. Here, H(k) is assumed to be the number
of the absolute gray-level difference being k.Ifadecomposed
block comprises many one-pixel lines that are all black and
white in an interlaced manner, then this decomposed block
contains the maximum number of contour points, which is
half the number of points in the decomposed block. Restated,
the first half of the histogram results from noncontour
points at least. Accordingly, the contour threshold Tc can
be the index value, indicating that
Tc
k=0
H(k) denotes half
the number of points in a decomposed block, as indicated in
Figure 6. This threshold does not miss any contour points.
When the search is conducted for contour points, Tc is used
to determine whether to stop the search procedure in the
modified edge-following scheme. If the differences between
the predicted contour point and its left and right neighboring
points are less than Tc, then the search has taken the wrong
path, and should stop immediately. This approach not only
prevents searching in the wrong path, but also saves on the
search time. Additionally, Tc of each decomposed block is
independently determined to adapt to the characteristics of
each area.
2.4. Stage of Applying the Modified Edge-Following Method.
The initial-point threshold Tg, contour threshold Tc,and
initial points are obtained in the previous stages. In this stage,
the searching procedure is started from each initial point
until the closed-loop contour is found. The position and
direction of the kth searched contour point are represented
by w
k
= (x
k
, y
k
)andd
k
, respectively. The modified edge-
following method is given as follows.
(1) Select an initial point and its d
∗
. This initial point
is represented by w
0
and set d
0
= d
∗
+ 2 where the edge-
following direction d
0
is perpendicular to the maximum-
gradient direction d
∗
.Here,d
0
is a value denoting one of the
eight compass directions as shown in Figure 3.
(2) Let k
= 0, where k is the contour-point index. The
searching procedure begins from the initial point w
0
and the
direction d
0
.
(3) First, to reduce computational time, the search is
restricted to only three directions by setting i
= 3, where i
6 EURASIP Journal on Image and Video Processing
Start
Currently processed block B
t
Tg
t−1
, M
t−1
& S
t−1
from B
t−1
Ye s
No further decomposition
Tg
t
= Tg
t−1
No
G(x, y) <Tg
t−1
,forall(x, y)ofB
t
B
t
decomposed to 4 subblocks
calculating Tg
t
, M
t
& S
t
No
No No
Ye s
Ye sYe s
End
M
t
≥ M
t−1
S
t
≥ S
t−1
M
t
<M
t−1
Tg
t
= Tg
t−1
Tg
t
Tg
t
= MAX(Tg
t
, Tg
t−1
)
Figure 5: Flow chart of quad-tree decomposition.
0
500
1000
1500
2000
2500
3000
3500
4000
4500
5000
H(k)
0 50 100 150 200
kTc
Noncontour points
Contour points
Figure 6: Histogram of G
d
∗
(x, y).
denotes the number of directions needed. The direction d
k+1
of the next point thus has three possible values: d
k−1
, d
k
and
d
k+1
. For instance, if d
k
= 1, then the next contour point w
k+1
could appear at the predicted contour point p
0
k+1
, p
1
k+1
or
p
2
k+1
, as shown in Figure 7(a). With the left-sided point l
d
k
+j
k+1
and right-sided point r
d
k
+j
k+1
of the predicted contour point
p
d
k
+j
k+1
, the line formed by w
k
and p
d
k
+j
k+1
points is perpendicular
to the line between l
d
k
+j
k+1
and r
d
k
+j
k+1
,wherej indicates the
direction deviation, as revealed in Figure 7(b) under d
k
= 1
and j
= 0. Additionally, l
d
k
+j
k+1
and r
d
k
+j
k+1
can be represented as
l
d
k
+j
k+1
=
x
k
+round
2cos
(d
k
+ j +1)×
π
4
,
y
k
− round
2sin
(d
k
+ j +1)×
π
4
,
r
d
k
+j
k+1
=
x
k
+round
2cos
(d
k
+ j − 1) ×
π
4
,
y
k
− round
2sin
(d
k
+ j − 1) ×
π
4
,
(5)
respectively, where j ranges from
−(i − 1)/2to(i − 1)/2,
round(λ) rounds off the value of λ to the nearest integer
number.
(4) The gray-level average values
L
k
and R
k
of the
previous contour points are calculated as
L
k
=
1
k +1
k
p=0
I
l
d
k− p
k− p
,
R
k
=
1
k +1
k
p=0
I
r
d
k− p
k− p
.
(6)
(5) E
k+1,l
(j)andE
k+1,r
(j) that interpret the relationships
among the predicted point, its left-sided and right-sided
EURASIP Journal on Image and Video Processing 7
points, and
L
k
and R
k
, are used to obtain the next probable
contour point:
E
k+1,l
(j) =
I
p
d
k
+j
k+1
−
I
l
d
k
+j
k+1
−
I
l
d
k
+j
k+1
−
L
k
,
(7)
E
k+1,r
(j) =
I
p
d
k
+j
k+1
− I
r
d
k
+j
k+1
−
I
r
d
k
+j
k+1
− R
k
. (8)
Equations (7)and(8) are used to determine the (k +1)th
contour point. The first term represents the gradient between
the predicted point and its left-sided or right-sided point.
The second term may prevent (7)or(8) from finding
the wrong contours due to the noise interference. If the
difference in the second term is too large, then the wrong
contour point may be found.
(6) Select the largest value by using F
k+1
(j) =
MAX[E
k+1,l
(j)orE
k+1,r
(j), for − (i − 1)/2 ≤ j ≤ (i − 1)/2].
If F
k+1
(j) ≥ Tc, then the correct direction has been found,
and go to step 8. Here, Tccomes from the decomposed block
which the predicted contour point p
d
k
+j
k+1
belongs to.
(7) If i
= 3, then the previously searched direction may
have deviated from the correct path and set i
= 7toobtain
the seven neighboring points for direction searching, going
to step 5. Otherwise, stop the search procedure, and go to
step 10.
(8) From F
k+1
(j), the correct direction d
k+1
and position
of the (k + 1)th contour point are calculated as follows:
d
k+1
= d
k
+ j,
w
k+1
=
x
k
+round
cos
d
k+1
×
π
4
,
y
k
− round
sin
d
k+1
×
π
4
.
(9)
(9) The searching procedure is finished when the (k +
1)th contour point is in the same position as any of the
previous searched contour points or has gone beyond the
four boundaries of the image. If neither condition is true,
then set k
= k + 1, and return to step 3 to discover the next
contour point.
(10) If d
0
= d
∗
+2,setd
0
= (d
∗
+ 6) and go to step 2
to search for the contour points in the opposite direction to
d
∗
+2.
(11) Go to step 1 for another initial point that is
not searched. When all initial points are conducted, the
procedure of the modified edge-following method is ended.
During the searching process, taking in the left and right
neighboring points of the next predicted contour point in
computation would significantly reduce the tendency of the
edge-following method to deviate from the correct edge due
to noise interferences. Only three directions are first searched
in the searching process. If the F
k+1
(j) values of these three
directions are all below Tc, then the search proceeds to the
seven directions. The searching time is thus significantly
decreased, since most searches only need the computation
of the gradients in three directions. Figure 8 depicts the flow
chart of the proposed modified edge-following scheme that
searches from an initial point.
p
2
k+1
p
1
k+1
w
k
p
0
k+1
(a)
l
1
k+1
r
1
k+1
w
k
p
1
k+1
(b)
Figure 7: Relationship of w
k
with its neighboring points. (a)
Predicted points of p
0
k+1
, p
1
k+1
and p
2
k+1
under d
k
= 1. (b) p
1
k+1
, l
1
k+1
and r
1
k+1
under d
k
= 1and j = 0.
Start
d
0
= d
∗
+2
k
= 0
Computing F
k+1
(j) for the three directions
in
d
k
− 1, d
k
, d
k
+1
Ye s
Ye s
Ye s
Ye s
No
No
No
No
End
F
k+1
(j) Tc
Computing F
k+1
(j)fortheseven
directions other than the opposite
direction of d
k
F
k+1
(j) Tc
Determining d
k+1
& w
k+1
k = k +1
w
k+1
being in the same
position as any of the previous
searched contour points or having gone
beyond image boundaries
d
0
= d
∗
+2
d
0
= d
∗
+6
Figure 8: Flow chart of the modified edge-following scheme.
3. Computational Analyses
In the following experiment, the LWOF, E-GVF snake,
watershed and proposed methods are adopted and compared
in processing time and segmentation accuracy. Among these
methods, LWOF is a supervised segmentation method, with
8 EURASIP Journal on Image and Video Processing
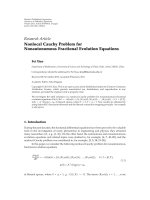
(a) (b) (c) (d) (e) (f)
Figure 9: Segmented results of the “bacteria” image. (a) Original image. (b) Result obtained by the LWOF method. (c) Result obtained by
the E-GVF snake method. (d) Result obtained by the watershed method with a threshold of 20. (e) Result obtained by the watershed method
with a threshold of 40. (f) Result obtained by the proposed method.
small circles indicating the positions selected by the user
for segmentation. The user can adequately select some
points close to an object to obtain a segmentation result
that is closest to that observed with naked eyes. However,
LWOF requires a very long computational time, and is
dependent on the user. Consequently, the processing time
of LWOF must include the manual operational time. The
segmentation function adopted by the watershed method is
gradient [9]. Additionally, the merging operation is based
on the region mean where the threshold indicates the
criterion of region merging. Here, two quantities, precision
and recall, are employed to evaluate the segmented results
from each segmentation method [34, 36]. Precision, P, is the
probability that a detected pixel is a true one. Recall, R, is the
probability that a true pixel is detected:
Precision(P)
=
True boundary pixels extracted
Total number of boundary pixels extracted
,
Recall(R)
=
True boundary pixels extracted
Total number of true boundary pixels
.
(10)
Additionally, the F-measure, F, with considering P and R is
adopted and defined as
F
=
PR
αR +(1− α)P
, (11)
where α is set to 0.5 in our simulations.
Figure 9(a) shows a 256
× 256-pixel “bacteria” image,
which includes about 20 bacteria objects that do not overlap
with each other. The shot was taken out of focus, causing
the image edges to be blurry, thus affecting some of
the segmented results. Figure 9(b) displays the result from
LWOF. LWOF takes a long time because it must perform
about 20 object selection operations. Figure 9(c) depicts
the result from the E-GVF snake method. Some groups
of connected neighboring bacteria objects are mistaken for
single objects. Figures 9(d) and 9(e) show the results from
utilizing the watershed method with thresholds of 20 and
40, respectively. Many erroneous borders are found when the
threshold is 20, with some single objects being segmented
into multiple smaller parts. While fewer erroneous contours
are found when the threshold is 40, some objects are still
missing. The number of missing objects increases with the
threshold. Contrasts in this picture are significantly reduced
owing to the unfocused image, making the threshold hard to
adjust. An excessively large threshold causes missing objects,
but a very small threshold would cause the background to
blur with the bacteria, which make it even more difficult to
segment. To do fair comparison, the watershed method is
iteratively conducted under different thresholds to yield the
best segmented results in the following analyses. Figure 9(f)
displays the results from the proposed method, which is not
affected by the out-of-focus image due to adequate initial
points attained, and thus can segment every bacteria object.
Figure 10(a) shows the 540
× 420-pixel “chessboard”
image, which is a 3D manmade image including a chessboard
and cylinders. The light effect is added in the picture,
reflecting shadows of the cylinders on the chessboard.
Figure 10(b) shows the ground truth from Figure 10(a).
TheresultfromLWOFisdepictedinFigure 10(c).Afairly
good result is obtained using the manual operation, but
a large number of initial points required means that the
computational time is very long. Figure 10(d) displays the
result from the E-GVF snake method, which is clearly not
appropriate for an image, with objects all very close to each
other. The simulation result indicates that contour of the
outermost layer is segmented, but that the squares inside
the chessboard cannot be detached from each other, leaving
the result with only one object. Figure 10(e) shows results
from using the watershed method at a threshold being
27 with the maximum F-measure. Figure 10(f) depicts the
result from the proposed method. The proposed method not
only can segment the two letters and the cylinders, it also
segments the chessboard itself better than does the watershed
method with the best threshold value. The segmentation of
the side surface in the chessboard is also far more accurate
than that generated from the watershed method. Ta ble 1
lists the segmentation results from the LWOF, E-GVF snake,
watershed at a threshold with the maximum F-measure, and
proposed methods. Objects from the picture include two
areas of cylinders, 24 areas of the chessboard’s top side, letters
“A” and “B”, and 10 areas of the chessboard’s front and right
sides, for a total of 36 close-looped independent areas. While
the supervised LWOF method has the highest F-measure,
it also requires a long time. Amongst the unsupervised
methods, the proposed method can segment the most
objects, and also has a significantly higher F-measure than
the E-GVF snake and watershed methods.
EURASIP Journal on Image and Video Processing 9
(a) (b) (c)
(d) (e) (f)
Figure 10: Segmented results of the “chessboard” image. (a) Original image. (b) Ground truth. (c) Result obtained by the LWOF method. (d)
Result obtained by the E-GVF snake method. (e) Result obtained by the watershed method with a threshold value of 27. (f) Result obtained
by the proposed method.
Table 1: Segmentation results of the LWOF, E-GVF, watershed and proposed methods.
Methods
Performance
Numbers of segmented objects F-measures Segmentation manners
LWOF 36 0.97 supervised
E-GVF 1 0.44 unsupervised
Watershed 29 0.86 unsupervised
Proposed 32 0.95 unsupervised
Figure 11 shows the 360
× 360-pixel “square” image
corrupted by the Gaussian noise, at the Signal-to-Noise
Ratio (SNR) of 18.87 dB. Figures 11(a) and 11(b) depict
the noisy image and ground truth, respectively. The result
from adopting the LWOF segmentation is displayed in
Figure 11(c). Not many points are selected manually since
the angles of turns are not very large. However, the contour
is not smooth due to the noise. Figure 11(d) shows the result
obtained by using the E-GVF snake method. Some dark
areas could be lost in the sharp corners. The result from
using the watershed method at a threshold being 45 with
the maximum F-measure is depicted in Figure 11(e).The
proposed method can eliminate the problem and obtain the
correct area as shown in Figure 11(f). Ta bl e 2 compares F-
measures and computational time of the four segmentation
methods at SNRs of 18.87 dB, 12.77 dB and 9.14 dB in which
the watershed method adopts thresholds of 42, 44, and 45,
respectively. By using the proposed method, the segmented
area has the highest F-measures in each of the three SNR
scenarios. The proposed method using the modified edge-
following technique is significantly faster than LWOF when
the manual operational time is considered. Additionally,
the proposed method provides comparable or even better
results than the LWOF. The results obtained by the watershed
method at thresholds with the maximum F-measures take
slightly lower processing time than the proposed method
when the threshold selection time is not counted in the
watershed method. The above experiments were conducted
by using C programs running on a Pentium IV 2.4 GHz CPU
under Windows XP operating system.
The above experimental results demonstrate that the
proposed method performs better than the other methods.
As for the blurry objects resulting from the out-of-focus
shot in Figure 9, the proposed method can accurately
segment all objects without incurring over-segmentation
and under-segmentation as does the watershed method
10 EURASIP Journal on Image and Video Processing
(a) (b) (c) (d) (e) (f)
Figure 11: Segmented results of the “square” image added by noises with the Gaussian distribution at SNR of 18.87 dB. (a) Noisy image.
(b) Ground truth. (c) Result obtained by the LWOF method. (d) Result obtained by the E-GVF snake method. (e) Result obtained by the
watershed method with a threshold of 45. (f) Result obtained by the proposed method.
Table 2: F-measures and computational time of the LWOF, snake, watershed and proposed methods.
Methods
Performance
SNR
= 18.87 dB SNR = 12.77 dB SNR = 9.14 dB
F-measures Processing time (sec) F-measures Processing time (sec) F-measures Processing time (sec)
LWOF 0.95 7.20
∗
0.86 10.60
∗
0.80 15.30
∗
E-GVF Snake 0.93 1.21 0.81 1.32 0.75 1.51
Watershed 0.94 0.26
∗∗
0.86 0.29
∗∗
0.81 0.31
∗∗
Proposed 0.96 0.31 0.88 0.32 0.82 0.34
Note: the symbol of “∗” indicates the processing time including manual operational time. Additionally, the symbol of “∗∗” denotes that the processing time
is calculated under a specific threshold where the iterative process under different thresholds is not included.
in Figures 9(d) and 9(e),respectively.Figure 10 reveals that
both the proposed and watershed methods demonstrate
the capability of fully segmenting objects inside another
object and overlapping objects but the E-GVF snake method
cannot be applied in these pictures. The proposed method
can segment more objects out of the image in Figure 10,
which contains many individual objects, than the watershed
method. In the simulation results shown in Figure 11,by
considering the gray-level changes of the left and right
neighboring points during the contour-searching process,
the proposed method not only reduces the noise interference,
it also outperforms both the E-GVF snake and watershed
methods against noise interference.
To do fair comparison, the data set and benchmarks
from the Computer Vision Group, University of California
at Berkeley were applied in the proposed and watershed
methods, where the watershed method is also iteratively
performed to search for the optimized threshold. Since the
E-GVF snake method is not suitable for the image with
objects inside another object, it is not addressed in this data
set. The segmentation results of the conventional methods
such as Brightness Gradient (BG), Texture Gradient (TG),
and Brightness/Texture Gradients (B/TG) are referred from
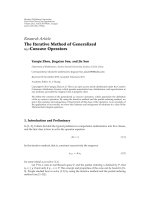
[34] for comparison. The precision-recall (P-R) curve shows
the inherent trade-off between P and R. Figure 12 depicts
the segmented results and the precision-recall curves from
Human, BG, TG, B/TG, watershed and proposed methods.
In Figures 12(c), 12(d), 12(e),and12(f), the BG, TG, B/TG
and watershed methods are iteratively conducted under
different thresholds to yield the best segmented results
with F of 0.87, 0.88, 0.88, and 0.83, respectively. In the
proposed method, the threshold is automatically determined
to be a specific value that only yields a converged point in
Figure 12(g), where the F-measure of 0.93 can be achieved.
Hence, the proposed method does not need the ground truth
to iteratively determine the best-matched thresholds and
thereby greatly reduces the computational time demanded by
the BG, TG, B/TG, and watershed methods.
The proposed method is applied to all test images, and its
segmentation results are evaluated according to the ground
truths. Particularly, six images from 100 test images are
added by the Gaussian noise to become noisy images at the
SNR of 18.87 dB. Figure 13 displays the segmented results of
original and noisy images using the proposed and watershed
methods, where F-measures and computational time are
listed in Tab le 3 .FromFigure 13, the segmented results from
the proposed method exhibit more apparent and complete
objects than those from the watershed method at specific
thresholds with the maximum F-measures. In Figures 13(a),
13(b), 13(c), 13(d), 13(e),and13(f), the watershed method
is conducted under thresholds of 23, 30, 7, 45, 16, and 32
to yield the best segmented results, respectively. Additionally,
P-R curves from proposed and watershed methods are
depicted. Moreover, the proposed method with thresholds
adapting to image contents has higher or equal F-measure
values than the watershed methods as illustrated in Ta b le 3 .
Regarding to computational time, the proposed method at
most cases takes slightly longer time than the watershed
method owing to additional threshold determination process
required by the proposed method when the iterative process
of determining the best threshold of the watershed method is
not included.
The histograms of F-measures from 100 test images by
using BG, TG, B/TG, and proposed method are shown in
EURASIP Journal on Image and Video Processing 11
(a)
0
0.25
0.5
0.75
1
Precision
00.25 0.50.75 1
Recall
Subjects
Image
3096 F
= 0.94
(b)
0
0.25
0.5
0.75
1
Precision
00.25 0.50.75 1
Recall
F
= 0.87 at (0.89,0.86)
3096 F
= 0.87
(c)
0
0.25
0.5
0.75
1
Precision
00.25 0.50.75 1
Recall
F
= 0.88 at (0.88,0.88)
3096 F
= 0.88
(d)
0
0.25
0.5
0.75
1
Precision
00.25 0.50.75 1
Recall
F
= 0.88 at (0.88,0.87)
3096 F
= 0.88
(e)
0
0.25
0.5
0.75
1
Precision
00.25 0.50.75 1
Recall
F
= 0.83 at (0.86,0.8)
3096 F
= 0.83
(f)
0
0.25
0.5
0.75
1
Precision
00.25 0.50.75 1
Recall
F
= 0.93 at (0.86,1)
3096 F
= 0.93
(g)
Figure 12: Segmented results and precision-recall curves of the 3096th image in the Berkeley segmentation data set. (a) Original image. (b)
Human. (c) Brightness gradient. (d) Texture gradient. (e) Brightness/texture gradients. (f) Watershed. (g) Proposed method.
Figure 14. Although the proposed method yields little poor
performance in few images under very low contrast, it still
has above 0.6 of F-measure for 70 test images. The number
of F-measures between 0.6 and 0.9 in the proposed method
is 68 larger than 64 in BG and 59 in TG, and smaller than
73 in B/TG while the number of F-measures between 0.9
and 1.0 in the proposed method is 2 better than none in
BG, TG, and B/TG. Restated, when the images have apparent
contours, the proposed method can yield segmented results
close to the ground truth done by humans. The proposed
method can effectively determine the main foreground and
is not trapped to the complex background. Hence, the values
of F in these cases under the proposed method can be
superior to those using the conventional methods. From
12 EURASIP Journal on Image and Video Processing
0
0.25
0.5
0.75
1
Precision
00.25 0.50.75 1
Recall
F
= 0.78 at (0.72,0.85)
78004 F
= 0.78
0
0.25
0.5
0.75
1
Precision
00.25 0.50.75 1
Recall
F
= 0.69 at (0.74,0.64)
78004 F
= 0.69
(a)
0
0.25
0.5
0.75
1
Precision
00.25 0.50.75 1
Recall
F
= 0.67 at (0.73,0.61)
21077 F
= 0.67
0
0.25
0.5
0.75
1
Precision
00.25 0.50.75 1
Recall
F
= 0.6at(0.69, 0.52)
21077 F
= 0.6
(b)
0
0.25
0.5
0.75
1
Precision
00.25 0.50.75 1
Recall
F
= 0.64 at (0.65,0.63)
210088 F
= 0.64
0
0.25
0.5
0.75
1
Precision
00.25 0.50.75 1
Recall
F
= 0.64 at (0.81,0.52)
210088 F
= 0.64
(c)
0
0.25
0.5
0.75
1
Precision
00.25 0.50.75 1
Recall
F
= 0.78 at (0.72,0.87)
300091 F
= 0.78
0
0.25
0.5
0.75
1
Precision
00.25 0.50.75 1
Recall
F
= 0.73 at (0.78,0.69)
300091 F
= 0.73
(d)
0
0.25
0.5
0.75
1
Precision
00.25 0.50.75 1
Recall
F
= 0.64 at (0.64,0.64)
271035 F
= 0.64
0
0.25
0.5
0.75
1
Precision
00.25 0.50.75 1
Recall
F
= 0.63 at (0.73,0.55)
271035 F
= 0.63
(e)
0
0.25
0.5
0.75
1
Precision
00.25 0.50.75 1
Recall
F
= 0.6at(0.72, 0.51)
219090 F
= 0.6
0
0.25
0.5
0.75
1
Precision
00.25 0.50.75 1
Recall
F
= 0.59 at (0.67,0.52)
219090 F
= 0.59
(f)
Figure 13: Original image, noisy image, segmented noisy image from the proposed method, segmented noisy image from the watershed
method at a threshold with the maximum F-measure, P-R curve by using the proposed method, P-R curvebyusingthewatershedmethod,
displaying from left to right in two rows. (a) 78004th image. (b) 21077th image. (c) 210088th image. (d) 300091st image. (e) 271035th image.
(f) 219090th image.
EURASIP Journal on Image and Video Processing 13
Table 3: F-measures and computational time of the noisy images conducted by the proposed and watershed methods.
Image indices
Performance
Proposed method Watershed
F-measures Processing time (sec) F-measures Processing time (sec)
78004 0.78 0.34 0.69 0.35
∗
21077 0.67 0.37 0.60 0.36
∗
210088 0.64 0.48 0.64 0.38
∗
300091 0.78 0.32 0.73 0.30
∗
271035 0.64 0.36 0.63 0.38
∗
219090 0.60 0.37 0.59 0.35
∗
Note: the symbol of “∗” denotes that the processing time is calculated under a specific threshold where the iterative process under different thresholds is not
included.
0
5
10
15
20
25
30
35
Frequency of F-measure
00.20.40.60.81
F-measure
(a)
0
5
10
15
20
25
30
35
40
45
Frequency of F-measure
00.20.40.60.81
F-measure
(b)
0
5
10
15
20
25
30
35
40
Frequency of F-measure
00.20.40.60.81
F-measure
(c)
0
5
10
15
20
25
30
35
Frequency of F-measure
00.20.40.60.81
F-measure
(d)
Figure 14: Histograms of F-measures from 100 test images. (a) BG. (b) TG. (c) B/TG. (d) Proposed method.
computational time point of view, the proposed method
that uses automatically determined thresholds to perform
image segmentation apparently takes the least time than the
conventional methods that are iteratively conducted under
different thresholds to converge their minima.
In practical applications, the ground truths are not
available. The conventional methods, BG, TG, and B/TG,
that need the ground truths to determine the best-matched
thresholds or parameters may not obtain good segmentation
results under no ground truth. However, the proposed robust
14 EURASIP Journal on Image and Video Processing
segmentation method does not need the ground truths and
iterative operations to determine the segmentation results,
and therefore is very suitable to various real-time image and
video segmentation applications under no ground truth.
4. Conclusion
This work proposes an automatically determined threshold
mechanism to perform a robust segmentation. Different
initial-point thresholds are determined and given to areas
with drastic and smooth changes in gray-level values. The
contour thresholds are generated by analyzing the decom-
posed blocks, thus preventing the search from falling into
the wrong path, and saving computational time. The contour
search process also considers the gradients of the left and
right neighboring points of every predicted contour point,
in order to lower the possibility of the method being affected
by the neighboring noise interferences. Additionally, most of
the searching process requires only the computation of the
gradients of three directions, thus minimizing the searching
time. The proposed method can perform segmentation on
objects inside another object and objects that are close to
each other, which the E-GVF snake method cannot perform.
The proposed method also solves problems encountered by
the watershed method, in which the results may change
significantly as the threshold values differ. The proposed
method can significantly reduce noise interference, which
easily affects the conventional edge-following method. In
handling blurry objects from an out-of-focus shot, the pro-
posed method can also segment the required objects. Finally,
the benchmark from Computer Vision Group, University of
California at Berkeley was conducted to demonstrate that the
proposed method could take the least computational time
to obtain robust and good segmentation performance than
the conventional ones. Therefore, the proposed method can
be widely and effectively employed in various segmentation
applications.
Acknowledgments
Valuable discussions with Professor Tsuhan Chen, Carnegie
Mellon University, Pittsburgh, USA is highly appreciated.
Additionally, the authors would like to thank the National
Science Council, Taiwan, for financially supporting this
research under Contract nos.: NSC 95-2221-E-270-015 and
NSC 95-2221-E-194-032. Professor W. N. Lie, National
Chung Cheng University, Chiayi, Taiwan is appreciated
for his valuable suggestion. Dr. C. H. Chuang, Institute
of Statistical Science, Academia Sinica, Taipei, Taiwan, is
thanked for kindly providing the software program of the
snake and watershed methods.
References
[1] D. Liu and T. Chen, “DISCOV: a framework for discovering
objects in video,” IEEE Transactions on Multimedia, vol. 10, no.
2, pp. 200–208, 2008.
[2]J.Pan,C.Gu,andM.T.Sun,“AnMPEG-4virtualvideo
conferencing system with robust video object segmentation,”
in Proceedings of Workshop and Exhibition on MPEG-4, pp. 45–
48, San Jose, Calif, USA, June 2001.
[3] J F. Yang, S S. Hao, P C. Chung, and C L. Huang, “Color
object segmentation with eigen-based fuzzy C-means,” in Pro-
ceedings of the IEEE International Symposium on Circuits and
Systems (ISCAS ’00), vol. 5, pp. 25–28, Geneva, Switzerland,
May 2000.
[4] S Y. Chien, Y W. Huang, B Y. Hsieh, S Y. Ma, and L
G. Chen, “Fast video segmentation algorithm with shadow
cancellation, global motion compensation, and adaptive
threshold techniques,” IEEE Transactions on Multimedia, vol.
6, no. 5, pp. 732–748, 2004.
[5] J.Y.Zhou,E.P.Ong,andC.C.Ko,“Videoobjectsegmentation
and tracking for content-based video coding,” in Proceedings
of IEEE International Conference on Multimedia and Expo
(ICME ’00), vol. 3, pp. 1555–1558, New York, NY, USA, July
2000.
[6] C C. Chiang, Y P. Hung, and G. C. Lee, “A learning
state-space model for image retrieval,” EURASIP Journal on
Advances in Signal Processing, vol. 2007, Article ID 83526, 10
pages, 2007.
[7] Y. B. Chen, O. T C. Chen, H. T. Chang, and J. T. Chien,
“An automatic medical-assistance diagnosis system applicable
on X-ray images,” in Proceedings of the 44th IEEE Midwest
Symposium on Circuits and Systems (MWSCAS ’01), vol. 2, pp.
910–914, Dayton, Ohio, USA, August 2001.
[8] R. Nock and F. Nielsen, “Semi-supervised statistical region
refinement for color image segmentation,” Pattern Recogni-
tion, vol. 38, no. 6, pp. 835–846, 2005.
[9] L. Vincent and P. Soille, “Watersheds in digital spaces: an
efficient algorithm based on immersion simulations,” IEEE
Transactions on Pattern Analysis and Machine Intelligence, vol.
13, no. 6, pp. 583–598, 1991.
[10] R. Adams and L. Bischof, “Seeded region growing,” IEEE
Transactions on Pattern Analysis and Machine Intelligence, vol.
16, no. 6, pp. 641–647, 1994.
[11] D. H. Kim, I. D. Yun, and S. U. Lee, “New MRF parameter
estimation technique for texture image segmentation using
hierarchical GMRF model based on random spatial inter-
action and mean field theory,” in Proceedings of the 18th
International Conference on Pattern Recognition (ICPR ’06),
vol. 2, pp. 365–368, Hong Kong, August 2006.
[12] J. Canny, “Computational approach to edge detection,” IEEE
Transactions on Pattern Analysis and Machine Intelligence, vol.
8, no. 6, pp. 679–698, 1986.
[13] I. Bogdanova, X. Bresson, J P. Thiran, and P. Vandergheynst,
“Scale space analysis and active contours for omnidirectional
images,” IEEE Transactions on Image Processing, vol. 16, no. 7,
pp. 1888–1901, 2007.
[14] I. Pitas, Digital Image Processing Schemes and Application,John
Wiley & Sons, New York, NY, USA, 2000.
[15]Y.B.ChenandO.T C.Chen,“Robustfully-automatic
segmentation based on modified edge-following technique,”
in Proceedings of IEEE Internat ional Conference on Acoustics,
Speech, and Signal Processing (ICASSP ’03), vol. 3, pp. 333–336,
Hong Kong, April 2003.
[16] M. Sonka, V. Hlavac, and R. Boyle, Image Processing, Analysis,
and Machine Vision, Brooks/Cole, New York, NY, USA, 2nd
edition, 1998.
[17] S Y. Chien, Y W. Huang, and L G. Chen, “Predictive water-
shed: a fast watershed algorithm for video segmentation,” IEEE
Transactions on Circuits and Systems for Video Technology, vol.
13, no. 5, pp. 453–461, 2003.
EURASIP Journal on Image and Video Processing 15
[18] C. J. Kuo, S. F. Odeh, and M. C. Huang, “Image segmentation
with improved watershed algorithm and its FPGA implemen-
tation,” in Proceedings of the IEEE International Symposium on
Circuits and Systems (ISCAS ’01), vol. 2, pp. 753–756, Sydney,
Australia, May 2001.
[19]V.Grau,A.U.J.Mewes,M.Alca
˜
niz, R. Kikinis, and S. K.
Warfield, “Improved watershed transform for medical image
segmentation using prior information,” IEEE Transactions on
Medical Imaging, vol. 23, no. 4, pp. 447–458, 2004.
[20] Y. Hu and T. Nagao, “A matching method based on marker-
controlled watershed segmentation,” in Proceedings of the
International Conference on Image Processing (ICIP ’04), vol.
1, pp. 283–286, Singapore, October 2004.
[21] P. Salembier and L. Garrido, “Binary partition tree as an effi-
cient representation for image processing, segmentation, and
information retrieval,” IEEE Transactions on Image Processing,
vol. 9, no. 4, pp. 561–576, 2000.
[22] H. Lu, J. C. Woods, and M. Ghanbari, “Binary partition tree
for semantic object extraction and image segmentation,” IEEE
Transactions on Circuits and Systems for Video Technology, vol.
17, no. 3, pp. 378–383, 2007.
[23] A. X. Falcao, J. K. Udupa, and F. K. Miyazawa, “An ultra-fast
user-steered image segmentation paradigm: live wire on the
fly,” IEEE Transactions on Medical Imaging,vol.19,no.1,pp.
55–62, 2000.
[24] M. Kass, A. Witkin, and D. Terzopoulos, “Snakes: active
contour models,” International Journal of Computer Vision,
vol. 1, no. 4, pp. 321–331, 1988.
[25] S. X. Yu, “Segmentation using multiscale cues,” in Proceedings
of IEEE Computer Society Conference on Computer Vision
and Pattern Recognition (CVPR ’04), vol. 1, pp. 247–254,
Washington, DC, USA, June-July 2004.
[26] N. Paragios and R. Deriche, “Geodesic active contours and
level sets for the detection and tracking of moving objects,”
IEEE Transactions on Pattern Analysis and Machine Intelligence,
vol. 22, no. 3, pp. 266–280, 2000.
[27] D. P. Mukherjee, N. Ray, and S. T. Acton, “Level set analysis for
leukocyte detection and tracking,” IEEE Transactions on Image
Processing, vol. 13, no. 4, pp. 562–572, 2004.
[28] C H. Chuang and W N. Lie, “A downstream algorithm
based on extended gradient vector flow field for object
segmentation,” IEEE Transactions on Image Processing, vol. 13,
no. 10, pp. 1379–1392, 2004.
[29] B G. Kim and D J. Park, “Novel noncontrast-based edge
descriptor for image segmentation,” IEEE Transactions on
Circuits and Systems for Video Technology, vol. 16, no. 9, pp.
1086–1095, 2006.
[30] H. Gao, W C. Siu, and C H. Hou, “Improved techniques for
automatic image segmentation,” IEEE Transactions on Circuits
and Systems for Video Technology, vol. 11, no. 12, pp. 1273–
1280, 2001.
[31] Y. B. Chen and O. T C. Chen, “Semi-automatic image seg-
mentation using dynamic direction prediction,” in Proceedings
of the IEEE International Conference on Acoustics, Speech, and
Signal Processing (ICASSP ’02), vol. 4, pp. 3369–3372, Orlando,
Fla, USA, May 2002.
[32] J. Tierny, J P. Vandeborre, and M. Daoudi, “Topology driven
3D mesh hierarchical segmentation,” in Proceedings IEEE
International Conference on Shape Modeling and Applications
(SMI ’07), pp. 215–220, Lyon, France, June 2007.
[33] J. R. Smith and S F. Chang, “Quad-tree segmentation for
texture-based image query,” in Proceedings of the 2nd Annual
ACM Multimedia Conference, pp. 279–286, San Francisco,
Calif, USA, October 1994.
[34] D. Martin, C. Fowlkes, D. Tal, and J. Malik, “A database
of human segmented natural images and its application to
evaluating segmentation algorithms and measuring ecological
statistics,” in Proceedings of the 8th IEEE International Con-
ference on Computer Vision, vol. 2, pp. 416–423, Vancouver,
Canada, July 2001.
[35] T. W. Ridler and S. Calvard, “Picture thresholding using an
iterative selection method,” IEEE Transactions on Systems,
Man, and Cybernetics, vol. 8, no. 8, pp. 630–632, 1978.
[36] C. van Rijsbergen, Information Retrieval,Departmentof
Computer Science, University of Glasgow, Glasgow, UK, 2nd
edition, 1979.