Báo cáo hóa học: "Research Article Robust and Computationally Efficient Signal-Dependent Method for Joint DOA and Frequency Estimation" docx
Bạn đang xem bản rút gọn của tài liệu. Xem và tải ngay bản đầy đủ của tài liệu tại đây (1.17 MB, 16 trang )
Hindawi Publishing Corporation
EURASIP Journal on Advances in Signal Processing
Volume 2008, Article ID 134853, 16 pages
doi:10.1155/2008/134853
Research Article
Robust and Computationally Efficient Signal-Dependent
Method for Joint DOA and Frequency Estimation
Ting Shu and Xingzhao Liu
Department of Electronic Engineering, Shanghai Jiao Tong University, Shanghai, 200240, China
Correspondence should be addressed to Ting Shu,
Received 17 September 2007; Revised 29 January 2008; Accepted 12 April 2008
Recommended by Fulvio Gini
The problem of joint direction of arrival (DOA) and frequency estimation is considered in this paper. A new method is proposed
based on the signal-dependent multistage wiener filter (MWF). Compared with the classical subspace-based joint DOA and
frequency estimators, the proposed method has two major advantages: (1) it provides a robust performance in the presence of
colored noise; (2) it does not involve the estimation of covariance matrix and its eigendecomposition, and thus, yields much lower
computational complexity. These advantages can potentially make the proposed method more feasible in practical applications.
The conditional Cram
´
er-Rao lower bound (CRB) on the error variance for joint DOA and frequency estimation is also derived.
Both numerical and experimental results are used to demonstrate the performance of the proposed method.
Copyright © 2008 T. Shu and X. Liu. This is an open access article distributed under the Creative Commons Attribution License,
which permits unrestricted use, distribution, and reproduction in any medium, provided the original work is properly cited.
1. INTRODUCTION
The problem of simultaneously estimating the spatial and
temporal frequencies of multiple narrowband plane waves
has received considerable attention in the past few decades
[1–10]. This problem is crucial in many practical appli-
cations, such as array processing, joint angle and Doppler
estimation for space-time adaptive processing (STAP) air-
borne radar, synthetic aperture radar (SAR) imaging, and
some electronic warfare and sonar systems. See [2, 5, 6, 9]
for a detailed description, [1, 3, 7, 8] for some of the
earlier work, and [9, 10] for some of more recent work.
The joint estimation has a number of advantages. First,
as shown in Section 2.1, the number of sources can be
significantly larger than the number of antennas by using the
spatiotemporal data model. Second, in the spatiotemporal
data model, multiple sources with the same DOA can be
resolved (see Property 2 in Section 2.1, Figure 5 in Example 1
and Figure 6 in Example 2). Finally, the estimation accuracy
can be improved (see Figures 6 and 7 in Example 2, Figure 14
in Section 3.2).
Although the well-known maximum likelihood ap-
proaches (see, e.g., [1, 2] and the references therein) can pro-
vide optimum parameter estimation in the presence of white
Gaussian noise, they are perceived to be too computationally
complex. Based on the subspace techniques, a number
of suboptimal algorithms have been developed, such as
multiple signal classification (MUSIC) [11] and estimation
of signal parameters via rotational invariance technique
(ESPRIT) [12]. Some of these suboptimal algorithms have
been used to solve the problem of joint direction of arrival
(DOA) and frequency estimation [3–10]. For example,
Zoltowski and Mathews [7] have discussed this problem in
the electronic warfare applications. To cover a very wide
frequency band (2–18 GHz), a nonuniform linear array is
used to resolve the angular ambiguity. Their methods are
mainly motivated by engineering considerations. Haardt and
Nossek [8] have proposed a method for joint 2D angle and
frequency estimation based on the Unitary-ESPRIT in the
space-division multiple access (SDMA) applications. Viberg
and Stocia [6] have presented a prewhitened subspace-
based method for joint DOA and frequency estimation in
the colored noise. Another ESPRIT-based method called
joint angle-frequency estimation (JAFE) has been proposed
by Lemma et al. in [4], and it has been considered as
the state-of-the-art among suboptimal joint DOA-frequency
estimators. The recent work of Lin et al. [9]hasproposed
a frequency-space-frequency (FSF) MUSIC-based algorithm
in wireless communication applications. It is a tree-structure
method which can provide a comparable performance to
2 EURASIP Journal on Advances in Signal Processing
the JAFE. Another recent work of Belkacemi and Marcos
[10] has discussed the problem of joint angle-Doppler
estimation in the presence of impulsive noise and clutter
in the airborne radar applications. This method models
the impulsive noise and clutter as the so-called symmet-
ric α-stable (SαS) process, and a preprocessing technique
called phased fractional lower-order moment (PFLOM) is
used before applying the 2-D MUSIC [3] to estimate the
angle and Doppler. Generally speaking, these algorithms
are known to have high-resolution capabilities and yield
accurate estimates. However, there are two major drawbacks
in practical applications. First, most existing techniques are
under the additive white Gaussian noise assumption [3–5, 7–
9]. Unfortunately, in practice, the noise is often spatially cor-
related. As a consequence, the colored noise may degrade the
performance of these algorithms significantly. In addition, if
the noise covariance matrix is known, the spatially colored
noise can be prewhitened [6, 11]. In practice, the noise
covariance is often measured experimentally from the signal-
free data. However, such signal-free data is often unavailable.
Thus, accurate parameter estimation is impossible without
good priori knowledge of the colored noise. Secondly, due
to the eigendecomposition of the sample covariance matrix
or the singular value decomposition (SVD) of the data
matrix, the computational burden is often prohibitively
extensive in the case of large antenna array systems and
multidimensional applications (e.g., array radar systems)
where the model order is large. Therefore, for practical
considerations, robustness and computational efficiency are
always of great importance.
On the other hand, the problem of parameter estimation
with a priori knowledge, such as the waveform of the desired
signal and the steering vector of the array (or the main
beam pattern of the antenna), has been well studied. Li and
Compton Jr. [13]andLietal.[14] have proposed algorithms
for DOA estimation with known waveforms. Later, Wax
and Leshem [15] and Swindlehurst et al. [16, 17]have
discussed the problem of joint parameters estimation with
known waveforms, respectively. Recently, Gini et al. [18]have
proposed a method of multiple radar targets estimation by
exploiting the knowledge of the antenna main beam pattern
and induced amplitude modulation. A discussion of their
applications to active radar systems, mobile communica-
tion systems, ALOHA packet radio systems, and explosive
detectioncanbefoundin[13–20]. It is demonstrated
that exploiting temporal information about the signal can
improve the performance of DOA estimation [13, 14, 20].
In this paper, we will show that one cannot only improve the
robustness of algorithm but also reduce the computational
complexity by using a priori knowledge of one desired signal.
The main contribution of this paper can be briefly stated
as follows: applying the signal-dependent multistage Wiener
filter (MWF) technique [21]soastoaccuratelydetermine
the signal subspace even when the noise background is both
spatially and temporally colored. The MWF is a reduced-
rank adaptive filtering technique that has been used in
the application of reduced-rank STAP for airborne radar
[22] and the suppression of multiple-access interference for
mobile communication [23]. In this paper, we introduce
it to joint DOA and frequency estimation. The motivation
of applying the MWF lies in its inherent robustness to
eigenspectrum spreading (referred to as the subspace leak-
age problem [24]). (Eigenspectrum spreading refers to an
increase in the number of interference eigenvalues of the
covariance matrix due to a multitude of real-world effects. In
practice, eigenspectrum spreading is always present particu-
larly in the colored noise environment.) Moreover, by using
the MWF, the proposed method does not need the estimation
of the covariance matrix and its eigendecomposition, and
hence, it is more computationally efficient than the classical
subspace-based methods. Before presenting the numerical
results, the conditional Cram
´
er-Rao lower bound (CRB) on
the parameter estimation is derived. Our new expressions
of CRB can be viewed as an extension of the well-known
results of Stoica et al. Then, the performance of the proposed
method is demonstrated by using both numerical and
experimental examples.
The remainder of this paper is organized as follows.
In Section 2, first we describe the data model and some
necessary preliminaries. Then, the proposed method and the
conditional CRB on the parameter estimation are presented.
Section 3 shows numerical and experimental results, and
Section 4 concludes the paper.
The following notations are used throughout this paper.
Superscripts (
·)
T
,(·)
∗
,(·)
H
,(·)
#
, ⊗,and denote the
operation of transpose, complex conjugate, complex conju-
gate transpose, pseudoinverse, the Kronecker product and
the Hardamard product, respectively. The notation diag[a]
denotes a diagonal matrix with its diagonal elements formed
by vector a. The notation
a denotes the Euclidian norm
of vector a. The notation
A
F
denotes the Frobenius norm
of matrix A. The notation ∠(
·) denotes the phase angle. The
notation E[
·] denotes the expectation of a random variable.
P
Δ
= Δ(Δ
H
Δ)
−1
Δ
H
and P
⊥
Δ
= I−P
Δ
stand for the orthogonal
projection matrices onto the space of Δ and its orthogonal
complement.
2. PROBLEM FORMULATION
2.1. Data model
Consider a uniform linear array (ULA) with M elements.
Impingings on the array are P narrowband plane waves,
which indicates that the effect of a time delay on the received
waveform is a phase shift. Let ω
c
be the center frequency
of the band of interest, and suppose that the ith (i
=
1, 2, , P) source comes from a direction of θ
i
. Thus, after
demodulation to baseband or intermediate frequency (IF),
the output of ULA at time t can be written as
x(t)
=
P
i=1
a
θ
i
α
i
p
i
(t)e
jω
i
t
+ n(t), t = 0, 1, ,N − 1,
(1)
where ω
i
, p
i
(t), and α
i
denote the baseband frequency after
sampling, the waveform, and the complex amplitude of the
ith source, respectively. a(θ
i
) is the M × 1 spatial steering
vector of the array toward direction θ
i
and n(t) is the M × 1
T. Shu and X. Liu 3
Figure 1: Data stacking technique (K = 5).
noise vector. For ULA, the spatial steering vector a(θ
i
) has the
form
a(θ
i
) =
1, e
j2πdsin θ
i
/λ
i
, , e
j2π(M−1)d sin θ
i
/λ
i
T
,(2)
where d and λ
i
are the interelement spacing and the
wavelength of the ith source, respectively.
Next, we define the M
×P steering matrix (referred to as
the array manifold) A, the P
× 1 signal vector s(t), and the
P
×P diagonal matrix Φ as
A
=
a
θ
1
, , a
θ
P
,
s(t)
=
α
1
p
1
(t), , α
P
p
P
(t)
T
,
Φ
= diag
e
jω
1
, , e
jω
P
.
(3)
Note that Φ is the diagonal matrix only containing informa-
tion about the temporal frequency ω
i
. Then, the array output
can be expressed as
x(t)
= AΦ
t
s(t)+n(t). (4)
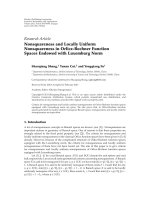
After that, we use the data stacking technique (referred to
as temporal smoothing [5]) to create the spatiotemporal data
matrix (see Figure 1). By stacking K (referred to as temporal
smoothing factor) temporal shifted versions of the original
array output matrix, we have the following MK
×(N −K +1)
spatiotemporal data matrix:
X
K
=
⎡
⎢
⎢
⎢
⎢
⎢
⎢
⎢
⎢
⎣
A
s(0) Φs(1) ··· Φ
N−K
s(N −K)
AΦ
s(1) Φs(2) ··· Φ
N−K
s(N −K +1)
.
.
.
AΦ
K−1
s(K −1) Φs(K) ··· Φ
N−K
s(N −1)
⎤
⎥
⎥
⎥
⎥
⎥
⎥
⎥
⎥
⎦
+N
K
,
(5)
where N
K
is the MK×(N −K +1) temporally smoothed noise
matrix which has the same form of X
K
. With the narrowband
assumption, we have s(t)
≈ s(t +1)≈ ··· ≈ s(t + K − 1).
Then, the spatiotemporal data matrix in (5) can be expressed
as follows:
X
K
=
⎡
⎢
⎢
⎢
⎢
⎣
A
AΦ
.
.
.
AΦ
K−1
⎤
⎥
⎥
⎥
⎥
⎦
s(0) Φs(1) ··· Φ
N−K
s(N −K)
+ N
K
= ΩS
K
+ N
K
,
(6)
where S
K
is the P × (N − K + 1) matrix, and Ω =
[A
T
,(AΦ)
T
, ,(AΦ
K−1
)
T
]
T
is the MK ×P matrix (referred
to as the spatiotemporal manifold) whose range space plays
the role of spatiotemporal signal subspace. It fact, the
spatiotemporal data can be obtained without performing
the data stacking in some applications (see the discussion in
Section 2.2), then, (6) can be rewritten in a form of snapshot
vector
X
K
(t) = ΩΦ
t
s(t)+N
K
(t), t = 0, 1, ,N − 1. (7)
Property 1. Let b(ω
i
) = [1, e
jω
i
, , e
j(K−1)ω
i
]
T
denote the
K
× 1 temporal steering vector. Then, Ω can be expressed
as Ω
= [Ξ(θ
1
, ω
1
), Ξ(θ
2
, ω
2
), , Ξ(θ
P
, ω
P
)], where
Ξ(θ
i
, ω
i
) = b(ω
i
) ⊗a(θ
i
)(8)
is the MK
× 1 spatiotemporal steering vector. This property
is useful in the CRB analysis in Section 3.
Proof. See Appendix A.
4 EURASIP Journal on Advances in Signal Processing
Space-time array
Antenna
T
K pulses
T
···
M elements
···
T
K pulses
···
T
PRI
delay
I & Q down conversion and A/D
Space-time data cube
N range bins
M elements
K pulses
Fast time
Slow time
Figure 2: Space-time array radar data cube generation.
Friendly
emitters
Hostile
emitters
Space-time receiver
z
−1
z
−1
z
−1
.
.
.
.
.
.
Processor
Characteristics of
theactiveemitters
Figure 3: Space-time receiver architecture of the advanced ESM systems.
Property 2. With K-factor temporally smoothed data, up to
K sources having the same DOA, can be solved in this data
model.
Proof. See [5, Appendix A]
Some assumptions associated with models (1)and(7)are
as follows.
Assumption 1. The signals are unknown deterministic and
uncorrelated with each other. Without loss of generality, we
assume that p
1
(t) is the received waveform of the desired
signal. We also assume that the transmitted waveform p
0
(t)
of the desired signal is known a priori.
Assumption 2. The noise is circularly symmetric zero-mean
Gaussian with variance σ
2
. Both white noise and colored
noise are considered in this paper. In the case of spatially
and temporally white noise, the noise covariance matrix is
Q
= σ
2
I,whereI is the identity matrix.
Assumption 3. The number of sources P is assumed to be
known or has been estimated (see [25]onhowtoestimate
the sources number P from the input date X
K
(t)).
Assumption 4. MK
≥ P, and the spatiotemporal manifold
Ω is unambiguous so that the spatiotemporal steering
vectors Ξ(θ
1
, ω
1
)andΞ(θ
2
, ω
2
)(θ
1
/
=θ
2
, ω
1
/
=ω
2
) are linearly
independent. On the other hand, MK is the upper bound on
the number of sources that can be resolved in this data model
whenever θ
1
/
=θ
2
and ω
1
/
=ω
2
.
Assumption 5. Let f
s
be the sample rate, it is assumed that
f
s
is large enough to the bandwidth of each narrowband
source. To avoid aliasing, it is also required that
−f
s
/2 <f
i
≤
f
s
/2, where f
i
= f
s
ω
i
/(2π) is the baseband frequency before
sampling.
2.2. Some applications
It is instructive to describe some applications where the data
model and assumptions outlined above are relevant.
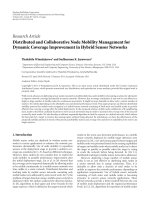
The first application where our data model and assump-
tions are reasonable is active array radar system [26]. In radar
applications, a known waveform p
0
(t) is transmitted, and
the received signal reflected from each target is just a scaled,
time-delayed, and Doppler-shifted version of the transmitted
signal. More specifically, consider a space-time array shown
in Figure 2. The radar transmits a coherent train of K pulses
with the pulse repetition interval (PRI) T in one coherent
processing interval (CPI), and the target return collected by
the space-time array with M elements is an M
×K ×N data
cube, where N is the number of snapshots (range bins). After
I/Q down-conversion, each MK
× 1 snapshot vector has the
form of (7).
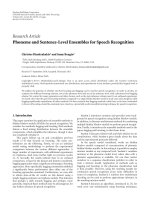
The second application where our data model and
assumptions hold true is the electronic support measures
(ESM) signal processing [27, 28]. The ESM systems perform
the functions of threat detection and area surveillance. They
use the passive antenna arrays to intercept the radar signal
and determine the characteristics (e.g., radio frequency (RF),
DOA, time of arrival (TOA), pulse width (PW), PRI, etc.) of
the active emitters in a given area (see Figure 3). Moreover,
advanced knowledge-based EMS systems also make full use
of the priori information (e.g., the characteristics of friendly
and enemy emitters) to enhance the performance. In this
T. Shu and X. Liu 5
Initialization: c
0
(t) = p
0
(t), Y
0
(t) = X
K
(t)
Forward Recursion:Fori
= 1, 2, , D:
h
i
= E[c
∗
i−1
(t)Y
i−1
(t)]/E[c
∗
i−1
(t)Y
i−1
(t)]
c
i
(t) = h
H
i
Y
i−1
(t)
B
i
= null{h
i
}
Y
i
(t) = B
i
Y
i−1
(t)
Backward Recursion:Fori
= D, D −1, ,1withe
D
(t) = c
D
(t):
w
i
= E[c
∗
i−1
(t)e
i
(t)]/E[|e
i
(t)|
2
]
e
i−1
(t) = c
i−1
(t) − w
∗
i
e
i
(t)
Algorithm 1: MWF algorithm [21].
Initialization: c
0
(t) = p
0
(t), Y
0
(t) = X
K
(t)
Forward Recursion:Fori
= 1, 2, , D:
h
i
= E[c
∗
i−1
(t)Y
i−1
(t)]/E[c
∗
i−1
(t)Y
i−1
(t)]
c
i
(t) = h
H
i
Y
i−1
(t)
Y
i
(t) = Y
i−1
(t) − h
i
c
i
(t)
Backward Recursion:Fori
= D, D −1, ,1withe
D
(t) = c
D
(t):
w
i
= E[c
∗
i−1
(t)e
i
(t)]/E[|e
i
(t)|
2
]
e
i−1
(t) = c
i−1
(t) − w
∗
i
e
i
(t)
Algorithm 2: CSS-MWF algorithm [29].
application, the data stacking technique must be performed
to create the spatiotemporal data.
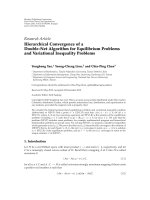
2.3. Multistage Wiener filter (MWF)
In this section, we briefly review the MWF and its implemen-
tation using the correlation subtractive structure (CSS).
The MWF was developed by Goldstein et al. [21]based
on orthogonal projections. A block diagram showing the
structure of MWF is depicted in Figure 4. It is a multistage
representation of the minimum mean-square error (MMSE)
Wiener filer that generates a signal-dependent basis in a
stage-by-stage structure. At every stage i
= 1, 2, , D of the
decomposition, two orthogonal subspaces are formed: one
in the direction of the MK
× 1 correlation vector h
i
,and
the other orthogonal to h
i
. A blocking matrix B
i
= null{h
i
}
is also formed to perform the projection onto the subspace
orthogonal to h
i
. It is clear that the scalar output c
i+1
(t)in
the direction of h
i
serves as the desired signal for the next
stage while the vector output Y
i+1
(t) orthogonal to h
i
is the
input vector of the next stage. The standard MWF algorithm
is presented in Algorithm 1.
Note that the requirement for the blocking matrix B
i
is
B
i
h
i
= 0. (9)
Hence, the choice of B
i
affects the computational complexity.
To make the construction of B
i
simple, an efficient imple-
mentation of the MWF algorithm is proposed based on CSS
[29]. First, the blocking matrix B
i
is given by
B
i
= I −h
i
h
H
i
. (10)
Then, the input vector Y
i
(t) for the (i+1)th stage is calculated
as follows:
Y
i
(t) = B
i
Y
i−1
(t) =
I −h
i
h
H
i
Y
i−1
(t) = Y
i−1
(t) −h
i
c
i
(t).
(11)
The CSS-MWF algorithm is summarized in Algorithm 2.
From Algorithm 2, it is clear that CSS-MWF avoids the
formation of blocking matrices, and thus, yields much lower
computational complexity.
The MWF has the following properties.
(1) Let T
D
= [h
1
, h
2
, , h
D
], where D is the order of
filter (in this paper, D
= MK), it has been shown
in [21, 23] that the columns in T
D
are mutually
orthogonal and each h
i
(i = 1, 2, , D) is contained
in the signal subspace.
(2) It is shown in [23] that the first P orthogonal vectors
span the signal subspace, and P stages are required to
form the full rank MMSE filter, where P (P<D)is
the number of sources.
6 EURASIP Journal on Advances in Signal Processing
d
0
(t)
Y
0
(t)
h
1
B
1
Y
1
(t)
h
2
B
2
h
3
B
3
Y
2
(t)
Y
3
(t)
Y
D−2
(t)
h
D−1
B
D−1
Y
D−1
(t)
h
D
d
D−1
(t)
e
D
(t)
+
+
−
w
D
e
D−1
(t)
w
D−1
d
3
(t)+
−
+ w
3
e
3
(t)
+
d
2
(t)+
−
e
2
(t)
d
1
(t)+
−
e
1
(t)
+
w
2
w
1
e
0
(t)
+
−
+
.
.
.
.
.
.
.
.
.
Figure 4: Multistage Wiener filter.
2.4. Proposed method
Let
Ω = [h
1
, h
2
, , h
P
] denote the matrix of the first P basis
vectors of the MWF. In the case of high signal-to-noise ratio
(SNR) or large snapshots number N,wehave
Ω ≈ ΩH, (12)
where H is a P
× P nonsingular matrix. Moreover,
Ω is
consistent in the sense that lim
N→∞
Ω = ΩH. This implies
that the corresponding transformed matrices for A and Φ
can be expressed as
A
T
= AH,
(13)
Φ
T
= H
−1
ΦH,
(14)
and they can be estimated as follows:
A
T
=
Ω
1:1
,
Φ
T
=
Ω
#
1:K
−1
Ω
2:K
,
(15)
where
Ω
k:l
denotes the block rows from k through l.
Since (14) is a similarity transformation, Φ
T
and Φ have
the same eigenvalues e
jω
i
(i = 1,2, , P) in the noise-free
case. By performing the eigendecomposition
Φ
T
= UΛU
−1
(Λ = diag[ξ
1
, ξ
2
, , ξ
P
]), we obtain the eigenvalues of
Φ
T
,namely,ξ
i
(i = 1, 2, , P). Therefore, the frequency
estimates are given by
ω
i
= ∠ξ
i
, i = 1, 2, , P. (16)
On the other hand, since U diagonalizes
Φ
T
,itprovides
an estimation of H
−1
in (14). Therefore, the steering matrix
A can be estimated as
A =
A
T
U. Letting a
i
denote the ith
column of
A, for large N,wehavea
i
∝ a(θ
i
). Since the
steering matrix A for the ULA is a Vandermonde matrix,in
the noise-free case, we obtain
a
i
(2)
a
i
(1)
=
a
i
(3)
a
i
(2)
=···=
a
i
(M)
a
i
(M −1)
= e
j2π(d sin
θ
i
/λ
i
)
,
i
= 1, 2, , P.
(17)
Then, we can derive the DOA estimates from (17)as
θ
i
=
1
M −1
M
l=2
sin
−1
λ
i
2πd
∠
a
i
(l)
a
i
(l −1)
, i = 1, 2, , P,
(18)
where
λ
i
can be calculated by using the frequency estimates
ω
i
in (16) and the center frequency of the band of interest ω
c
.
The idea of DOA estimation is similar to the method
of [6] (referred to as the Viberg-Stoica method) which
avoids the operation of joint diagonalization in [4, 5], but
we give the closed form of DOA estimates. From (16)and
(18), it is clear that
ω
i
and
θ
i
are one-to-one related to
the ith eigenvalue and the ith eigenvector, respectively. In
other words, the frequency and DOA estimates are paired
automatically.
The proposed method is summarized in the following
steps.
S1: Estimate the signal subspace
Ω by performing the
forward recursion of the rank P MWF, where P is the
number of sources.
S2: Estimate the transformed matrices for A and Φ from
(15).
S3: Perform the eigendecomposition
Φ
T
= UΛU
−1
,and
obtain the eigenvalues of
Φ
T
. Then, estimate the
frequencies from (16).
S4: Estimate the steering matrix A as
A =
A
T
U.Then,
the DOAs can be estimated from (18).
T. Shu and X. Liu 7
After obtaining the estimates of DOA/frequency pairs
(
θ
i
, ω
i
)(i = 1, 2, ,P), we can use the known transmitted
waveform p
0
(t) to extract the desired signal DOA/frequency
pair by using the cross correlation method in [13].
Remarks
(1) In STAP airborne radar application, it is shown in
[22] that the MWF cannot only achieve a substan-
tially higher compression of the interference sub-
space than the classical subspace-based techniques
(e.g., principle components (PC) method and cross-
spectral metric (CSM) method) in both hot and cold
clutter environment, but also provide robustness to
eigenspectrum spreading or subspace leakage of the
interference subspace. Thus, it has the potential for
making the proposed method more feasible in the
presence of colored noise.
(2) It is very important to notice that the CSS-MWF
algorithm only involves complex matrix-vector prod-
ucts, and requires the computationally complexity
of O(MKN) floating-point operations per second
(flops) at each stage [29]. Therefore, the complexity
of O(PMKN)flopsisrequiredtoestimatethe
signal subspace
Ω of rank P by performing the
forward recursion of the MWF. In contrast to the
classical subspace-based methods of [3, 4, 6]which
require O((MK)
2
N)+O(M
3
K
3
) flops in estimating
the covariance matrix and calculating the eigen-
decomposition, the proposed method shows low-
complexity capability.
2.5. Cram
´
er-Rao bound
Although the complete statistical analysis of the estimation
algorithm is not the scope of this paper, it is still useful to
present the CRB that indicates the performance limit of any
unbiased estimator.
In the literature, a large number of researchers have
studied the conditional and unconditional CRB for DOA
estimation (see, e.g., [30–33] and the references therein). In
this section, we derive the expression of the CRB for joint
DOA and frequency estimation. The new expressions of CRB
can be viewed as an extension of the well-known results of
Stoica and Nehorai [30]. Since the signals are assumed to
be unknown deterministic, we only consider the conditional
CRB.
For simplicity, we rewrite the data model (7)as
X
K
(t) = Ωg(t)+N
K
(t), t = 0, 1, ,N − 1, (19)
where g(t)
= Φ
t
s(t) = [
g
1
(t) g
2
(t) ··· g
P
(t)
]
T
.
Theorem 1. Under the assumptions in Section 2.1,thecondi-
tional CRB for joint DOA and frequency estimation in white
noisecanbeexpressedas
CRB(θ, ω)
=
σ
2
2
N
t=1
Re
Z
H
(t)D
H
P
⊥
Ω
DZ(t)
−1
, (20)
where
Z(t)
=
⎡
⎣
G(t)0
0 G(t)
⎤
⎦
,
G(t)
= diag
g
1
(t) g
2
(t) ··· g
P
(t)
,
D
=
D
θ
D
ω
,
D
θ
=
d
θ
θ
1
, ω
1
d
θ
θ
2
, ω
2
··· d
θ
θ
P
, ω
P
,
D
ω
=
d
ω
θ
1
, ω
1
d
ω
θ
2
, ω
2
··· d
ω
θ
P
, ω
P
,
d
θ
θ
i
, ω
i
=
∂Ξ(θ, ω)
∂θ
θ=θ
i
,ω=ω
i
,
d
ω
θ
i
, ω
i
=
∂Ξ(θ, ω)
∂ω
θ=θ
i
,ω=ω
i
,
P
⊥
Ω
= I −Ω
Ω
H
Ω
−1
Ω
H
.
(21)
Proof. See Appendix B.
Theorem 2. For large N, the asymptotic conditional CRB for
joint DOA and frequency estimation in white noise can be
expressed as
CRB(θ, ω)
≈
σ
2
2N
Re
D
H
P
⊥
Ω
D
R
T
−1
, (22)
where
R
=
R
g
R
g
R
g
R
g
, R
g
= lim
N→∞
1
N
N
t=1
g(t)g
H
(t).
(23)
Proof. See Appendix C.
The asymptotic CRB for DOA estimation in the colored
noise is derived in [34]. By extending the results of [34], we
may obtain the expression of the condition CRB for joint
DOA and frequency estimation in the colored noise.
Theorem 3. The asymptotic conditional CRB for j oint DOA
and frequency estimation in colored noise can be expressed as
CRB(θ, ω)
≈
σ
2
2N
Re
D
H
Q
−1
P
⊥
Ω
D
R
T
−1
, (24)
where P
⊥
Ω
= I −Ω(Ω
H
Q
−1
Ω)
−1
Ω
H
Q
−1
. The nois e covariance
matrix Q is no longer a diagonal matrix in the case of colored
noise.
3. SIMULATION AND EXPERIMENTAL RESULTS
In this section, we present simulation and experimental
examples showing the performance of the proposed method.
The situation in which there is one desired signal with known
transmitted waveform p
0
(t) in the presence of interfering
signalsisconsidered.
8 EURASIP Journal on Advances in Signal Processing
Table 1: Comparisons of the computational complexity of various algorithms.
Algorithms Main computational complexity
JAFE High-dimensional SVD: O((MK)
2
N)+O(M
3
K
3
)+twolowdimensionalEVD:O(P
3
)
Viberg-Stoica method High-dimensional SVD: O((MK)
2
N)+O(M
3
K
3
)+lowdimensionalEVD:O(P
3
)
FSF-MUSIC Three low-dimensional SVDs: 2O(K
2
N)+2O(K
3
)+O(M
2
N)+O(M
3
) + three 1-D searches
Proposed method Forward recursions of the CSS-MWF: O(PMKN) + low dimensional EVD: O(P
3
)
3.1. Simulation examples
In the simulation examples below, the array is assumed to be
a ULA with interelement spacing equal to a half wavelength
(λ
= 2πc/ω
c
).
Example 1. In this example, we assume that there are
three uncorrelated narrowband sources with equal power
impinging on the array from far filed. The number of sensors
is M
= 6, the temporal smoothing factor is K = 2, and
the number of snapshots is N
= 100. The DOA/Frequency
pairs of the three sources are (5
◦
,1.6rad),(−5
◦
,1.9rad),
and 5
◦
,2.2rad),respectively.Figure 5 shows the scatter plots
of proposed method at SNRs
= 10 dB. We observe that
the resulting estimates are paired automatically. Moreover,
we note that the two sources with the same DOAs
= 5
◦
are clearly resolved. This is consistent with Property 2 in
Section 2.1.
Example 2. This example evaluates the performance of pro-
posed method for different angle and frequency separations.
We assume that the number of sensors is M
= 8, and the
number of snapshots is N
= 100. Thus, the Fourier temporal
resolution limit is 2π/N rad or 0.0628 rad and the Rayleigh
angle resolution limit for the ULA is 2/(M
−1) rad or 16.38
◦
.
First, it is assumed that two sources come from θ
1
= 0
◦
and θ
2
= (0 + Δθ)
◦
with two different frequencies ω
1
=
2.1radandω
2
= 2.5rad,respectively,whereΔθ is the angle
separation between the sources. Figures 6(a) and 6(b) show
the root-mean-square errors (RMSEs) of
ω
1
and
θ
1
versus
angle separation Δθ at SNRs
= 15 dB. The performance
of the second source is similar to that of the first one.
All results provided contain 1000 Monte Carlo trials. The
RMSEs of the ith source for DOA and frequency estimation
are, respectively, defined as
RMSEs
θ
i
=
E
θ
i
−θ
i
2
, i = 1, 2, , P,
(25)
RMSEs
ω
i
=
E
ω
i
−ω
i
2
, i = 1, 2, , P,
(26)
where i represents the source index. For a clear illustration,
only the square root of the CRB (RCRB) with K
= 4is
provided. Figures 6(a) and 6(b) show that, as the temporal
smoothing factor K increases, the accuracy is improved. We
also note from Figures 6(a) and 6(b) that the two sources
with the same DOA (when Δθ
= 0) can be resolved by using
the spatiotemporal data model, which is again consistent
with the discussion of Property 2 in Section 2.1.
Then, we assume that two sources with the frequencies
ω
1
= 2.1rad and ω
2
= (2.1+Δω) rad come from two
151050−5−10−15
DOA (deg)
1
1.2
1.4
1.6
1.8
2
2.2
2.4
2.6
2.8
3
Frequency (rad)
(−5
◦
,1.9rad)
(5
◦
,2.2rad)
(5
◦
,1.6rad)
Figure 5: Scatter plot of estimated DOA/frequency pairs with
proposed method. SNRs
= 10 dB, M = 6, K = 2, N = 100, and
1000 trials are used.
different DOAs θ
1
= 5
◦
and θ
2
= 10
◦
,respectively,where
Δω is the frequency separation between the sources. Figures
7(a) and 7(b) show the RMSEs of
ω
1
and
θ
1
versus frequency
separation Δω at SNRs
= 15 dB. We observe once again that
the temporal smoothing can improve the accuracy. However,
unlike the results in Figures 6(a) and 6(b), two sources with
the same frequency (when Δω
= 0) cannot be resolved by
using the spatiotemporal data model. Meanwhile, Figures
7(a) and 7(b) show that the temporal resolution of the
proposed method goes beyond its corresponding resolution
limit. Moreover, it is seen that, as the frequency separation
Δω increases, the accuracy of DOA estimation is improved
while the improvement for frequency estimation is little.
Example 3. This example tests the RMSEs of proposed
method versus the SNR in both white noise and colored
noise. Comparisons with the JAFE algorithm [4], the Viberg-
Stoica method [6], the FSF-MUSIC algorithm [9], and the
RCRB are made simultaneously. In the simulations below,
the number of sources is P
= 2. The true DOA/Frequency
pairs of the two sources are (
−3
◦
, 2.1 rad) and (3
◦
,2.15rad),
respectively. The number of sensors is M
= 12, the temporal
smoothing factor is K
= 4, and the number of snapshots
is N
= 100. Thus, both the temporal resolution and the
spatial resolution of the proposed method go beyond their
corresponding resolution limits (0.0628 rad and 10.42
◦
). All
results provided contain 1000 Monte Carlo trials.
T. Shu and X. Liu 9
Table 2: Means and RMSEs of three methods based on the 20 estimates when used with experimental data.
Source (θ
i
, f
i
)
Prewhitened JAFE Method of Zoltowski Proposed method
Mean RMSE Mean RMSE Mean RMSE
(3
◦
, 0.3436) (3.052
◦
, 0.3409) (0.3162
◦
, 0.002613) (2.879
◦
, 0.3396) (0.8163
◦
, 0.003921) (3.056
◦
, 0.3429) (0.2899
◦
, 0.002139)
(
−9
◦
, 0.25) (−9.051
◦
, 0.2532) (0.2854
◦
, 0.002159) (−8.810
◦
, 0.2558) (0.8631
◦
, 0.004051) (−9.033
◦
, 0.2520) (0.3484
◦
, 0.002386)
(8
◦
, 0.1563) (8.074
◦
, 0.1571) (0.3509
◦
, 0.002273) (8.261
◦
, 0.1611) (0.7972
◦
, 0.004237) (8.062
◦
, 0.1557) (0.3737
◦
, 0.002751)
20151050
Angle separation (deg)
10
−3
10
−2
10
−1
10
0
RMSE (rad)
K = 2
K
= 3
K
= 4
RCRB (K
= 4)
(a)
20151050
Angle separation (deg)
10
−2
10
−1
10
0
RMSE (deg)
K = 2
K
= 3
K
= 4
RCRB (K
= 4)
(b)
Figure 6: RMSE curves of the proposed method for frequency and DOA estimation of the first signal versus angle separation with fixed
SNRs
= 15 dB, M = 8, and N = 100. (a) Frequency estimation. (b) DOA estimation.
0.10.080.060.040.020
Frequency separation (rad)
10
−3
10
−2
10
−1
10
0
10
1
RMSE (rad)
K = 2
K
= 3
K
= 4
RCRB (K
= 4)
(a)
0.10.080.060.040.020
Frequency separation (rad)
10
−1
10
0
10
1
10
2
RMSE (deg)
K = 2
K
= 3
K
= 4
RCRB (K
= 4)
(b)
Figure 7: RMSE curves of the proposed method for frequency and DOA estimation of the first signal versus frequency separation with fixed
SNRs
= 15 dB, M = 8, and N = 100. (a) Frequency estimation. (b) DOA estimation.
10 EURASIP Journal on Advances in Signal Processing
2520151050−5−10
SNR (dB)
10
−4
10
−3
10
−2
10
−1
RMSE (rad)
JAFE
Viberg-Stoica method
FSF-music
Proposed method
RCRB
(a)
2520151050−5−10
SNR (dB)
10
−3
10
−2
10
−1
10
0
RMSE (degrees)
JAFE
Viberg-Stoica method
FSF-music
Proposed method
RCRB
(b)
Figure 8: RMSE curves of four methods for frequency and DOA estimation of the first signal versus SNR and the corresponding RCRB in
both spatially and temporally white noise with fixed M
= 12, N = 100, and K = 4. (a) Frequency estimation. (b) DOA estimation.
2520151050−5−10
SNR (dB)
10
−4
10
−3
10
−2
10
−1
10
0
10
1
RMSE (rad)
JAFE
Viberg-Stoica method
FSF-music
Proposed method
RCRB
(a)
2520151050−5−10
SNR (dB)
10
−3
10
−2
10
−1
10
0
10
1
10
2
RMSE (deg)
JAFE
Viberg-Stoica method
FSF-music
Proposed method
RCRB
(b)
Figure 9: RMSE curves of four methods for frequency and DOA estimation of the first signal versus SNR and the corresponding RCRB in
both spatially and temporally colored noise with fixed M
= 12, N = 100, and K = 4. (a) Frequency estimation. (b) DOA estimation.
First, we assume that the noise is both spatially and
temporally white. Figures 8(a) and 8(b) show the RMSE
curves of frequency and DOA estimates versus SNR for
the first source. The performance of the second source is
similar to that of the first one. From Figures 8(a) and
8(b), it is obvious that the JAFE and the FSF-MUSIC have
very close performances and outperform other two methods
for both frequency and DOA estimations. Meanwhile, the
performance of the proposed method is slightly superior to
that of the Viberg-Stoica method.
Then, we consider a more general scenario where the
noise is both spatially and temporally colored. Figures 9(a)
and 9(b) show the RMSE curves versus SNR for the first sig-
nal in the colored noise which is modeled as a multichannel
T. Shu and X. Liu 11
50403020100
Eigenvalue index
−4
−2
0
2
4
6
8
10
12
Eigenvalue (dB)
Exact covariance (white noise)
Sample covariance (white noise)
Sample covariance (colored noise)
Figure 10: Eigenvalue spectrum of the sample covariance matrix
with M
= 12, K = 4, N = 100, and SNRs = 10 dB.
second-order autoregressive (AR(2)) random process [35].
Note that the proposed method has the best performance
among the four methods for both frequency and DOA
estimations, especially in the low SNR region. To gain
insight into why the colored noise degrades the performances
of the classical subspace-based methods significantly, we
plot the eigenvalue spectrum of aforementioned simulation
examples in Figure 10 for both white noise case and colored
noise case. It is clear that the presence of colored noise
leads to the eigenspectrum spreading. In this situation, the
noise subspace is not orthogonal to the signal subspace
anymore. Moreover, we give another important measure of
performance in this analysis, namely, the subspace distance
[36]. The subspace distance is a measure that compares the
Euclidian distance between two subspaces. The smaller the
subspace distance is, the more similar the two subspaces are.
Let
Ω
MWF
and
Ω
EIG
denote two signal subspace estimates
based on MWF and eigendecomposition, respectively. The
signal subspace distances between
Ω
MWF
(or
Ω
EIG
) and the
true signal subspace Ω aredefinedasfollows[36]:
d
Ω
MWF
=
1
√
2
P
Ω
MWF
−P
Ω
F
, d
Ω
EIG
=
1
√
2
P
Ω
EIG
−P
Ω
F
,
(27)
where P
Ω
MWF
, P
Ω
EIG
,andP
Ω
are three orthogonal projection
matrices onto the spaces of
Ω
MWF
,
Ω
EIG
,andΩ,respectively.
Figures 11(a) and 11(b) show the comparisons of the signal
subspace distances d
Ω
MWF
and d
Ω
EIG
for the same simulation
scenario as Figures 8 and 9.WecannotefromFigure 11(a)
that the subspace distances d
Ω
MWF
and d
Ω
EIG
are very close in
the case of white noise. However, the subspace distance d
Ω
MWF
is significantly smaller than the distance d
Ω
EIG
in Figure 11(b)
especially in the low SNR region. In this case, the subspace
determined by
Ω
EIG
departs from the true signal subspace Ω,
which results in a drastic performance degradation.
2520151050−5−10
SNR (dB)
10
−3
10
−2
10
−1
10
0
Subspace distance
MWF
Eigendecomposition
(a)
2520151050−5−10
SNR (dB)
10
−3
10
−2
10
−1
10
0
10
1
Subspace distance
MWF
Eigendecomposition
(b)
Figure 11: Comparison of the signal subspace distances with fixed
M
= 12, N = 100, and K = 4. (a) White noise. (b) Colored noise.
Comments
The classical subspace-based methods are inherently not
well suited to the situation in which a dominant signal
subspace is not clearly present. In addition, it should
be noted that, although the prewhitened subspace-based
method [6] can improve the accuracy, known statistics of
the colored noise (e.g., the temporal and spatial correlation
time) are required, which is often unavailable in practical
applications. In contrast, the signal-dependent method has
been demonstrated to be more robust to this problem, and
thus, has a remarkably better performance.
12 EURASIP Journal on Advances in Signal Processing
80706050403020100
Number of sensors
10
3
10
4
10
5
10
6
10
7
10
8
10
9
Floaps
JAFE
Viberg-Stoica method
FSF-music
Proposed method
Figure 12: Main computational complexity of various algorithms
versus the number of sensors with fixed K
= 4, N = 100, and P = 3.
Example 4. In this example, we compare the computational
complexities of various algorithms. For easy reference, the
comparisons of the computational complexity of these
algorithms are summarized in Ta bl e 1 .Morespecifically,we
consider the case where the source number is P
= 3, the
number of snapshots is N
= 100, and temporal smoothing
factor is K
= 4. The computational complexity versus
the number of sensors is plotted in Figure 12.Weobserve
that the proposed method has the lowest computational
complexity among four algorithms.
3.2. Experimental examples
We apply the proposed method to the experimental data
collected by the real array system. The array system was
developed at the research institute of China-Aerospace Science
and Industry Corporation (CASIC). The real data was col-
lected in the anechoic chamber on October 20, 2005. The
linear frequency modulated (LFM) signals at S-band were
used in the experiment. The array system is a horizontal ULA
which consists of M
= 8 elements. The spacing between
adjacent elements is 4.00 cm. After demodulation to IF, the
data was sampled at a rate of 160 MHz with 12-bit precision,
and 256 snapshots were collected at each antenna output.
There are three uncorrelated sources arriving at the array
from θ
1
= 3
◦
, θ
2
=−9
◦
,andθ
3
= 8
◦
with SNRs of 12 dB,
10 dB, and 10 dB, respectively. The transmitted frequencies
and the normalized frequencies (after demodulation) of
three sources are (3.090 GHz, 0.34375), (3.075 GHz, 0.25),
and (3.060 GHz, 0.15625), respectively. The corresponding
bandwidths are 6 MHz, 10 MHz, and 7.5 MHz, respectively.
The source with the direction of θ
1
= 3
◦
is assumed to be the
desired signal, and only its transmitted waveform is known a
priori.
20151050
Sample
0.1
0.15
0.2
0.25
0.3
0.35
0.4
0.45
0.5
Frequency estimates (rad)
Source 1
Source 2
Source 3
True frequencies
(a)
20151050
Sample
−10
−5
0
5
10
DOA estimates (deg)
Source 1
Source 2
Source 3
Tr ue D OA s
(b)
Figure 13: Frequency and DOA estimates with the proposed
methods by using experimental data. (M
= 8, K = 4, N = 256).
(a) Frequency estimation. (b) DOA estimation.
Figures 13(a) and 13(b) show the experiment results of
the proposed method with K
= 4. Each curve contains 20
estimates. From Figure 13, we observe that the estimation
performance of the proposed method is reliable in this
experiment. Based on the aforementioned 20 estimates, the
comparisons of the means and RMSEs with the prewhitened
JAFE [5] and the Zoltowski method [7]aremadeinTa bl e 2 .
(Due to the difference between two system models, we only
test this algorithm under the model of 1-D ULA instead
of 2-D L-shaped nonuniform linear array which is used in
[7].) Note that for the experimental data analyzed here, the
proposed method and the prewhitened JAFE provide similar
performances and outperform the Zoltowski method.
T. Shu and X. Liu 13
50403020100
K
10
−4
10
−3
10
−2
RMSE (rad)
Experimental results
Simulation results (white noise)
(a)
50403020100
K
10
−2
10
−1
10
0
RMSE (deg)
Experimental results
Simulation results (white noise)
(b)
Figure 14: RMSE curves for frequency and DOA estimation of the
desired signal as functions of temporal smoothing factor K.(M
= 8,
N
= 256). (a) Frequency estimation. (b) DOA estimation.
Meanwhile, the effect of temporal smoothing on the
RMSE is investigated. In Figures 14(a) and 14(b), we plot
the RMSEs of the desired signal as a function of temporal
smoothing factor K, and show both the experimental results
(based on 20 experimental trials) and the simulation results
(based on 1000 Monte Carlo trials). As we expect, the RMSEs
of frequency and DOA estimation decrease when K changes
from 2 to 50, which is consistent with the discussion in [5].
In [5], the optimum temporal smoothing factors are given,
that is, K
= 2N/3 for frequency estimation and K = N/2
for DOA estimation, respectively. However, this is the most
computationally prohibitive case. From the results in Figures
14(a) and 14(b), we suggest choosing K between4and10
to make a compromise between complexity and accuracy. In
addition, from above experimental results, it should be noted
that the performance degradation of the experimental results
is due to the presence of colored noise and other real-world
effects.
4. CONCLUSION
To apply the joint DOA and frequency estimation more
effectively in practical applications, a robust and computa-
tionally efficient method is proposed by using the signal-
dependent MWF and subspace technique. It is shown that,
in contrast to the classical subspace-based methods, the
proposed method provides a robust performance in the
presence of colored noise. Meanwhile, its computational
complexity is much lower than the classical subspace-based
methods. It is believed that these advantages can make the
proposed method more efficient and feasible in real-world
applications.
Finally, it should be noted that this paper does not
consider the case of coherent signals. As shown in Figure 7,
two sources with the same frequency cannot be resolved by
using the proposed method. Following the method of [5], we
can resort to the spatial smoothing technique to decorrelate
the coherent signals. However, this will result in some
disadvantages, such as the increase of the computational
complexity and the loss of spatial resolution. We will focus
on these problems in our further research.
APPENDICES
A. PROOF OF PROPERTY 1
Let ϕ
i
= 2πd/λ
i
sin θ
i
, then we have
Ω
=
⎡
⎢
⎢
⎢
⎢
⎣
A
AΦ
.
.
.
AΦ
K−1
⎤
⎥
⎥
⎥
⎥
⎦
=
⎡
⎢
⎢
⎢
⎢
⎢
⎢
⎢
⎢
⎢
⎢
⎢
⎢
⎢
⎢
⎢
⎢
⎢
⎢
⎢
⎢
⎢
⎢
⎢
⎢
⎢
⎢
⎢
⎢
⎢
⎢
⎢
⎢
⎢
⎣
11··· 1
e
jϕ
1
e
jϕ
2
e
jϕ
P
.
.
.
.
.
.
.
.
.
e
j(M−1)ϕ
1
e
j(M−1)ϕ
2
e
j(M−1)ϕ
P
e
jω
1
e
jω
2
e
jω
P
e
jϕ
1
e
jω
1
e
jϕ
2
e
jω
2
e
jϕ
P
e
jω
P
.
.
.
.
.
.
.
.
.
e
j(M−1)ϕ
1
e
jω
1
e
j(M−1)ϕ
2
e
jω
2
.
.
.
e
j(M−1)ϕ
P
e
jω
P
.
.
.
.
.
.
.
.
.
e
j(K−1)ω
1
e
j(K−1)ω
2
e
j(K−1)ω
P
e
jϕ
1
e
j(K−1)ω
1
e
jϕ
2
e
j(K−1)ω
2
e
jϕ
P
e
j(K−1)ω
P
.
.
.
.
.
.
.
.
.
e
j(M−1)ϕ
1
×e
j(K−1)ω
1
e
j(M−1)ϕ
2
×e
j(K−1)ω
2
···
e
j(M−1)ϕ
P
×e
j(K−1)ω
P
⎤
⎥
⎥
⎥
⎥
⎥
⎥
⎥
⎥
⎥
⎥
⎥
⎥
⎥
⎥
⎥
⎥
⎥
⎥
⎥
⎥
⎥
⎥
⎥
⎥
⎥
⎥
⎥
⎥
⎥
⎥
⎥
⎥
⎥
⎦
=
Ξ
θ
1
, ω
1
, Ξ
θ
2
, ω
2
, , Ξ
θ
P
, ω
P
,
(A.1)
14 EURASIP Journal on Advances in Signal Processing
where
Ξ
θ
i
, ω
i
=
⎡
⎢
⎢
⎢
⎢
⎢
⎢
⎢
⎢
⎢
⎢
⎢
⎢
⎢
⎢
⎢
⎢
⎢
⎢
⎢
⎢
⎢
⎢
⎢
⎢
⎢
⎢
⎢
⎢
⎢
⎣
1
e
jϕ
i
.
.
.
e
j(M−1)ϕ
i
e
jω
i
e
jϕ
i
e
jω
i
.
.
.
e
j(M−1)ϕ
i
e
jω
i
.
.
.
e
j(K−1)ω
i
e
jϕ
i
e
j(K−1)ω
i
.
.
.
e
j(M−1)ϕ
i
e
j(K−1)ω
i
⎤
⎥
⎥
⎥
⎥
⎥
⎥
⎥
⎥
⎥
⎥
⎥
⎥
⎥
⎥
⎥
⎥
⎥
⎥
⎥
⎥
⎥
⎥
⎥
⎥
⎥
⎥
⎥
⎥
⎥
⎦
=
⎡
⎢
⎢
⎢
⎢
⎢
⎣
a
θ
i
e
jω
i
a
θ
i
.
.
.
e
j(K−1)ω
i
a
θ
i
⎤
⎥
⎥
⎥
⎥
⎥
⎦
=
b
ω
i
⊗a
θ
i
.
(A.2)
This proves Property 1.
B. PROOF OF THEOREM 1
The log likelihood function of the signal is
ln L(η)
= const − MKN ln σ
2
−
1
σ
2
N
t=1
X
K
(t) −Ωg(t)
H
X
K
(t) −Ωg(t)
,
(B.1)
where the unknown parameter vector η is defined as
η
=
θ
T
ω
T
Re{g(1)}Im{g(1)}···Re{g(N)} Im{g(N)}σ
2
(B.2)
and θ
= [
θ
1
··· θ
P
]
T
is a P × 1 vector containing the
DOAs of the sources.
ω
= [
ω
1
··· ω
P
]
T
is a P × 1 vector containing the
frequencies of the sources.
The Fisher information matrix (FIX) is given by [32,
Appendix B]
FIM(η)
= E
∂ ln L(η)
∂η
∂ ln L(η)
∂η
T
=
⎡
⎢
⎢
⎢
⎢
⎢
⎢
⎢
⎢
⎢
⎢
⎢
⎢
⎣
Υ
θθ
Υ
θω
μ
T
(1) μ
T
(2) ··· μ
T
(N)0
Υ
ωθ
Υ
ωω
ν
T
(1) ν
T
(2) ··· ν
T
(N)0
μ(1) ν(1) Λ 0
··· 00
μ(2) ν(2) 0 Λ
··· 00
.
.
.
.
.
.
.
.
.
.
.
.
.
.
.
.
.
.0
μ(N) ν(N)0 0
··· Λ 0
000 000CRB
−1
σ
2
⎤
⎥
⎥
⎥
⎥
⎥
⎥
⎥
⎥
⎥
⎥
⎥
⎥
⎦
(B.3)
where
Υ
θθ
=
2
σ
2
N
t=1
Re
G
H
(t)D
H
θ
D
θ
G(t)
,
Υ
θω
=
2
σ
2
N
t=1
Re
G
H
(t)D
H
θ
D
ω
G(t)
,
Υ
ωθ
=
2
σ
2
N
t=1
Re
G
H
(t)D
H
ω
D
θ
G(t)
,
Υ
ωω
=
2
σ
2
N
t=1
Re
G
H
(t)D
H
ω
D
ω
G(t)
,
Λ
=
2
σ
2
⎡
⎣
Re
Ω
H
Ω
−Im
Ω
H
Ω
Im
Ω
H
Ω
Re
Ω
H
Ω
⎤
⎦
,
μ(t)
=
2
σ
2
⎡
⎣
Re
Ω
H
D
θ
G(t)
Im
Ω
H
D
θ
G(t)
⎤
⎦
,
ν(t)
=
2
σ
2
⎡
⎣
Re
Ω
H
D
ω
G(t)
Im
Ω
H
D
ω
G(t)
⎤
⎦
,
CRB
σ
2
=
σ
4
MKN
.
(B.4)
Then, the inverse CRB matrix for θ and ω is obtained by the
following:
CRB
−1
(θ, ω)
=
Υ
θθ
Υ
θω
Υ
ωθ
Υ
ωω
−
μ
T
(1) μ
T
(2) ··· μ
T
(N)
ν
T
(1) ν
T
(2) ··· ν
T
(N)
·
⎡
⎢
⎢
⎢
⎢
⎣
Λ 0 ··· 0
0 Λ
··· 0
.
.
.
.
.
. Λ
.
.
.
00
··· Λ
⎤
⎥
⎥
⎥
⎥
⎦
−1
⎡
⎢
⎢
⎢
⎢
⎣
μ(1) ν(1)
μ(2) ν(2)
.
.
.
.
.
.
μ(N) ν(N)
⎤
⎥
⎥
⎥
⎥
⎦
=
Υ
θθ
Υ
θω
Υ
ωθ
Υ
ωω
−
N
t=1
μ
T
(t)
ν
T
(t)
Λ
−1
μ(t) ν(t)
=
2
σ
2
N
t=1
Re
G
H
(t)0
0 G
H
(t)
⎡
⎣
D
H
θ
D
H
ω
⎤
⎦
·
I −Ω
Ω
H
Ω
−1
Ω
H
D
θ
D
ω
B(t)0
0 B(t)
=
2
σ
2
N
t=1
Re
Z
H
(t)D
H
P
⊥
Ω
DZ(t)
.
(B.5)
This concludes the proof.
T. Shu and X. Liu 15
C. PROOF OF THEOREM 2
Let Γ
= D
H
P
⊥
Ω
D,wehave
lim
N→∞
N
t=1
Re
Z
H
(t)ΓZ(t)
=
lim
N→∞
Re
N
t=1
z
H
(t)z(t)
Γ
,
(C.1)
where z(t)
= [
g
1
(t) g
2
(t) ··· g
P
(t) g
1
(t) g
2
(t) ··· g
P
(t)
].
For large N,
lim
N→∞
N
t=1
z
H
(t)z(t) ≈ N·
⎡
⎣
R
T
g
R
T
g
R
T
g
R
T
g
⎤
⎦
=
N·R
T
,(C.2)
where R
g
= lim
N→∞
(1/N)
N
t
=1
g(t)g
H
(t). Substituting (C.1)
and (C.2) into (20), we obtain (22). This concludes the proof.
ACKNOWLEDGMENTS
The authors are grateful to the Department of Electronic
Engineering, Nanjing University of Science and Technology,
for permission to use the experimental data. The authors
would also like to thank the anonymous reviewers for their
useful comments and insightful suggestions on a former
version of this paper.
REFERENCES
[1]M.P.ClarkandL.L.Scharf,“Amaximumlikelihood
estimation technique for spatial-temporal modal analysis,” in
Proceedings of the 25th Asilomar Conference on Signals, Systems
and Computers, vol. 1, pp. 257–261, Pacific Grove, Calif, USA,
November 1991.
[2] M.P.ClarkandL.L.Scharf,“Two-dimensionalmodalanalysis
based on maximum likelihood,” IEEE Transactions on Signal
Processing, vol. 42, no. 6, pp. 1443–1452, 1994.
[3] M. Wax, T J. Shan, and T. Kailath, “Spatio-temporal spectral
analysis by eigenstructure methods,” IEEE Transactions on
Acoustics, Speech, and Signal Processing, vol. 32, no. 4, pp. 817–
827, 1984.
[4] A.N.Lemma,A J.vanderVeen,andE.F.Deprettere,“Joint
angle-frequency estimation using multi-resolution ESPRIT,”
in Proceedings of IEEE International Conference on Acoustics,
Speech and Signal Processing (ICASSP ’98), vol. 4, pp. 1957–
1960, Seattler, Wash, USA, May 1998.
[5]A.N.Lemma,A J.vanderVeen,andE.F.Deprettere,
“Analysis of joint angle-frequency estimation using ESPRIT,”
IEEE Transactions on Signal Processing, vol. 51, no. 5, pp. 1264–
1283, 2003.
[6] M. Viberg and P. Stoica, “A computationally efficient method
for joint direction finding and frequency estimation in colored
noise,” in Proceedings of the 32nd Asilomar Conference on
Signals, Systems and Computers, vol. 2, pp. 1547–1551, Pacific
Grove, Calif, USA, November 1998.
[7] M. D. Zoltowski and C. P. Mathews, “Real-time frequency
and 2-D angle estimation with sub-Nyquist spatio-temporal
sampling,” IEEE Transactions on Signal Processing, vol. 42, no.
10, pp. 2781–2794, 1994.
[8] M. Haardt and J. A. Nossek, “3-D unitary ESPRIT for joint 2-
D angle and carrier estimation,” in Proceedings of IEEE Inter-
national Conference on Acoustics, Speech, and Signal Processing
(ICASSP ’97), vol. 1, pp. 255–258, Munich, Germany, April
1997.
[9] J D. Lin, W H. Fang, Y Y. Wang, and J T. Chen, “FSF
MUSIC for joint DOA and frequency estimation and its
performance analysis,” IEEE Transactions on Signal Processing,
vol. 54, no. 12, pp. 4529–4542, 2006.
[10] H. Belkacemi and S. Marcos, “Robust subspace-based algo-
rithms for joint angle/Doppler estimation in non-Gaussian
clutter,” Signal Processing, vol. 87, no. 7, pp. 1547–1558, 2007.
[11] R. Schmidt, A signal subspace approach to multiple emitter loca-
tion and spectral estimation, Ph.D. thesis, Stanford University,
Stanford, Calif, USA, November 1981.
[12] R. Roy, ESPRIT-estimation of signal parameters via rotational
invariance techniques, Ph.D. thesis, Stanford University, Stan-
ford, Calif, USA, August 1987.
[13] J. Li and R. T. Compton Jr., “Maximum likelihood angle esti-
mation for signals with known waveforms,” IEEE Transactions
on Signal Processing, vol. 41, no. 9, pp. 2850–2862, 1993.
[14] J. Li, B. Halder, P. Stoica, and M. Viberg, “Computationally
efficient angle estimation for signals with known waveforms,”
IEEE Transactions on Signal Processing, vol. 43, no. 9, pp. 2154–
2163, 1995.
[15] M. Wax and A. Leshem, “Joint estimation of time delays and
directions of arrival of multiple reflections of a known signal,”
IEEE Transactions on Signal Processing, vol. 45, no. 10, pp.
2477–2484, 1997.
[16] A. L. Swindlehurst, “Time delay and spatial signature estima-
tion using known asynchronous signals,” IEEE Transactions on
Signal Processing, vol. 46, no. 2, pp. 449–462, 1998.
[17] A. Jakobsson, A. L. Swindlehurst, and P. Stoica, “Subspace-
based estimation of time delays and doppler shifts,” IEEE
Transactions on Signal Processing, vol. 46, no. 9, pp. 2472–2483,
1998.
[18] F. Gini, M. Greco, and A. Farina, “Multiple radar targets
estimation by exploiting induced amplitude modulation,”
IEEE Transactions on Aerospace and Electronic Systems, vol. 39,
no. 4, pp. 1316–1332, 2003.
[19] J. Ward and R. T. Compton Jr., “Improving the performance
of a slotted ALOHA packet radio network with an adaptive
array,” IEEE Transactions on Communications,vol.40,no.2,
pp. 292–300, 1992.
[20] Y. Jiang, P. Stoica, and J. Li, “Array signal processing in the
known waveform and steering vector case,” IEEE Transactions
on Signal Processing, vol. 52, no. 1, pp. 23–35, 2004.
[21] J. S. Goldstein, I. S. Reed, and L. L. Scharf, “A multistage
representation of the Wiener filter based on orthogonal
projections,” IEEE Transactions on Information Theory, vol. 44,
no. 7, pp. 2943–2959, 1998.
[22]J.R.Guerci,J.S.Goldstein,P.A.Zulch,andI.S.Reed,
“Optimal reduced-rank 3D STAP for joint hot and cold clutter
mitigation,” in Proceedings of the 11th IEEE Radar Conference,
pp. 119–124, Waltham, Mass, USA, April 1999.
[23] M. L. Honig and W. Xiao, “Performance of reduced-rank
linear interference suppression,” IEEE Transactions on Infor-
mation Theory, vol. 47, no. 5, pp. 1928–1946, 2001.
[24] J. R. Guerci and J. S. Bergin, “Principal components, covari-
ance matrix tapers, and the subspace leakage problem,” IEEE
Transactions on Aerospace and Electronic Systems, vol. 38, no.
1, pp. 152–162, 2002.
[25] M. Wax and T. Kailath, “Detection of signals by information
theoretic criteria,” IEEE Transactions on Acoustics, Speech, and
Signal Processing, vol. 33, no. 2, pp. 387–392, 1985.
16 EURASIP Journal on Advances in Signal Processing
[26] J. Ward, “Space-time adaptive processing for airborne radar,”
Tech. Rep. 1015, Lincoln Laboratory, Lexington, Mass, USA,
December 1994.
[27] J. Roe, S. Cussons, and A. Feltham, “Knowledge-based signal
processingforradarESMsystems,”IEE proceedings F, vol. 137,
no. 5, pp. 293–301, 1990.
[28] J. B. Tsui, Microwave Receivers with Electronic Warfare Applica-
tions, John Wiley & Sons, New York, NY, USA, 1986.
[29] D. C. Ricks and J. S. Goldstein, “Efficient architectures for
implementing adaptive algorithms,” in Proceedings of the
Antenna Applications Symposium, pp. 29–41, Monticello, Ill,
USA, September 2000.
[30] P. Stoica and A. Nehorai, “MUSIC, maximum likelihood, and
Cram
´
er-Rao bound,” IEEE Transactions on Acoustics, Speech,
and Signal Processing, vol. 37, no. 5, pp. 720–741, 1989.
[31] P. Stoica and A. Nehorai, “Performance study of condi-
tional and unconditional direction-of-arrival estimation,”
IEEE Transactions on Acoustics, Speech, and Signal Processing,
vol. 38, no. 10, pp. 1783–1795, 1990.
[32] P. Stoica and R. L. Moses, Introduction to Spectral Analysis,
Prentice-Hall, Englewood Cliffs, NJ, USA, 1997.
[33] H. L. Van Trees, Optimun Array Processing, Wiley-Interscience,
New York, NY, USA, 2002.
[34] H. Ye and R. D. Degroat, “Maximum likelihood DOA
estimation and asymptotic Cram
´
er-Rao bounds for additive
unknown colored noise,” IEEE Transactions on Signal Process-
ing, vol. 43, no. 4, pp. 938–949, 1995.
[35] J. H. Michels, P. K. Varshney, and D. D. Weiner, “Synthesis of
correlated multichannel random processes,” IEEE Transactions
on Signal Processing, vol. 42, no. 2, pp. 367–375, 1994.
[36] R. A. Horn and C. R. Johnson, Matrix Analysis, Cambridge
University Press, Cambridge, UK, 1985.