Báo cáo hóa học: " Research Article Embedded System for Real-Time Digital Processing of Medical Ultrasound Doppler Signals" docx
Bạn đang xem bản rút gọn của tài liệu. Xem và tải ngay bản đầy đủ của tài liệu tại đây (2.32 MB, 7 trang )
Hindawi Publishing Corporation
EURASIP Journal on Advances in Signal Processing
Volume 2008, Article ID 418235, 7 pages
doi:10.1155/2008/418235
Research Article
Embedded System for Real-Time Digital Processing of
Medical Ultrasound Doppler Signals
S. Ricci, A. Dallai, E. Boni, L. Bassi, F. Guidi, A. Cellai, and P. Tortoli
Dipartimento Elettronica e Te lecomunicazioni, Universit
`
a deg li Studi di Firenze, Via S. Marta 3, 50139 Firenze, Italy
Correspondence should be addressed to S. Ricci, stefanp.ricci@unifi.it
Received 1 December 2007; Accepted 12 April 2008
Recommended by Chein-I Chang
Ultrasound (US) Doppler systems are routinely used for the diagnosis of cardiovascular diseases. Depending on the application,
either single tone bursts or more complex waveforms are periodically transmitted throughout a piezoelectric transducer towards
the region of interest. Extraction of Doppler information from echoes backscattered from moving blood cells typically involves
coherent demodulation and matched filtering of the received signal, followed by a suitable processing module. In this paper, we
present an embedded Doppler US system which has been designed as open research platform, programmable according to a variety
of strategies in both transmission and reception. By suitably sharing the processing tasks between a state-of-the-art FGPA and a
DSP, the system can be used in several medical US applications. As reference examples, the detection of microemboli in cerebral
circulation and the measurement of wall
distension in carotid arteries are finally presented.
Copyright © 2008 S. Ricci et al. This is an open access article distributed under the Creative Commons Attribution License, which
permits unrestricted use, distribution, and reproduction in any medium, provided the original work is properly cited.
1. INTRODUCTION
The well-known Doppler effect consists in the frequency shift
of a wave, originated from the relative movement between
the source and the receiver. In biomedical ultrasound (US)
applications, such an effect is mainly exploited to perform
blood flow velocity measurements, which are of interest for
the diagnosis of cardiovascular diseases [1].
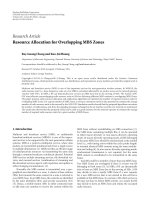
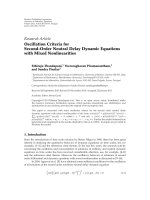
With reference to Figure 1, let us suppose having a single
red blood cell (erythrocyte) moving with constant velocity,
v, impinged by an acoustic plane wave of frequency f
0
.Let
c be the speed of sound in the surrounding medium and
δ the angle between the US propagation direction and the
velocity vector of the target. Being v
c, the frequency
shift between the transmitted and backscattered waves can
be approximated by the following equation:
f
d
= 2
f
0
c
v cos δ. (1)
By measuring the frequency shift f
d
,itispossibleto
estimate the axial component, v cos δ, of the target velocity.
The transmitted frequency, f
0
, used in most Doppler US
applications ranges between 2 MHz and 10 MHz, to reach a
few tens of MHz in specialized high-frequency equipment.
The expected blood velocities are typically lower than 1 m/s
in the peripheral arteries of healthy subjects, with possible
peaks of a few m/s in stenotic vessels [2]. Accordingly, the
detected Doppler shift is generally in a range of a few kHz.
In order to reliably measure the frequency shifts caused
by the movement of erythrocytes, both the transmit (TX)
and receive (RX) sections of an US system must be suitably
configured. In particular, in pulsed-wave (PW) Doppler
systems, a short burst of US energy is transmitted during
each pulse repetition interval (PRI). The transducer can be
excited by either a single tone burst or a more complex signal
produced by an arbitrary waveform generator (AWG). In
some applications, for example, when US contrast agents are
used [3] coded excitation strategies [4] are involved, while
multiple arbitrary bursts are transmitted in elastographic
studies [5]. Since each pulse is reflected/backscattered from
all targets intercepted during US propagation, multiple
echoes are received. The RX module typically includes in-
phase quadrature (I/Q) demodulation, to allow the iden-
tification of (forward/reverse) flow direction through the
base-band signal components. One or more sample volumes
(SVs), that is, the spatial region which contributes to the echo
received at a given time, can be explored by selecting, with
suitable electronic “gates,” specific portions of the received
2 EURASIP Journal on Advances in Signal Processing
echo-signals. The gated Doppler signals are high-pass fil-
tered to eliminate the “clutter,” that is, the high-level low-
frequency components due to still or slowly moving targets
like tissues or vessel walls. The clutter (whose amplitude can
be 60 dB higher than the signal backscattered from blood)
is generally removed because its presence could saturate
the RX dynamic range. Finally, the frequency content of
the filtered Doppler signal is estimated through either full
spectral analysis or suitable mean frequency estimators.
In the last few years, all processing modules involved
in Doppler systems have gradually migrated from analog
to digital implementations. The availability of high-speed,
high-resolution (12–14 bit) Analog-to-Digital (AD) convert-
ers now allows directly sampling the radio-frequency (RF)
echo signal, according to the same approach followed in the
so-called Software Defined Radio. This tendency is further
encouraged by high-speed programmable devices such as
digital signal processors (DSPs) and field programmable gate
arrays (FPGAs), which have the calculation power requested
to perform all needed processing in real time.
In this paper, an embedded system for multichannel
multigate (MCMG) US echography is described. The system
was conceived and realised as programmable research plat-
form, capable of implementing arbitrary TX-RX strategies
and user-defined processing. Section 2 reports details on how
the processing load is shared between a floating point DSP
and a single advanced FPGA so that the MCMG system can
be used in a number of different applications. Two reference
applications, the detection of microemboli in cerebral vessels
and the assessment of wall distension in peripheral arteries,
are presented in Section 3.
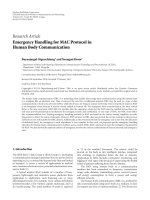
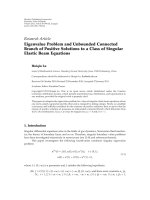
2. MCMG DIGITAL ARCHITECTURE
In the MCMG system, the basic tasks necessary to control
the transmission of US bursts by a piezoelectric transducer
and to extract the desired Doppler information from the
received echoes are shared between two state-of-the-art
programmable devices (see Figure 2): an FPGA from the
Stratix family (Altera, San Jose, Calif) [6]andaDSPfrom
the TMS320C67 family (Texas Instruments, Austin, Tex) [7].
Because of PW operation, two asynchronous and inde-
pendent processes are involved. The first process is highly
power demanding, as it includes TX burst generation, RX
data acquisition, demodulation, and reordering, and must be
performed within each PRI. The second process comprises
the Doppler spectrum estimate and/or other processing
tasks, which typically run with an independent rate which
must be sufficient to produce a fluid result presentation (e.g.,
50 fps). The former process mainly involves the FPGA and
some direct memory access (DMA) channels in the DSP,
while the latter is specific of remaining DMA channels and
of the DSP core.
At the beginning of each PRI, the FPGA generates arbi-
trary TX waveforms, which are D/A converted at 64 Msps,
amplified and sent to the US transducer (see Section 2.1).
The received echoes are amplified with gain programmable
in the range 20–60 dB, to fit the 14-bit A/D converter
dynamics. The digital samples, obtained at 64 MHz, are
PRI
t
f
0
Tissue
Blood vessel
f
e
Moving
erythrocite (v)
TX pulse ( f
0
)
δ
Figure 1: In PW Doppler investigations, an US pulse is transmitted
into tissues during each PRI, causing echoes travelling back to the
transducer carrying information about tissue interfaces and moving
particles.
TX
amplification
RX
amplification
DAC
ADC
FPGA
SDRAM
DSP
To
display
To / f r o m
transducer
Figure 2: MCMG digital architecture.
coherently demodulated and low-pass filtered by the FPGA
(see Section 2.2). The base-band and/or RF data are con-
tinuously stored in a large circular buffer by the DSP
DMAs (see Section 2.3). This buffer is held inside a 64-MB
SDRAM module, which represents the main system storage
device. Other DMA channels are used to reorder the data
collected in each PRI in a format suitable for subsequent
processing. Finally, the DSP core produces an audio output
(see Section 2.4) and processes the data according to the
application specific algorithm which is selected in a suitable
library. The processing results are sent through an USB 2.0
channel to a host PC where proprietary software is used
to configure the MCMG system and for real-time display
purposes. At any time, the acquisition can be stopped to
download the data gathered in the circular buffer to the PC.
2.1. Arbitrary waveform generator
While in standard Doppler studies the transducer is excited
by periodical single tone bursts, more complex excitation
sequences are needed in some special applications [3, 4].
The MCMG system features an AWG based on a sequencer
that executes a programmable code. The code contains the
samples to be converted to analog, together with commands
that control the sequence generation and the behaviour of
related resources, such as the demodulator. The sequencer is
implemented in the FPGA as a VHDL state machine which,
at each clock cycle at 64 MHz, reads a word from the code
S. Ricci et al. 3
1
2
Agilent technologies
12V/ 220V/ 400 ns 20 μs/ Auto 1 1.5V
PRI sync.
N
M
K
N
TX
220V/ 1.86 μs500ns Stop 2 20 V
2
TX
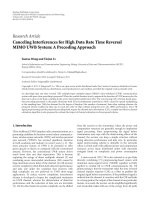
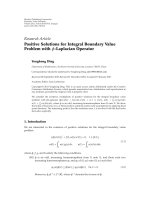
Figure 3: Oscilloscope acquisition of an excitation sequence
involving 3 different waveforms over two consecutive PRIs. The
bottom box shows the upward chirp signal on expanded scale. (PRI
length
≈ 65 microseconds.)
stored in the internal memory, interprets the contents, and
executes the command. The sequencer employs only 256
logic cells and one M-RAM [6] block to hold the code.
Complex sequences can be obtained by combining
command-loops with synchronization instructions. Figure 3
(top) shows an example of TX sequence involving three
different waveforms (N, M, K)overtwoconsecutivePRIs.
The oscilloscope channel 1 reports the PRI synchronism,
while channel 2 shows the synthesised waveforms picked up
at the output of the power amplifier. In the first PRI, a linear
downward chirp (N)between8MHzand2MHzisfired,
while every second PRI an upward chirp (M) symmetrical
with respect to the previous one is generated. In the same
PRI, a 0.5 MHz burst (K) of lower amplitude is also present.
The user can program the sequencer either directly or
through a software that helps synthesising the TX waveforms
through a graphical interface. A library of predefined
configurations is available, and waveforms synthesized in
different languages (e.g., Matlab) can be uploaded as well.
2.2. Coherent demodulation
In standard quadrature demodulation schemes, the demod-
ulation frequency matches the TX frequency. However,
as discussed above, in some cases multiple bursts having
different centre frequencies are sequentially used. Moreover,
in applications like harmonic Doppler imaging [8], the echo
has to be demodulated by a multiple of the TX frequency.
It can also be useful to simultaneously demodulate the
same signal by different frequencies, to obtain, for example,
the fundamental together with the harmonic component.
An efficient and flexible architecture for digital coherent
demodulation is thus requested.
In the MCMG system, 4 concurrent programmable
coherent demodulators are fitted in the FPGA. The archi-
tecture of each demodulator is depicted in Figure 4. During
each PRI, the demodulation quadrature signals are produced
by a direct digital synthesizer (DDS) based on a 512-word
look up table. Two 16-bit embedded multipliers process the
input data stream to produce 32-bit results that feed two
identical filtering channels. These include each a 4th-order
cascaded-integrator-comb (CIC) filter, with a decimator
between concatenated stages.
Each stage (see zoom-box in Figure 4)isbasedonaFIFO
(64 words of 32 bit) and a 37-bit accumulator that prevents
any possible saturation. The control logic produces the FIFO
read signal (R) delayed by N-cycles with respect to the write
signal (W), so that the FIFO acts as N stage shifter. Thus, the
input of the accumulator register is
Acc (n)
= Acc (n −1) + x(n) −x(n −N), (2)
which represents a “recursive summing” architecture imple-
menting a “moving averager.” Finally, the output sequence
y(n), after the decimator, is given by
y(n)
=
N
i=0
x(Kn−i), (3)
where N and K are the integration and decimation factors,
respectively, which can be independently set for each CIC
stage by the DSP.
Starting from the transfer function of a single comb filter
in the Z domain, and taking into account the decimator
blocks, through simple algebraic steps, the transfer function
of the cascade can be written as
H(z)
=
1 −z
−N
1
1 −z
−1
·
1 −z
−K
1
N
2
1 −z
−K
1
·
1 −z
−K
1
K
2
N
3
1 −z
−K
1
K
2
·
1 −z
−K
1
K
2
K
3
N
4
1 −z
−K
1
K
2
K
3
(4)
the filter amplitude response can be finely tuned through the
N values, to set the zero-transmission points over specific
bands, like those crossing the demodulation image frequen-
cies. Figure 5 shows an example. The transfer function of the
filter has here been designed in order to reject by more than
100 dB a 500 kHz band centered at 4 MHz, when the TX and
demodulation frequencies were both set at 2 MHz.
The demodulator output of each RX channel is finally
converted to floating-point format and stored inside a 2 kB
buffer.
Ta ble 1 summarises the operations requested by the
demodulation process. Each input sample is simultaneously
multiplied by the in-phase/quadrature reference signal (2
multiplications). Each following CIC stage performs 3 sums
(see (2)). Thus, assuming no decimation is performed, the
complete demodulation process involves, for each input
sample, 2 multiplications and 24 sums.
The use of CIC filters allowed saving multiplier units,
thus making feasible fitting 4 demodulators in a single FPGA.
Ta ble 2 lists the FPGA resources requested for each demodu-
lator. Each 16-bit multiplier employs 2 embedded DSP 9-bit
elements. The right column of Ta bl e 1 , in particular, reports
the percent resources used in an EP1S10 Stratix device.
4 EURASIP Journal on Advances in Signal Processing
Data in
x(n)
FIFO
WR
+
−
+
Acc.
reg.
Dec.
Data out
y(n)
Single CIC stage
From
DSP
Integration
factor N
Decimation
factor K
From TX
DDS
From
ADC
4-stages
CIC filter
Fix. to
float. point
Memory
buffer
4-stages
CIC filter
Fix. to
float. point
Memory
buffer
Memory
buffer
To DSP
Figure 4: Architecture of coherent demodulators fitted in the FPGA. The zoom box reports details of each CIC filter stage.
876543210
f (MHz)
−120
−100
−80
−60
−40
−20
0
Amplitude (dB)
Figure 5: Example of CIC filter response.
2.3. Data managing and reordering
The main data bus of the MCMG system connects the FPGA,
the DSP, and the memory bank through a 32-bit channel.
The bus, mastered by the DSP, supports transfer rates up to
360 MB/s when communicating between the DSP and the
SDRAM, and up to 90 MB/s when accessing the buffers inside
the FPGA.
At each PRI, the DSP moves either the RF or the demod-
ulated echo-data from the FPGA buffers to the SDRAM
through two concatenated DMA channels. The whole mem-
ory space is managed as a circular buffer in order to store
the latest acquired samples. This operation, for a typical PRI
of 100 microseconds, produces a bus load of 30% of its
maximum capacity.
Most algorithms coded in the DSP firmware needs, as
data input, a vector of samples coming from the same depth
over different PRIs. Hence, the DSP sorts the data read from
the SDRAM according to the so-called “corner turning” (CT)
Table 1: Operations of the demodulator requested for each input
sample.
Multiplications Sums
Multiplier 2 —
1stageCIC — 3
4-stage CIC—no decimation — 12
Demodulation process 2 24
Table 2: Resource employed by a single demodulator.
Employed resources EP1S10
Memory bits 38512 4.2%
Embedded DSP 9-bit elements 4 8.3%
Logic cells 1688 16%
strategy, a term originally used in radar applications. The CT
is equivalent to a matrix transposition. For instance, if we
analyse 256 SVs by collecting data over 128 PRIs, the DSP has
to transpose a matrix of 256
×128 elements through 256 CTs
of 128 elements each. The CT is performed by exploiting the
sorting capabilities of the DMA channels, with no load for
the DSP core. Once the vector with data regarding the same
depth is ready into the internal DSP memory, an interrupt
enables the core to start the specific processing (e.g., spectral
analysis).
2.4. Audio processing
In vascular applications, the Doppler frequency shift spans
the range 100 Hz–10 kHz. This range contains frequencies
that humans can directly listen to, and, when properly
trained, can use for diagnostic purposes. For this reason,
most US Doppler instruments include an audio reproduc-
tion system. Depending on the flow direction respective to
the US beam, the phase shift can be positive or negative, and
S. Ricci et al. 5
I
Q
Hilbert
Hilbert
+
+
Rv
Fw
Figure 6: Forward/reverse splitter.
aforward/reverseextractor[9] allows distinguishing the two
contributions in a stereo reproduction system.
The forward/reverse splitter scheme implemented in the
MCMG system is illustrated in Figure 6. It is based on the
Hilbert transform and is fed with the I/Q samples of a
selected depth. In particular, the signal components laying on
the negative band are shifted by +90 degrees, while those on
the positive band are shifted by
−90 degrees. In the forward
channel, the negative band is suppressed, while the positive
band is intact. Vice versa, the reverse channel contains only
signal components covering the negative band.
The DSP implementation of the forward/reverse extrac-
tor is optimized in order to achieve accurate and fast pro-
cessing. Accuracy is guaranteed by floating point calculations
and by the large number of taps (127) of the FIR filter
implementing the Hilbert transform. With such a filter, the
undesired band in each output channel is attenuated by
at least 50 dB over 95% of the band. Before the Hilbert
transformer, a high-pass filter is inserted to attenuate the
clutter (low frequency) components embedded in arterial
wall and probe movements.
3. APPLICATION EXAMPLES
The flexibility of the MCMG system is here emphasised
through two application examples. One regards the detection
of micro-emboli in major cerebral arteries [10]. Their
detection is of clinical interest since it is known that
the majority of strokes are caused by emboli from distal
sites, blocking vessels in the brain. A second application
concerns the detection of arterial “distension,” that is, the
arterial diameter changes in response to the pressure change
produced during the cardiac cycle. This parameter is related
to the elasticity of the arterial wall and has been proven
to represent an important index for the early diagnosis of
atherosclerotic diseases [11].
3.1. Detection of microemboli in cerebral vessels
The basic principle of emboli detection is quite simple:
since an embolus is known to backscatter more power than
the surrounding blood, its presence can be revealed by
detecting the associate transient power increase. A major
issue is represented by the need of distinguishing real embolic
signals from artifacts due to, for example, transient noise or
probe movements. This issue can be solved by analysing the
Doppler signal simultaneously originated from different sites
of the same vessel or from different vessels. For example,
a probe movement is expected to produce a simultaneous,
similar effect on all detected signals, while a true embolic
event would concern only the SVs placed at a specific
location.
In this transcranial Doppler (TCD) application, the
MCMG system was configured to contemporaneously anal-
yse 4 SVs. A CT operation is here started every 4 milliseconds,
instead of the typical 20 milliseconds, to produce output
data at 250 fps. The samples collected in the most recent
128 PRIs from each selected SV are processed through 128-
point FFTs, and the resulting power spectra are colour-
coded and displayed in the classic spectrogram format [1].
Forward/reverse audio is calculated for each selected SV
through the processing described above.
The MCMG system tracks the signal power to search for
candidate embolic events. The trigger threshold is contin-
uously calculated, using as idle power the value estimated
for regions in which no event is detected. When an event is
detected, 2 seconds of data around the event are stored. The
software is arranged to manage several hours of continuous
monitoring. After the end of the session, recorded data
is processed through a neural network algorithm that,
correlating the 4 available traces, selects the true embolic
events.
In the test presented here, the probe was placed near
the temporal bone of a patient, after informed consent
was obtained. Due to the strong attenuation yielded by the
passage of US through the skull, long bursts (>10 cycles)
at low frequency (2 MHz) were transmitted to maintain an
acceptable S/N ratio at the receiver. The RX bandwidth was
accordingly reduced to hundreds of Hz, while the PRI was
set in the range 200 microseconds-1 millisecond to make the
analysis of deeply located SVs feasible.
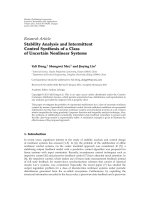
Figure 7 shows a sample real-time window obtained
by analysing the Doppler signals from SVs located at
depths of 30 mm, 44 mm, 51 mm, 56 mm, respectively. The
upper spectrogram is used as reference; the two central
spectrograms intercept the same vessel, while the bottom one
regards a second vessel producing a weak signal. An emboli
candidate event, producing transient high power only in the
central spectrograms, was detected at the time highlighted by
arrows.
3.2. Measurement of wall “distension” in
peripheral arteries
The physiologic maximum diameter change (distension) of
carotid arteries during systole is of approximately 600 μm,
about 10% of the diastolic diameter. Such a displacement,
comparable to the US wavelength, is not easily detectable
unless time-consuming 2D-autocorrelation techniques are
used [12].
The procedure for measuring the distension starts by
roughly locating the positions of the proximal and distal
artery walls. This can be obtained by tracing the power peaks
produced by the wall-blood discontinuity in the echo signal.
Unfortunately, such a measurement is not accurate enough
during all phases of the cardiac cycle. Thus, the signal from
the two selected depths is correlated over subsequent PRIs to
6 EURASIP Journal on Advances in Signal Processing
75070065060055050045040035030025020015010050
75070065060055050045040035030025020015010050
75070065060055050045040035030025020015010050
75070065060055050045040035030025020015010050
Figure 7: Display used in a 4-sonogram analysis implemented on the MCMG system for TCD applications. The arrows indicate a candidate
embolic event detected at a depth of about 50 mm from the probe.
54.543.532.521.510.50
t (s)
−0.5
−0.3
−0.1
0.1
0.3
0.5
Distension (mm)
(a)
54.543.532.521.510.50
t (s)
−0.5
−0.3
−0.1
0.1
0.3
0.5
Distension (mm)
(b)
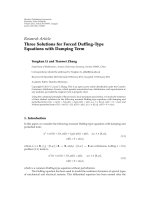
Figure 8: Distension waveforms measured in the carotid artery of
two volunteers aged 31 (a) and 65 (b) featuring a distensibility of,
respectively, 10% and 6%.
detect the local velocity, which is then integrated to calculate
the relative displacement.
The aforementioned method was implemented in the
DSP of the MCMG system and validated in [13]. Figure 8
reports the distension measured in the carotid artery of two
female healthy volunteers, aged 31 and 65, respectively. The
acquisitions, obtained with 200 microseconds PRI and a
5 MHz transducer, cover about 5 heart cycles in both cases,
featuring a good repeatability among different subsequent
cycles. In the younger volunteer (see Figure 8(a)), the carotid
diameter is about 7 mm and thus the distensibility, that is, the
maximum distension normalized with respect to the mean
vessel diameter) is 10%, while in the older the diameter is
7.5 mm and the distensibility results 6%. The diminished
distensibility assessed in the older volunteer is a physiological
effect of the reduced arterial elasticity typical of aging.
4. CONCLUSION
In this paper, an embedded system for real-time digital
processing of US signals has been presented. The system
is capable of transmitting arbitrary waveforms, simulta-
neously demodulating the echoes into multiple channels,
and processing the received data through programmable
algorithms. These features have been exploited in different
applications such as emboli detection [14], characterization
of contrast agents [15], arterial mechanics studies [16], and
hemodynamic assessments [17]. The system implementation
in a single electronic board makes it an ideal tool for any US
research activity needing flexible transmission and reception
strategies.
ACKNOWLEDGMENTS
This work has been supported by the EU Grant no. QLG-CT-
2002-01518 (UMEDS project) and by the Italian Ministry
of Education, University and Research (PRIN 2005). Special
thanks are due to David Evans for guidance in emboli
detection experiments.
REFERENCES
[1] D.H.EvansandW.N.McDicken,Doppler Ultrasound: Physics,
Instrumentation and Signal Processing,JohnWiley&Sons,
Chichester, UK, 2nd edition, 2000.
[2] H. F. Routh, “Doppler ultrasound,” IEEE Engineering in
Medicine and Biology Magazine, vol. 15, no. 6, pp. 31–40, 1996.
S. Ricci et al. 7
[3] A. P. Miller and N. C. Nanda, “Contrast echocardiography:
new agents,” Ultrasound in Medicine & Biology, vol. 30, no. 4,
pp. 425–434, 2004.
[4] T. Misaridis and J. A. Jensen, “Use of modulated excitation
signals in medical ultrasound—part I: basic concepts and
expected benefits,” IEEE Transactions on Ultrasonics, Ferro-
electrics, and Frequency Control, vol. 52, no. 2, pp. 177–191,
2005.
[5] K. Nightingale, M. S. Soo, R. Nightingale, and G. Trahey,
“Acoustic radiation force impulse imaging: in vivo demonstra-
tion of clinical feasibility,” Ultrasound in Medicine & Biology,
vol. 28, no. 2, pp. 227–235, 2002.
[6] Document S5V1 - S5V2, “Stratix Device Handbook,” January
2005, />[7] Document SPRS294B, “TMS320C6713 Floating Point Digital
Signal Processor,” October 2005, />[8] D. H. Simpson, C. T. Chin, and P. N. Burns, “Pulse inversion
Doppler: a new method for detecting nonlinear echoes
from microbubble contrast agents,” IEEE Transactions on
Ultrasonics, Ferroelectric s, and Frequency Control, vol. 46, no.
2, pp. 372–382, 1999.
[9] B. A. Coghlan and M. G. Taylor, “Directional Doppler
techniques for detection of blood velocities,” Ultrasound in
Medicine & Biology, vol. 2, no. 3, pp. 181–188, 1976.
[10] D. H. Evans, “Detection of microemboli,” in Transcranial
Doppler Ultrasonography, V. L. Babikian and L. R. Wechsler,
Eds., pp. 141–155, Butterworth Heinemann, Boston, Mass,
USA, 2nd edition, 1999.
[11] M. Knoflach, S. Kiechl, M. Kind, et al., “Cardiovascular risk
factors and atherosclerosis in young males: ARMY study
(atherosclerosis risk-factors in male youngsters),” Circulation,
vol. 108, no. 9, pp. 1064–1069, 2003.
[12] T. Loupas, J. T. Powers, and R. W. Gill, “An axial velocity
estimator for ultrasound blood flow imaging, based on a
full evaluation of the Doppler equation by means of a two-
dimensional autocorrelation approach,” IEEE Transactions on
Ultrasonics, Ferroelectric s, and Frequency Control, vol. 42, no.
4, pp. 672–688, 1995.
[13] T. Morganti, S. Ricci, F. Vittone, C. Palombo, and P. Tortoli,
“Clinical validation of common carotid artery wall distension
assessment based on multigate Doppler processing,” Ultra-
sound in Medicine & Biolog y, vol. 31, no. 7, pp. 937–945, 2005.
[14] L. Fan, E. Boni, P. Tortoli, and D. H. Evans, “Multigate tran-
scranial Doppler ultrasound system with real-time embolic
signal identification and archival,” IEEE Transactions on
Ultrasonics, Ferroelectric s, and Frequency Control, vol. 53, no.
10, pp. 1853–1861, 2006.
[15] H. J. Vos, F. Guidi, E. Boni, and P. Tortoli, “Method for
microbubble characterization using primary radiation force,”
IEEE Transactions on Ultrasonics, Ferroelectr ics, and Frequency
Control, vol. 54, no. 7, pp. 1333–1344, 2007.
[16] P. Tortoli, T. Morganti, G. Bambi, C. Palombo, and K. V.
Ramnarine, “Noninvasive simultaneous assessment of wall
shear rate and wall distension in carotid arteries,” Ultrasound
in Medicine & Biology, vol. 32, no. 11, pp. 1661–1670, 2006.
[17] P. Tortoli, V. Michelassi, G. Bambi, F. Guidi, and D. Righi,
“Interaction between secondary velocities, flow pulsation and
vessel morphology in the common carotid artery,” Ultrasound
in Medicine & Biology, vol. 29, no. 3, pp. 407–415, 2003.