Báo cáo hóa học: "Research Article Sequential and Adaptive Learning Algorithms for M-Estimation" ppt
Bạn đang xem bản rút gọn của tài liệu. Xem và tải ngay bản đầy đủ của tài liệu tại đây (1.25 MB, 13 trang )
Hindawi Publishing Corporation
EURASIP Journal on Advances in Signal Processing
Volume 2008, Article ID 459586, 13 pages
doi:10.1155/2008/459586
Research Article
Sequential and Adaptive Learning Algorithms
for M-Estimation
Guang Deng
Department of Electronic Engineering, Faculty of Science, Technology and Engineering, La Trobe University,
Bundoora, VIC 3086, Australia
Correspondence should be addressed to Guang Deng,
Received 1 October 2007; Revised 9 January 2008; Accepted 1 April 2008
Recommended by Sergios Theodoridis
The M-estimate of a linear observation model has many important engineering applications such as identifying a linear system
under non-Gaussian noise. Batch algorithms based on the EM algorithm or the iterative reweighted least squares algorithm have
been widely adopted. In recent years, several sequential algorithms have been proposed. In this paper, we propose a family of
sequential algorithms based on the Bayesian formulation of the problem. The basic idea is that in each step we use a Gaussian
approximation for the posterior and a quadratic approximation for the log-likelihood function. The maximum a posteriori
(MAP) estimation leads naturally to algorithms similar to the recursive least squares (RLSs) algorithm. We discuss the quality
of the estimate, issues related to the initialization and estimation of parameters, and robustness of the proposed algorithm. We
then develop LMS-type algorithms by replacing the covariance matrix with a scaled identity matrix under the constraint that the
determinant of the covariance matrix is preserved. We have proposed two LMS-type algorithms which are effective and low-cost
replacement of RLS-type of algorithms working under Gaussian and impulsive noise, respectively. Numerical examples show that
the performance of the proposed algorithms are very competitive to that of other recently published algorithms.
Copyright © 2008 Guang Deng. This is an open access article distributed under the Creative Commons Attribution License, which
permits unrestricted use, distribution, and reproduction in any medium, provided the original work is properly cited.
1.
INTRODUCTION
We consider a robust estimation problem for a linear observation model:
y = xT w + r,
(1)
where w is the impulse response to be estimated, { y, x} is the
known training data and the noise r follows an independent
and identical distribution (i.i.d.). Given a set of training data
{ yk , xk }k=1:n , the maximum likelihood estimation (MLE) of
w leads to the following problem:
n
wn = arg min
w
ρ rk ,
(2)
k=1
where ρ(rk ) = − log p(yk | w) is the negative log likelihood
function. The M-estimate of a linear model can also be
expressed as the above MLE problem when those welldeveloped penalty functions [1, 2] are regarded as generalized negative log-likelihood function. This is a robust
regression problem. The solution not only is an essential data
analysis tool [3, 4], but also has many practical engineering
applications such as in system identification, where the noise
model is heavy tailed [5].
The batch algorithms and the sequential algorithms are
two basic approaches to solve the problem of (2). The
batch algorithms include the EM algorithm for a family
of heavy-tailed distributions [3, 4] and iterative reweighted
least squares (IRLSs) algorithm for the M-estimate [2, 6].
In signal processing applications, a major disadvantage of
a batch algorithm is that when a new set of training
data is available the same algorithm must be run again
on the whole data. A sequential algorithm, in contrast to
a batch algorithm, updates the estimate as a new set of
training data is received. In recent years, several sequential
algorithms [7–9] have been proposed for the M-estimate of
a linear model. These algorithms are based on factorizing the
IRLS solution [7] and factorizing the so-called M-estimate
normal equation [8, 9]. These sequential algorithms can be
regarded as a generalization of recursive least squares (RLSs)
2
algorithm[10]. Other published works include robust LMStype algorithms [11–13].
Bayesian learning has been a powerful tool for developing
sequential learning algorithms. The problem is formulated as
a maximum a posteriori (MAP) estimate problem.The basic
idea is to break the sequential learning problem into two
major steps [14]. In the update step, an approximate of the
posterior at time n − 1 is used to obtain the new posterior
at time n. In the approximation step, this new posterior is
approximated by using a particular parametric distribution
family. There are many well-documented techniques such as
Laplace method [15] and Fisher scoring [16]. The variational
Bayesian method has also been studied [17, 18].
In a recent paper [19], we address this problem from
a Bayesian perspective and develop RLS-type and LMStype of sequential learning algorithms. The development is
based on using a Laplace approximation of the posterior
and solving the maximum a posteriori (MAP) estimate
problem by using the MM algorithm [20]. The development
of the algorithm is quite complicated. The RLS-type of
algorithm is further simplified as an LMS-type algorithm
by treating the covariance matrix as being fixed. This has
significantly reduced the computational complexity at the
cost of degraded performance.
There are two major motivations of this work which is
clearly an extension of our previous work [19]. Our first
motivation is to follow the same problem formulation as in
[19] and to explore an alternative and simpler approach to
develop sequential M-estimate algorithms. More specifically,
at each iteration, we use Gaussian approximation for the
likelihood and the prior. As such, we can determine a close
form solution of an MAP estimate sequentially when a
set of new training data is available. This MAP estimate
is in the similar form as that of an RLS algorithm. Our
second motivation is to extend the RLS-type algorithm to
the LMS-type algorithm with an adaptive step size. It is
well established that a learning algorithm with adaptive
step size usually outperforms those with fixed step size in
terms of faster initial learning rate and lower steady state
[21]. Therefore, instead of treating the covariance as being
fixed, as in our previous work, we propose to use a scaled
identity matrix to approximate the covariance matrix. The
approximation is subject to preserving the determinant of
the covariance matrix. As such, instead of updating the
covariance, the scaling factor is updated. The update of the
impulse response and the scaling factor thus constitute an
LMS-type algorithm with an adaptive step size. A major
contribution of this work is thus the development of new
sequential and adaptive learning algorithms. Another major
contribution is that performance of proposed LMS-type of
algorithms is very close to that of the RLS-type counterpart.
Since this work is an extension of our previous work
in which a survey of related works and Bayesian sequential
learning have already been briefly discussed, in this paper,
for brevity purpose, we have omitted the presentation of an
extensive literature survey. Interested readers can refer to [19]
and references therein for more information. The rest of this
paper is organized as follows. In Section 2, we present the
development of the proposed algorithm including a subopti-
EURASIP Journal on Advances in Signal Processing
mal solution. We show that the proposed algorithm consists
of an approximation step and a minimization step which lead
to the update of the covariance matrix and impulse response,
respectively. We also discuss the quality of the estimate, issues
related to the initialization and estimation of parameters, and
the relationship of the proposed algorithms with those of
our previous work. In Section 3, we first develop the general
LMS-type of algorithm. We then present three specific
algorithms, discuss their stability conditions and parameter
initiation. In Section 4, we present three numerical examples.
The first one evaluates the performance of the proposed RLStype of algorithms, while the second and the third evaluate
the performance of the proposed LMS-type of algorithms
under Gaussian and impulsive noise conditions, respectively.
A summary of this paper is presented in Section 5.
2.
DEVELOPMENT OF THE ALGORITHM
2.1.
Problem formulation
From the Bayesian perspective, after receiving n sets of
training data Dn = { yk , xk }|k=1:n, the log posterior for the
linear observation model (1) is given by
n
log p(rk ) + log p(w | H ) + c,
log p(w | Dn ) =
(3)
k=1
where p(w | H ) is the prior before receiving any training
data and H represents the model assumption. Throughout
this paper, we use “c” to represent a constant. The MAP
estimate of w is given by
wn = arg min − log p w | Dn .
w
(4)
Since the original M-estimation problem (2) can be
regarded as a maximum likelihood estimation problem, in
order to apply the above Bayesian approach, in this paper we
attempt to solve the following problem:
n
wn = arg min
w
1
ρ(rk ) + λwT w .
2
k=1
(5)
This is essentially a constrained MLE problem:
n
wn = arg min
w
ρ(rk ),
k=1
1
subject to wT w ≤ d.
2
(6)
Using the Lagrange multiplier method, the constrained MLE
problem can be recasted as (5), where λ is the Lagrange
multiplier and is related to the constant d. We can see that
both d and λ can be regarded as regularization parameters
which are used to control the model complexity. Bayesian
[22] and non-Bayesian [23] approaches have been developed
to determine regularization parameters.
We can see that the constrained MLE problem is equivalent to the MAP problem when we set log p(rk ) = −ρ(rk ) and
log p(w | H ) = −(1/2)λwT w. This is equivalent to regarding
the penalty function as the negative log likelihood and setting
a zero mean Gaussian prior for w with covariance matrix
Guang Deng
3
A0 = λ−1 I where I is an identity matrix. Therefore, in this
paper we develop a sequential M-estimation algorithm by
solving an MAP problem which is equivalent to a constrained
MLE problem.
Since we frequently use the three variables rn , en , and en ,
T
T
we define them as follows: rn = yn − xn w, en = yn − xn wn−1,
T w , where w
and en = yn − xn n
n−1 and wn are the estimates
of w at time n − 1 and n, respectively. We can see that rn is
the additive noise at time n, and en and en are the modelling
errors due to using wn−1 and wn as the impulse response at
time n, respectively.
2.2. The proposed RLS-type algorithms
To develop a sequential algorithm, we rewrite (3) as follows:
log p w | Dn = log p rn + log p w | Dn−1 + c,
(7)
where the term log p(w | Dn−1 ) is the log posterior at
time (n − 1) and is also the log prior at time n. The term
log p(rn ) = log p(yn | w) is the log-likelihood function. The
basic idea of the proposed sequential algorithm is that an
approximated log posterior is formed by replacing the log
prior log p(w | Dn−1 ) with its quadratic approximation. The
negative of the approximated log posterior is then minimized
to obtain a new estimate.
To illustrate the idea, we start our development from the
beginning stage of the learning process. Since the exact prior
distribution for w is usually unknown, we use a Gaussian
distribution with zero mean w0 = 0 and covariance A0 =
λ−1 I as an approximation. The negative log prior − log p(w |
H ) is approximated by J0 (w)
1
−
J0 (w) = (w − w0 )T A0 1 (w − w0 ) + c.
2
(8)
When the first set of training data D1 = { y1 , x1 } is received,
the negative log likelihood is − log p(y1 | w) = ρ(r1 ) and the
negative log posterior with the approximated prior, denoted
by P1 (w) = − log p(w | D1 ), can be written as
P1 (w) = ρ(r1 ) + J0 (w) + c.
(9)
This is the approximation step. In the minimization step, we
determine the minimizer of P1 (w), denoted by w1 , by solving
the equation ∇P1 (w1 ) = 0.
We then determine a quadratic approximation of P1 (w)
around w1 through the Taylor-series expansion:
1
−
P1 (w) = P1 (w1 ) + (w − w1 )T A1 1 (w − w1 ) + · · · , (10)
2
−
where P1 (w1 ) is a constant, A1 1 = ∇∇P1 (w) |w=w1 is
the Hessian evaluated at w = w1, and the linear term
[∇P1 (w1 )]T (w − w1 ) is zero since ∇P1 (w1 ) = 0. Ignoring
higher-order terms, we have the quadratic approximation for
P1 (w) as follows:
1
−
J1 (w) = (w − w1 )T A1 1 (w − w1 ) + c.
2
(11)
This is equivalent to using a Gaussian distribution to
approximate the posterior distribution p(w | D1 ) with
mean w1 and covariance A1 . In Bayesian learning, this is
well-known technique called Laplace approximation [15]. In
optimization theory [24], a local quadratic approximation of
the objective function is frequently used.
When we receive the second set of training data, we form
the negative log posterior, denoted P2 (w) = − log p(w | D2 ),
by replacing P1 (w) with J1 (w) as follows:
P2 (w) = ρ(r2 ) + J1 (w) + c.
(12)
The minimization step results in an optimal estimate w2 .
Continuing this process and following the same procedure, at time n, we use a quadratic approximation for
Pn−1 (w) and form an approximation of the negative log
posterior as
1
−1
Pn (w) = ρ(rn ) + (w − wn−1 )T An−1 (w − wn−1 ) + c, (13)
2
where wn−1 is optimal estimate at time n − 1 and is the
minimizer of Pn−1 (w). The MAP estimate at time n, denoted
by wn , satisfies the following equation:
−1
∇Pn (wn ) = −ψ en xn + An−1 wn − wn−1 = 0,
(14)
T
where ψ(t) = ρ (t) and en = yn − xn wn . Note that, rn in (13)
is replaced by en in (14) because w is replaced by wn . From
(14), it is easy to show that
wn = wn−1 + ψ en An−1 xn.
(15)
Since wn depends on ψ(en ), we need to determine en . LeftT
multiplying (15) by xn , then using the definition of en , we
can show that
T
en = en − ψ en xn An−1 xn,
(16)
T
where en = yn − xn wn−1 . Once we have determined en
from (16), we can calculate ψ(en ) and substitute it into (15).
We show in Appendix A that the solution of (16) has the
following properties: when en = 0, en = 0, when en =0,
/
|en | < |en | and sign(en ) = sign(en ).
Next, we determine a quadratic approximation for Pn (w)
around wn . This is equivalent to approximating the posterior
p(w | Dn ) by a Gaussian distribution with mean wn and the
covariance matrix An:
−
An 1 = ∇∇Pn (w) |w=wn
T
−1
= ϕ(en )xn xn + An−1 ,
(17)
where ϕ(t) = ρ (t). Using a matrix inverse formula, we have
the update of the covariance matrix for ϕ(en ) > 0 as follows:
An = An−1 −
T
An−1 xn xn An−1
.
T
1/ϕ(en ) + xn An−1 xn
(18)
If ϕ(en ) = 0, then we have An = An−1 .
If there is no closed form solution for (16), then we must
use a numerical algorithm [25] such as Newton’s method or a
4
EURASIP Journal on Advances in Signal Processing
Table 1: A list of some commonly used penalty functions and their first and second derivatives, denoted by ρ(x), ψ(x) = ρ (x) and ϕ(x) =
ρ (x), respectively.
ψ(x) = ρ (x)
ρ(x)
ρ(x) =
L2
Huber
Fair
⎧
⎪ 1 x2
⎪
⎪
,
⎨
2
x2
2σ 2
2σ
ρ(x) = ⎪
⎪ x
⎪ν| | − 1 ν2 ,
⎩
σ
2
ρ(x) = σ 2
ψ(x) =
x
x
− log 1 +
σ
σ
ψ(x) =
(19)
As such, the cost function Pn (w) is approximated by
1
w − wn−1
2
T
−1
An−1 w − wn−1 .
ϕ(x) =
x
σ
σ
ϕ(x) = ⎪
⎪ν
⎪ sign(x), | x | ≥ ν
⎩
σ
σ
fixed-point iteration algorithm to find a solution. This would
add a significant computational cost to proposed algorithm.
An alternative way is to seek a closed form solution by using
a quadratic approximation of the penalty function ρ(rn ) as
follows:
Pn (w) = ρ(rn ) +
x
σ2
⎧
⎪x
⎪ ,
⎪
⎨ 2
x
σ
x
| |≥ν
σ
| |≤ν
1
2
ρ(rn ) = ρ en + ψ en rn − en + ϕ en r − en .
2
ϕ(x) = ρ (x)
| |≤ν
(21)
An = An−1 −
T
An−1 xn xn An−1
,
T
1/ϕ(en ) + xn An−1 xn
(22)
respectively. Comparing (15) with (21), we can see that
using the quadratic approximation for ρ(rn ) results in
T
an approximation of ψ(en ) by ψ(en )/(1 + ϕ(en )xn An−1 xn ).
Comparing (18) with (22), we can see that the only change
due to the approximation is replacing ϕ(en ) by ϕ(en ).
In summary, the proposed sequential algorithm for a
particular penalty function can be developed as follows.
Suppose at time n, we have wn−1 , An−1 and the training data.
We have two approaches here. If we can solve (16) for en , then
we can calculate wn using (15) and update An using (18). On
the other hand, if there is no close form solution for en or the
solution is very complicated, then we can use (21) and (22).
2.3. Specific algorithms
In this section, we present three examples of the proposed
algorithm using three commonly used penalty functions.
These penalty functions and their first and second derivatives
ϕ(x) = 1 +
x
σ
x
| |≥ν
σ
| |≤ν
x
σ
−2
are listed in Table 1. These functions are shown in Figure 1.
We also discuss the robustness of these algorithms. To
simplify discussion, we use (21) and (22) for the algorithm
development.
2.3.1. The L2 penalty function
We can easily see that by substituting ψ(x) = x/σ 2 and
ϕ(x) = 1/σ 2 into (21) and (22), we have an RLS-type of
algorithm [19]:
en An−1 xn
,
T
σ 2 + xn An−1 xn
T
An−1 xn xn An−1
.
An = An−1 − 2
T
σ + xn An−1 xn
wn = wn−1 +
In Appendix B, we show that the optimal estimate and the
update of the covariance matrix are given by
ψ(en )An−1 xn
,
T
1 + ϕ(en )xn An−1 xn
σ
ϕ(x) = ⎪
⎪
⎪0,
⎩
x
1 + |x/σ |
(20)
wn = wn−1 +
⎧
⎪ 1
⎪ ,
⎪
⎨ 2
1
σ2
(23)
(24)
When σ 2 = 1, this reduced to a recursive least squares
algorithm [27]. One can easily see that the update of the
impulse response is proportional to |en |. As such, it is not
robust against impulsive noise which leads to a large value of
|en | and thus a large unnecessary adjustment.
We note that we have used an approximate approach to
derive (23) and (24). This is only used for the simplification
of the presentation. In fact, for an L2 penalty function
(23) and (24) can be directly derive from (15) and (18),
respectively. The results are exactly the same as (23) and (24).
2.3.2. Huber’s penalty function
By substituting the respective terms of ϕ(en ) and ψ(en ) into
(21) and (22), we have the following:
⎧
⎪
⎪wn−1 +
⎪
⎨
en An−1 xn
,
T
σ 2 + xn An−1 xn
wn = ⎪
ν
⎪
⎪w
⎩ n−1 + sign(en )An−1 xn ,
σ
⎧
⎪
⎨
An = ⎪
An−1 −
⎩A
n−1 ,
T
An−1 xn xn An−1
,
2 + xT A
σ
n n−1 xn
|en | ≤ λH
(25)
|en | > λH ,
|en | ≤ λH
|en | > λH ,
(26)
Guang Deng
5
ρ (x)
ρ(x)
0.5
ρ (x)
1
1.2
0.4
0.5
0.8
0
0.2
0.3
−0.5
0
−1
−0.5
0
0.5
1
−1
−1
−0.5
0
0.5
1
−0.2
−1
L2
Fair
Huber
L2
Fair
Huber
(a)
−0.5
0
0.5
1
L2
Fair
Huber
(b)
(c)
Figure 1: The three penalty functions and their first and second derivatives. We set σ = 1 and ν = 0.5 when plotting these functions.
where λH = νσ. Comparing (25) with (23), we can see that
when |en | ≤ λH they are the same. However, when |en | >
λH, indicating a possible case of outlier, (25) only uses the
sign information to avoid making large misadjustment. For
the update of the covariance matrix, when |en | ≤ λH , it is
the same as (24). However, when |en | > λH , no update is
performed.
2.3.3. The fair penalty function
We note that for the Fair penalty function, we have ψ(en ) =
ψ(|en |)sign(en ) and ϕ(|en |) = ϕ(en ). Substituting the
respective values of ψ(en ) and ϕ(en ) into (21) and (22), we
have the following two update equations:
wn = wn−1 + Φ en
sign en An−1 xn,
T
An−1 xn xn An−1
An = An−1 −
,
T
1/ϕ(|en |) + xn An−1 xn
(27)
where
Φ en
=
ψ en
.
T
1 + ϕ en xn An−1 xn
(28)
It is easy to show that for the Fair penalty function, we have
Φ
en
lim Φ en
|en |→∞
=
dΦ(|en |)
> 0,
d |e n |
=σ
(29)
(30)
Therefore, the value of Φ(|en |) is increasing in |en | and is
bounded by σ. As a result, the learning algorithm avoids
making large misadjustment when |en | is large. In addition,
the update for the covariance is controlled by the term
1/ϕ(|en |) which is increasing in |en |. Thus the amount of
adjustment decreases as |en | increases.
2.4.
Discussions
2.4.1. Properties of the estimate
Since in each step a Gaussian approximation is used for the
−
posterior, it is an essential requirement that An 1 must be
positive definite. We show that this requirement is indeed
satisfied. Referring to (17) and using the fact that ϕ(rn )
is nonnegative for the penalty functions considered [see
−
Table 1] and that A0 1 is positive definite, we can see that the
−
inverse of the covariance matrix A1 1 = ∇∇P1 (w) |w=w1 is
positive definite. Using mathematical induction, it is easy to
−
prove that An 1 = ∇∇Pn (w) |w=wn is positive definite.
In the same way, we can prove that the Hessian of the
objective function given by
T
−1
∇∇Pn (w) = ϕ(rn )xn xn + An−1
(31)
is also positive definite. Thus the objective function is strictly
convex and the solution wn is a global minimum.
Another interesting question is: does the estimate
improve due to the new data { yn , xn }? To answer this
question, we can study the determinant of the precision
−
matrix which is defined as |Bn | = |An 1 |. The basic idea is
that for a univariate Gaussian, the precision is the inverse
of the variance. A smaller variance is equivalent to a larger
precision which implies a better estimate. From (17), we can
write
−
Bn = An 1
T
−1
= ϕ en xn xn + An−1
= Bn−1
1+ϕ
T
en xn An−1 xn
(32)
,
−1
where we have used the substitution |Bn−1 | = |An−1 |. In
deriving the above results, we have used a matrix identity:
6
EURASIP Journal on Advances in Signal Processing
Table 2: The update equations of three RLS-type algorithms.
wn = wn−1 +
Proposed
ψ(en )An−1 xn
T
1 + ϕ(en )xn An−1 xn
−1
−
T
An 1 = An−1 + ϕ(en )xn xn
H ∞ [26]
wn = wn−1 +
An−1 xn
T
1 + xn An−1 xn
−1
−
T
An 1 = An−1 + xn xn − γs2 I
RLS [10]
wn = wn−1 +
An−1 xn
T
λ + xn An−1 xn
−1
T
A−1 = λAn−1 + xn xn (λ ≤ 1)
n
T
|A + xy T | = |A|(1 + y T A−1 x). Since xn An−1 xn > 0 and
ϕ(en ) ≥ 0 [see Table 1], we have |Bn | ≥ |Bn−1 |. It means that
For easy reference, we reproduce (40) and (44) in [19] as
follows:
the precision of the current estimate due to the new training
data is better than or at least as good as that of the previous
estimate. We note that when we use the update (18) for the
covariance matrix, the above discussion is still valid.
2.4.2. Parameter initialization and estimation
The proposed algorithm starts with a Gaussian approximation of the prior. We can simply set the prior mean as zero
w0 = 0 and set the prior covariance as A0 = λ−1 I, where I
is an identity matrix and λ is set to a small value to reflect
the uncertainty about the true prior distribution. In our
simulations, we set λ = 0.01. For the robust penalty functions
listed in Table 1, σ is a scaling parameter. We propose a
simple online algorithm to estimate σ as follows:
σn = βσn−1 + (1 − β) min 3σn−1 , en ,
(33)
where β = 0.95 in our simulations. The function min[a, b]
takes the smaller value of the two inputs as the output. It
makes the estimate of σn robust to outliers.
It should be noted that for a 0.95 asymptotic efficiency on
the standard normal distribution, the optimal value for σ can
be found in [2]. In addition, for Huber’s penalty function,
the additional parameter ν is set to ν = 2.69σ for a 0.95
asymptotic efficiency on the normal distribution [2].
2.4.3. Connection with the one-step MM algorithm [19]
Since the RLS-type of algorithm [see (21) and (22)] is derived
from the same problem formulation as that in our previous
work [19] and is based on different approximations, it is
interesting to compare the results. For easy reference, we
recall that in [19] we defined ρ(x) = − f (t) where t = x2 /2σ 2 .
It is easy to show that
ψ(x) = ρ (x) = −
x
f (t),
σ2
(34)
ϕ(x) = ρ (x) = −
1
2t f (t) + f (t) .
σ2
(35)
wn = wn−1 +
en An−1 xn
,
T
τ + xn An−1 xn
(36)
An = An−1 −
T
An−1 xn xn An−1
,
T
κτ + xn An−1 xn
(37)
where τ = −σ 2 / f (tn ), κτ = −σ 2 /[ f (tn ) + 2tn f (tn )], and
tn = e2 /(2σ 2 ). Substituting (34) into (36), we have the RLSn
type algorithm which is the one-step MM algorithm in terms
of ψ(en ) as the following:
wn = wn−1 +
en An−1 xn
,
T
en /ψ(en ) + xn An−1 xn
(38)
An = An−1 −
T
An−1 xn xn An−1
.
T
1/ψ(en ) + xn An−1 xn
(39)
We can easily see that (39) is exactly the same as (22). To
compare (38) with (21), we rewrite (21) as follows:
wn = wn−1 +
en /ψ en
en An−1 xn
. (40)
T
+ en ϕ en /ψ en xn An−1 xn
It is clear that (40) has an extra term en ϕ(en )/ψ(en ) compared
to (38). The value of this term depends on the penalty
function. For the L2 penalty function, this term equals to one.
2.4.4. Connections with other RLS-type algorithms
We briefly comment on the connections of the proposed
algorithm with that based on the H ∞ framework (see [26,
Problem 2]) and the classical RLS algorithm with a forgetting
factor [10]. For easy reference, the update equations for
these algorithms are listed in Table 2. Comparing these
algorithms, we can see that a major difference is in the way
−
An 1 is updated. The robustness of the proposed algorithm
is provided by the scaling factor ϕ(en ) which controls the
“amount” of update. Please refer to Figure 1 for a graphical
representation of this function. For the H ∞ -based algorithm,
2
an adaptively calculated quantity γs I (see [26, equation
(9)]) is subtracted from the update. This is another way of
controlling the “amount” update. For the RLS algorithm, the
forgetting factor plays the role of exponential-weighted sum
of squared errors. The update is not controlled based on the
Guang Deng
7
current modelling error. It is now clear that the term ϕ(en )
and the term λ play a very different role in their respective
algorithms.
It should be noted that by using the Bayesian approach,
it is quite easy to introduce the forgetting factor into the
proposed algorithm. Using the forgetting factor, the tracking
performance of the proposed algorithm can be controlled.
Since the development has been reported in our previous
work [19], we do not discuss it in detail in this paper.
A further interesting point is the interpretation of the
matrix An . For the L2 penalty function, An can be called
the covariance matrix. But for the Huber and fair penalty
function, its interpretation is less clear. However, when we
use a Gaussian distribution to approximate the posterior, we
can still regard it as a covariance matrix of the Gaussian.
Equations (44) and (45) can be regarded as the LMS-type of
algorithm with an adaptive step size.
In [28], a stability condition for a class of LMS-type of
algorithm is established as follows. The system is stable when
|en | < θ |en | (0 < θ < 1) is satisfied. We will use this
condition to discuss the stability of the proposed algorithms
in Section 3.2.
We point out that in developing the above update scheme
for 1/αn , we have assumed that w is fixed. As such, the
update rule cannot cope with a sudden change of w since
1/αn is increasing with n. This is inherent problem with the
problem formulation. A systematic way to deal with it is to
reformulate the problem to allow a time varying w by using
a state space model. Another way is to detect the change of w
and reset 1/αn to its default value accordingly.
3.
3.2.
EXTENSION TO LMS-TYPE OF ALGORITHMS
3.1. General algorithm
For the RLS-type algorithms, a major contribution to the
computational cost is the update of the covariance matrix. To
reduce the cost, a key idea is to approximate the covariance
matrix An in each iteration by An = αn I, where αn is
a positive scalar and I is an identity matrix of suitable
dimension. In this paper, we propose an approximation
under the constraint of preserving the determinant, that is,
|An | = |An |. Since the determinant of the covariance matrix
is an indication of the precision of the estimate, preserving
the determinant thus permits passing on information about
the quality of the estimate at time n to the next iteration. As
such, we have |An | = αM where M is the length of the impulse
n,
response. The task of updating An becomes updating αn .
From (17) and using a matrix identity |A+xyT | = |A|(1+
T A−1 x), we can see that
y
−
−1
An 1 = An−1
T
1 + ϕ en xn An−1 xn .
(41)
[Here we assume that the size of the matrix A and the sizes
of the two vectors x and y are properly defined]. Suppose,
at time n − 1,we have the approximation An−1 = αn−1 I.
Substituting this approximation into the left-hand side of
(41), we have
−
−1
An 1 ≈ An−1
T
1 + ϕ en xn An−1 xn
−M
T
= αn−1 1 + αn−1 ϕ en xn xn .
(42)
−
−
Substituting |An 1 | = αn M into (42), we have the following:
1
1
1/M
T
≈
1 + αn−1 ϕ en xn xn
.
(43)
αn
αn−1
Using a further approximation (1 + x)1/M ≈ 1 + x/M to
simply (43), we derive the update rule for αn as follows:
Replacing An−1
estimate
xT xn
1
1
=
+ ϕ en n .
(44)
αn
αn−1
M
in (21) by αn−1 I, we have the update of the
wn = wn−1 +
ψ en xn
.
T
1/αn−1 + ϕ en xn xn
(45)
Specific algorithms
Specific algorithms for the three penalty functions can be
developed by substituting ψ(en ) and ϕ(en ) into (44) and
(45). We note that the L2 penalty function can be regarded a
special case of the penalty functions used in the M-estimate.
The discussion of robustness is very similar to that presented
in Section 2.3 and is omitted. Details of the algorithms are
described below.
3.2.1. The L2 penalty function
Substituting ψ(en ) = en /σ 2 and ϕ(en ) = 1/σ 2 into (45), we
have
wn = wn−1 +
en xn
,
T
μn−1 + xn xn
(46)
where μn−1 = σ 2 /αn−1 . From (44), we have
xT xn
1
1
=
+ n ,
αn
αn−1 σ 2 M
(47)
which can be rewritten as follows:
μn = μn−1 +
T
xn xn
.
M
(48)
The proposed algorithm is thus given by (46) and (48). A
very attractive property of this algorithm is that it has no
parameters. We only need to set the initial value of μ0 which
can be set to zero (i.e., α0 →∞) reflecting our assumption that
the prior distribution of w is flat.
The stability of this algorithm can be established by
noting that
en =
μn−1
en .
T
μn−1 + xn xn
(49)
T
T
Since 0 < μn−1 /(μn−1 + xn xn ) < 1 when xn xn = 0, the stability
/
condition is satisfied.
8
EURASIP Journal on Advances in Signal Processing
3.2.2. Huber’s penalty function
In a similar way, we obtain the update for wn and μn as
follows:
⎧
en xn
⎪w
⎪ n−1 +
,
⎪
⎪
T
⎨
μn−1 + xn xn
|en | ≤ λH
⎪
⎪w
⎪ n−1 + νσ sign(en )xn ,
⎩
|en | > λH ,
wn = ⎪
(50)
μn−1
⎧
T
⎨μn−1 + xn xn /M,
μn = ⎩
|en | ≤ λH
|en | > λH
μn−1 ,
3.3.
(51)
where λH = νσ. The stability of the algorithm can be
established by noting that when |en | ≤ λH , we have
en =
μn−1
en .
T
μn−1 + xn xn
(52)
which is the same as the L2 case. One the other hand, when
|en | > λH , we can easily show that sign(en ) = sign(en ). As
such, from (50) we have for en = 0
/
en = e n −
νσ
T
sign en xn xn
μn−1
= en 1 −
νσ
μn−1 en
(53)
T
xn xn .
3.2.3. The fair penalty function
For the Fair penalty function, we define φ(t) = 1 + |t |/σ. We
have ψ(t) = t/φ(t) and ϕ(t) = 1/φ2 (t). Using (45), we can
write
e x
wn = wn−1 + n n ,
kF
(54)
T
where kF = φ(en )/αn−1 + xn xn /φ(en ). The update for the
precision is given by
T
1
1 xn xn
1
=
+ 2
.
αn
αn−1 φ (en ) M
(55)
A potential problem is that the algorithm may be unstable in
that the stability condition |en | < θ |en | may not be satisfied.
This is because
| e n | = δF | e n | ,
(56)
T
T
where δF = |1 − xn xn /kF |. We can easily see that when xn xn >
2kF , we have δF > 1 which leads to an unstable system.
To solve the potential instability problem, we propose to
replace kF in (54) by k which is defined as
kG ,
1 T
kF > xn xn
2
otherwise,
Initialization and estimation of parameters
In actual implementation, we can set μ0 = 0 which
corresponds to setting α0 →∞. In the Bayesian perspective,
this sets a uniform prior for w, which represents the
uncertainty about w before receiving any training data. To
enhance the learning speed of this algorithm, we shrink
the value of μn in the first N iterations, that is, μn =
T
β(μn−1 + (1/φ2 (en ))(xn xn /M)), where 0 < β < 1. An intuitive
justification is that μn is an approximation of the precision
of the estimate. In the L2 penalty function case, μn is scaled
by the unknown but assumed constant noise variance. Due
to the nature of the approximation that ignores the higher
order terms, the precision is overly estimated. A natural idea
is to scale the estimated precision μn . In simulations, we find
that β = 0.9 and N = 8M lead to improved learning speed.
For the Huber and the fair penalty functions, it is
necessary to estimate the scaling parameter σ. We use a
simple online algorithm to estimate σ as follows:
σn = γσn−1 + (1 − γ) en ,
T
Since sign(en ) = sign(en ), we have 0 ≤ 1 − (νσ/μn−1 |en |)xn xn
< 1. Thus the stability condition is also satisfied.
⎧
⎪
⎨k ,
F
k=⎪
⎩
T
where kG = 1/αn−1 + xn xn . We note that kG can be regarded
as a special case of kF when φ(en ) = 1. When k = kG, we can
T
show that δF = |1 − xn xn /kG | < 1. As a result, the system
is stable. On the other hand, when k = kF (implying kF >
T
T
(1/2)xn xn ), we can show that δF = |1 − xn xn /kF | < 1 which
also leads to a stable system.
(57)
(58)
where γ = 0.95 in our simulations. In addition, for
Huber’s penalty function, the additional parameter ν is set
to ν = 2.69σ for a 0.95 asymptotic efficiency on the normal
distribution [2].
4.
4.1.
NUMERICAL EXAMPLES
General simulation setup
To use the proposed algorithms to identify the linear
observation model of (1), at the nth iteration we generate
a zero mean Gaussian random vector xn of size (M × 1) as
the input vector. The variance of this random vector is 1.
We then generate the noise and calculate the output of the
system yn . The performance of an algorithm is measured by
h(n) = w − wn 2 which is a function of n and is called the
2
learning curve. Each learning curve is the result of averaging
50-run of the program using the same additive noise. The
purpose is to average out possible effect of the random input
vector xn . The result is then plotted in the log scale, that is,
10 log10 [h(n)], where h(n) is the averaged learning curve.
4.2.
Performance of the proposed RLS algorithms
We set up the following simulation experiments. The impulse
response to be identified is given by w = [0.1, 0.2, 0.3, 0.4,
0.5, 0.4, 0.3, 0.2, 0.1]T . In the nth iteration, a random input
signal vector xn is generated as xn = randn(9, 1) and yn
is calculated using (1). The noise rn is generated from a
mixture of two zero mean Gaussian distributions which
Guang Deng
9
−10
20
15
−15
10
−20
5
0
−25
−5
−10
−30
−15
−20
−35
0
500
1000
1500
2000
2500
3000
3500
4000
Figure 2: Noise signal used in simulations.
−40
−45
is simulated in Matlab by: rn = 0.1∗ randn(4000, 1) +
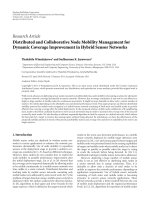
5∗ randn(4000, 1).∗ (abs(randn(4000,1) > T)). The threshold T controls the percentage of impulsive noise. In our
experiments, we set T = 2.5 which correspond to about 1.2%
of impulsive noise. A typical case for the noise used in our
simulation is shown in Figure 2
Since the proposed algorithms using Huber and fair
penalty functions are similar to the RLS algorithm, we compare their learning performance with that of the RLS and a
recently published RLM algorithm [8] using suggested values
of parameters. Simulation results are shown in Figure 3.
We observe from simulation results that the learning curves
of proposed algorithms are very close to that of the RLM
algorithm and are significantly better than that of the RLS
algorithm which is not robust to non-Gaussian noise. The
performance of the proposed algorithm in this paper is
also very closed to that of our previous work [19] and the
comparison results are not presented for brevity.
4.3. Performance of proposed LMS type of algorithms
We first compare the performance of our proposed LMStype of algorithms using the fair and Huber penalty functions
to a recently published robust LMS algorithm (called the
CAF algorithm in this paper) using the suggested settings
of parameters [13]. The CAF algorithm adaptively combines
the NLMS and the signed NLMS algorithms. As a bench
mark, we also include simulation results using the RLM
algorithm which is computationally more demanding than
any LMS type of algorithms. The noise used is similar to
that described in Section 4.2. We have tested these algorithms
with three different length of impulse responses M =
10, 100, 512. In each simulation, the impulse response is
generated as a zero-mean Gaussian random (M × 1) vector
with standard deviation of 1. Simulation results are shown in
Figure 4.
From this figure, we can see that the performance of
the two proposed algorithms is consistently better than that
of the CAF algorithm. The performance of the proposed
algorithm with the fair penalty function is also better than
that with the Huber penalty function. When the length of
the impulse response is moderate, the performance of the
proposed algorithm with the fair penalty function is very
close to that of the RLM algorithm. The latter has a notable
−50
−55
−60
0
1000
2000
Proposed-huber
Proposed-fair
3000
4000
RLS
RLM
Figure 3: A comparison of learning curves for different RLS-type
algorithms.
faster learning rate than the former when the length is 512.
Therefore, the proposed algorithm with the fair penalty
function can be a low computational-cost replacement of the
RLM algorithm for identifying an unknown linear system
with moderate length.
We now compare the performance of the proposed
LMS-type algorithm using the L2 penalty function with a
recently published NLMS algorithm with adaptive parameter
estimation [21]. This algorithm (see [21, equation (10)])
is called the VSS-NLMS algorithm in this paper. The VSSNLMS algorithm is chosen because its performance has
been compared to many other LMS-type of algorithms with
variable step sizes. We tune the parameter of the VSS-NLMS
algorithm such that it reach the lowest possible steady state
in each case. As a bench mark, we also include simulation
results using the RLS algorithm. We have tested these
algorithms with three different length of impulse responses
M = 10, 100, 512. In each simulation, the impulse response
is generated as a zero mean Gaussian random (M × 1) vector
with standard deviation of 1. We have also tested settings
with three different noise variances σr = 0.1, 0.5 and 1. We
have obtained similar results for all three cases. In Figure 5,
we present the steady state and the transient responses for
these algorithms under the condition σr = 0.5. We can see
that the performance of the proposed algorithm is very close
to that of the RLS algorithm for the two cases M = 10
and M = 100. In fact, these two algorithms converge to
almost the same steady state and the learning rate of the RLS
algorithm is slightly faster. For the case of M = 512, the
RLS algorithm, being a lot more computational demanding,
has a faster learning rate in the transient response than the
10
EURASIP Journal on Advances in Signal Processing
Steady state response M = 10
0
Transient response M = 10
0
−10
−20
−20
−40
−30
−40
−60
−50
−80
0
2
4
6
8
×104
−60
0
1
2
4
5
×103
(a)
(b)
Steady state response M = 100
0
3
Transient response M = 100
0
−10
−20
−20
−40
−30
−40
−60
−50
−80
0
2
4
6
8
×104
−60
0
2
4
8
10
×103
(c)
(d)
Steady state response M = 512
0
6
Transient response M = 512
0
−10
−20
−20
−40
−30
−40
−60
−50
−80
0
2
4
RLM
Proposed-fair
6
CAF
Proposed-huber
(e)
8
×104
−60
0
2
4
6
8
10
×103
RLM
Proposed-fair
CAF
Proposed-huber
(f)
Figure 4: A comparison of the learning performance of different algorithms in terms of the transient response (right panel of the figure) and
the steady state (left panel of the figure). Subfigures presented from top to bottom are results of testing different length of impulse response
M = 10, 100, 512. Legends for all subfigures are the same and are included only in the top-right sub-figure.
Guang Deng
11
Steady state response M = 10
10
Transient response M = 10
10
0
0
−10
−10
−20
−20
−30
−30
−40
−50
0
1
2
3
4
5
×103
−40
0
2
4
8
10
×102
(a)
(b)
Steady state response M = 100
20
6
Transient response M = 100
10
0
0
−10
−20
−20
−30
−40
−40
−60
0
2
4
6
8
10
×104
−50
0
2
4
8
10
×103
(c)
(d)
Steady state response M = 512
0
6
Transient response M = 512
0
−10
−10
−20
−20
−30
−30
−40
−40
−50
−60
0
2
4
6
Proposed
RLS
VSS-NLMS
8
10
×104
−50
0
2
4
6
8
10
×103
Proposed
RLS
VSS-NLMS
(e)
(f)
Figure 5: A comparison of the learning performance of different algorithms in terms of the transient response (right panel of the figure) and
the steady state (left panel of the figure). Subfigures presented from top to bottom are results of testing different length of impulse response
M = 10, 100, 512. Legends for all subfigures are the same and are included only in the top-right subfigure. We note that for the two cases
M = 10 and 100, the proposed algorithm converges to the almost the same level of steady state as that of the RLS algorithm.
12
EURASIP Journal on Advances in Signal Processing
proposed algorithm does. Comparing with the VSS-NLMS
algorithm, the performance of the proposed algorithm is
consistently better. Therefore, the proposed algorithm can be
a low computational-cost replacement for the RLS algorithm
for learning an unknown linear system of moderate length.
5.
CONCLUSION
In this paper, we develop a general sequential algorithm
for the M-estimate of a linear observation model. Our
development is based on formulating the problem from a
Bayesian perspective and using a Gaussian approximation for
the posterior and likelihood function in each learning step.
The sequential algorithm is then developed by determining
a maximum a posteriori (MAP) estimate when a new set of
training data is received. The Gaussian approximation leads
naturally to a quadratic objective function and the MAP
estimate is an RLS-type algorithm. We have discussed the
quality of the estimate, issues related to the initialization
and estimation of parameters, and the relationship of the
proposed algorithm with those of previous work. Motivated
by reducing computational cost of the RLS-type algorithm,
we develop a family of LMS-type algorithms by replacing the
covariance matrix with a scaled identity matrix. Instead of
updating the covariance matrix, we update the scalar which
is set to preserve the determinant of the covariance matrix.
Simulation results show that the learning performance of
the proposed algorithms is competitive to that of some
recently published algorithms. In particular, the performance
of proposed LMS-type algorithms has been shown to be very
close to that of their respective RLS-type algorithms. Thus
they can be replacements for RLS-type of algorithms at a
relatively low computational cost.
APPENDICES
A.
PROPERTIES OF e
Let us consider the solution to the following equation:
x = a − bψ(x).
(A.1)
Comparing it to (16), we can see that x = en , a = en , b =
T
xn An−1 xn (b > 0) and ψ(x) = ρ (x). We note that for the
penalty functions ρ(x) used for M-estimation, we have the
following: ψ(−x) = −ψ(x), ψ(0) = 0 and ψ(|x|) ≥ 0. Let
x0 be a solution of (A.1).We can easily see that when a = 0
the solution is x0 = 0. When a=0, we can rewrite (A.1) as
/
follows:
|x 0 | =
sign(a)
|a| − bψ(|x0 |).
sign(x0 )
(A.2)
The solution x0 must satisfy two conditions: sign(a) =
sign(x0 ) and |a| > bψ(|x0 |). These two conditions imply that
|x0 | < |a| which is same as |en | < |en |.
B.
DERIVATION OF EQUATIONS (21) AND (22)
Substituting (19) into (20) and taking the first derivative, we
have
∇Pn (w) = ψ en ) + ϕ en
−1
rn − en xn + An−1 (w − wn−1 ).
(B.1)
The update for wn is then determined by solving ∇Pn (w) =
0 as follows:
wn = wn−1 + ψ en + ϕ en en − en An−1 xn,
(B.2)
T
where we have replaced rn = yn −
by en = yn − xn wn .
T , then
Left multiplying both sides of the above equation by xn
subtracting both sides by yn , we obtain
T
xn w
en = e n −
T
ψ en xn An−1 xn
.
T
1 + ϕ en xn An−1 xn
(B.3)
Substitute en into (B.2), we have the update for wn given by
(21). The update of the covariance matrix An given by (22)
−
can be determined by using An 1 = ∇∇Pn (w) |w=wn , where
∇∇Pn (w) is given by
T
−1
∇∇Pn (w) = ϕ en xn xn + An−1.
(B.4)
REFERENCES
[1] P. J. Huber, Robust Statistics, John Wiley & Sons, New York,
NY, USA, 1981.
[2] W. J. J. Rey, Introduction to Robust and Quasi-Robust Statistical
Methods, Springer, Berlin, Germany, 1983.
[3] K. Lange and J. S. Sinsheimer, “Normal/independent distributions and their applications in robust regression,” Journal of
Computational and Graphical Statistics, vol. 2, no. 2, pp. 175–
198, 1993.
[4] A. Gelman, H. B. Carlin, H. S. Stern, and D. B. Rubin, Bayesian
Data Analysis, Chapman & Hall/CRC, Boca Raton, Fla, USA,
2004.
[5] S. A. Kassam and H. V. Poor, “Robust techniques for signal
proecssing: a survey,” Proceedings of the IEEE, vol. 73, no. 3,
pp. 433–481, 1985.
[6] P. Petrus, “Robust Huber adaptive filter,” IEEE Transactions on
Signal Processing, vol. 47, no. 4, pp. 1129–1133, 1999.
[7] K. L. Boyer, M. J. Mirza, and G. Ganguly, “Robust sequential
estimator: a general approach and its application to surface
organization in range data,” IEEE Transactions on Pattern
Analysis and Machine Intelligence, vol. 16, no. 10, pp. 987–
1001, 1994.
[8] S.-C. Chan and Y.-X. Zou, “A recursive least M-estimate
algorithm for robust adaptive filtering in impulsive noise:
fast algorithm and convergence performance analysis,” IEEE
Transactions on Signal Processing, vol. 52, no. 4, pp. 975–991,
2004.
[9] D. S. Pham and A. M. Zoubir, “A sequential algorithm for
robust parameter estimation,” IEEE Signal Processing Letters,
vol. 12, no. 1, pp. 21–24, 2005.
[10] S. Haykin, Adaptive Filter Theory, Prentice-Hall, Englewood
Cliffs, NJ, USA, 4th edition, 2002.
[11] W. A. Sethares, “The least mean square family,” in Adaptive
System Identification and Signal Processing Algorithms, N.
Kalouptsidis and S. Theodoridis, Eds., pp. 84–122, PrenticeHall, Englewood Cliffs, NJ, USA, 1993.
Guang Deng
[12] J. Chambers and A. Avlonitis, “A robust mixed-norm adaptive
filter algorithm,” IEEE Signal Processing Letters, vol. 4, no. 2,
pp. 46–48, 1997.
[13] J. Arenas-Garc´a and A. R. Figueiras-Vidal, “Adaptive combiı
nation of normalised filters for robust system identification,”
Electronics Letters, vol. 41, no. 15, pp. 874–875, 2005.
[14] M. Opper, “A Bayesian approach to online learning,” in Online
Learning in Neural Networks, D. Saad, Ed., pp. 363–378,
Cambridge University Press, Cambridge, UK, 1998.
[15] D. J. C. MacKay, Information Theory, Inference and Learning
Algorithms, Cambridge University Press, Cambridge, UK,
2003.
[16] T. Briegel and V. Tresp, “Robust neural network regression for
offline and online learning,” in Advances in Neural Information
Processing Systems 12, T. K. Leen, K.-R. Muller, and S. A. Solla,
Eds., pp. 407–413, MIT Press, Cambridge, Mass, USA, 2000.
[17] Z. Ghahramani and M. J. Beal, “Propagation algorithms
for variational Bayesian learning,” in Advances in Neural
Information Processing Systems, T. K. Leen, T. Dietterich, and
V. Tresp, Eds., vol. 13, pp. 507–513, MIT Press, Cambridge,
Mass, USA, 2001.
[18] A. Honkela and H. Valpola, “Online variational Bayesian
learning,” in Proceedings of the 4th International Symposium on
Independent Component Analysis and Blind Signal Separation
(ICA ’03), pp. 803–808, Nara, Japan, April 2003.
[19] G. Deng, “Robust sequential learning algorithms for linear
observation models,” IEEE Transactions on Signal Processing,
vol. 55, no. 6, pp. 2472–2485, 2007.
[20] D. R. Hunter and K. Lange, “A tutorial on MM algorithms,”
American Statistician, vol. 58, no. 1, pp. 30–37, 2004.
[21] H.-C. Shin, A. H. Sayed, and W.-J. Song, “Variable step-size
nlms and affine projection algorithms,” IEEE Signal Processing
Letters, vol. 11, no. 2, pp. 132–135, 2004.
[22] D. J. C. Mackay, “Bayesian interpolation,” Neural Computation, vol. 4, no. 3, pp. 415–447, 1992.
[23] M. J. L. Orr, “Recent advances in radial basis function
networks,” 1999, />.ps.gz.
[24] S. Boyd and L. Vandenberghe, Convex Optimization, Cambridge University Press, Cambridge, UK, 2004.
[25] M. T. Heath, Scientific Computing: An Introductory Survey,
McGraw-Hill, New York, NY, USA, 2nd edition, 2002.
[26] B. Hassibi and T. Kailath, “Adaptive filtering with an h-infinity
criterion,” in Proceedings of the 28th Asilomar Conference on
Signals, Systems and Computers (ACSSC ’94, pp. 1483–1487,
Pacific Grove, Calif, USA, October-November 1994.
[27] S. M. Kay, Fundamentals of Statistical Signal Processing Estimation Theory, Prentice-Hall, Englewood Cliffs, NJ, USA, 1993.
[28] S. C. Douglas and M. Rupp, “A posteriori update for adaptive
filters,” in Proceedings of the 31st Asilomar Conference on
Signals, Systems and Computers (ACSSC ’97), vol. 2, pp. 1641–
1645, Pacific Grove, Calif, USA, November 1997.
13