Báo cáo hóa học: " Optimization, Yield Studies and Morphology of WO3 Nano-Wires Synthesized by Laser Pyrolysis in C2H2 and O2 Ambients— Validation of a New Growth Mechanism" pdf
Bạn đang xem bản rút gọn của tài liệu. Xem và tải ngay bản đầy đủ của tài liệu tại đây (643.69 KB, 9 trang )
NANO EXPRESS
Optimization, Yield Studies and Morphology of WO
3
Nano-Wires
Synthesized by Laser Pyrolysis in C
2
H
2
and O
2
Ambients—
Validation of a New Growth Mechanism
B. W. Mwakikunga Æ A. Forbes Æ E. Sideras-Haddad Æ
C. Arendse
Received: 28 July 2008 / Accepted: 3 September 2008 /Published online: 25 September 2008
Ó to the authors 2008
Abstract Laser pyrolysis has been used to synthesize
WO
3
nanostructures. Spherical nano-particles were
obtained when acetylene was used to carry the precursor
droplet, whereas thin films were obtained at high flow-rates
of oxygen carrier gas. In both environments WO
3
nano-
wires appear only after thermal annealing of the
as-deposited powders and films. Samples produced under
oxygen carrier gas in the laser pyrolysis system gave a
higher yield of WO
3
nano-wires after annealing than the
samples which were run under acetylene carrier gas.
Alongside the targeted nano-wires, the acetylene-ran
samples showed trace amounts of multi-walled carbon
nano-tubes; such carbon nano-tubes are not seen in the
oxygen-processed WO
3
nano-wires. The solid–vapour–
solid (SVS) mechanism [B. Mwakikunga et al., J. Nanosci.
Nanotechnol., 2008] was found to be the possible mecha-
nism that explains the manner of growth of the nano-wires.
This model, based on the theory from basic statistical
mechanics has herein been validated by length-diameter
data for the produced WO
3
nano-wires.
Keywords Laser pyrolysis Á Tungsten trioxide Á
Nano-wires Á Growth mechanism
Introduction
Amongst many transition metal oxides, WO
3
has excellent
electro-chromic, gaso-chromatic and photo-chromatic
properties. At room temperature it adopts the distorted
monoclinic structure of ReO
3
[1]. For this reason, WO
3
has
been used to construct flat panel displays, photo–electro–
chromic ‘smart’ windows [2–4], writing–reading–erasing
optical devices [5, 6], optical modulation devices [7, 8], gas
sensors and humidity and temperature sensors [9–11]. Self
assembly of these materials has been achieved by hydro-
thermal techniques, additive-free hydrothermal means,
templating either with a polymer or pre-assembled carbon
nano-tubes, epitaxial growth, sol-gel, electro-chemical
means and hot-wire CVD methods. Recently, WO
3
nano-
rods produced by a facile chemical route and CVD have
been reported [12, 13] in this journal. In laser pyrolysis,
authors have reported synthesis of, for instance, ceramics,
silicon and silicon compounds, carbon compounds, olefins,
chromium oxides, diamond, fullerenes and many other
classes of materials. These experiments have largely been
performed at high laser powers and hence at high tem-
peratures. At such high levels, where anharmonicity cannot
be ruled out, laser pyrolysis is equivalent to traditional
pyrolysis with the photo-thermal process overwhelming the
B. W. Mwakikunga (&) Á C. Arendse
CSIR, National Centre for Nano-Structured Materials,
P.O. Box 395, Pretoria 0001, South Africa
e-mail:
B. W. Mwakikunga Á E. Sideras-Haddad
School of Physics, University of the Witwatersrand,
Private Bag 3, P.O. Wits 2050 Johannesburg, South Africa
B. W. Mwakikunga
Department of Physics and Biochemical Sciences,
University of Malawi, The Polytechnic, Chichiri,
Private Bag 303, Blantyre 0003, Malawi
A. Forbes (&)
CSIR National Laser Centre, P.O. Box 395, Pretoria 0001,
South Africa
e-mail:
A. Forbes
School of Physics, University of Kwazulu-Natal,
Private Bag X54001, Durban 4000, South Africa
123
Nanoscale Res Lett (2008) 3:372–380
DOI 10.1007/s11671-008-9169-6
photo-chemical one. However, it has long been realized
that even at low intensity, the CO
2
laser has successfully
been used in the synthesis of boron compounds from BCl
3
[14, 15]. At these low power values, the laser is used to
selectively excite the reactant to a relatively low vibra-
tional level from which a chemical reaction with other
reactants present is initiated. One expects to achieve
product formation distinctly different from that achieved
by traditional pyrolysis for the same chemical reaction
provided that the laser energy absorbed is channelled
mainly into the chemical process rather than into heating.
In this Letter, we report optimization of parameters that
led to the synthesis of WO
3
nano-spheres and thin films at
relatively low laser power (50 W in a 2.4-mm focal
region). We demonstrate the role of thermal annealing in
the conversion of the spheres and slabs into nano-wires.
We also show the morphological differences and yields
when carrier gases—C
2
H
2
or O
2
—are used during the
synthesis.
Experimental
Our laser pyrolysis experimental set up was fully described
in our previous publication [16]. Briefly, the method
involves injecting a stream of very fine droplets of a pre-
cursor solution into an infrared laser beam and depositing
the resulting aerosol onto a Corning glass substrate. A
wavelength tuneable continuous wave (cw) CO
2
laser was
used in the experiments (Edinburgh Instruments, model
PL6). By selecting a wavelength of 10.6 lm, the laser was
within, but not exactly on, the absorption region of the pre-
made precursor (WCl
6
in ethanol or tungsten ethoxide) for
the production of WO
3
. From the fact that (1) the excitation
wavelength of 10.6 lm is not exactly at the main resonance
peak of the W-ethoxide precursor of 9.44 lm and (2) the
laser power of 50 W (focussed into 2.4-mm beam diameter
at the waist) is not low enough to rule out anharmonic
effects in the excitation, the decomposition of this pre-
cursor could be due to both photochemical (resonance) and
photo-thermal (anharmonic) processes. The as-produced
materials showed decomposition of W-ethoxide into WO
3
nano-particles suggesting that the photo-chemical process
indeed occurred. Also worth describing here is the carrier
gas system which is accomplished by a three-way nozzle
having three concentric cylinders. The outer cylinder is
connected to an argon supply. The argon guides the aerosol
droplets which are carried by either C
2
H
2
(supposedly non-
reactive) or O
2
(highly reactive) gases interchangeably in
the middle and second cylinder. This is illustrated in Fig. 1.
An aliquot of 5.4 mg of dark blue powder of WCl
6
(Aldrich 99.99%) was dissolved in 500 mL of ethanol.
Since WCl
6
is highly reactive with air and moisture, its
dissolution was conducted in an argon atmosphere. Parti-
cles from this process were collected on Corning glass
substrates, placed on a rotating stage, at room temperature
and at atmospheric pressure. The particle deposition
showed a void at the centre (Fig. 1b) when the encapsu-
lating carrier gas flow-rate was higher than the carrier gas
driving the precursor droplets. When the flow-rates were
reversed, the deposition showed the profile of a hump
(Fig. 1a) showing there was more deposition at the centre
Fig. 1 Laser pyrolysis
illustration and the role of
carrier gas and precursor
relative flow-rates (a) when the
precursor flow-rate is larger
than the encapsulating carrier
gas (Ar) and (b) when the
precursor flow-rate is smaller
than the flow-rate of Ar. The
precursor is driven either by
C
2
H
2
or O
2
. The particle
deposition in (a) has profile of a
hump, whereas the deposition in
(b) has a vacancy at the centre
as indicated on the substrates
Nanoscale Res Lett (2008) 3:372–380 373
123
of the substrate than in periphery. This was found to be in
agreement with Bernoulli’s theorem, which requires that
there should be reduced pressure in fast flowing fluids.
When the flow rate of the central gas is larger, the pressure
is lower in this region and hence the droplets and the
particles (after laser pyrolysis) are trapped in this low
pressure region. Therefore there is high deposition at the
centre of the substrate and vice versa. Table 1 lists the
experimental procedures employed. The so-obtained sam-
ples were further annealed in argon atmosphere at 500 °C
for 17 h. Morphology studies were carried out using a Jeol
JSM-5600 scanning electron microscopy (SEM) micro-
scope, which was also equipped for energy dispersive
X-ray spectroscopy (EDX). In order to avoid charging
effects during SEM analysis, the samples were made con-
ductive by carbon/Au/Pd coating. Infrared and Raman
spectroscopy experiments on the as-obtained WO
3
are
reported elsewhere [17]. Structural studies were done using
a Philips Xpert powder diffractometer equipped with a
CuKa wavelength of 0.154184 nm. The experimental
procedure showed good reproducibility of results.
Lengths and corresponding diameters of the nano-wires
were measured by means of a software package Image-
Tool. As is the required procedure, calibration is initially
made against the marker of known length in both the image
scale and the real space scale. Then the distance between
two points is measured for each point with accuracy that
heavily depends on (1) the pixel density of the projecting
screen, (2) the random errors from operator’s hand and (3)
the magnification of the image.
Results
Laser pyrolysis of tungsten-based precursors, with C
2
H
2
as
carrier gas, shows remarkable differences in morphology
from when O
2
is the carrier gas as shown in Figs. 2 and 3.
The C
2
H
2
-synthesized sample has a lower yield of WO
3
nano-wires after annealing than the O
2
-synthesized one.
These nano-wires in O
2
-ran sample grow in the crevices of
the film. The C
2
H
2
-ran sample has nano-wires with a
higher aspect ratio than the O
2
-ran samples. Also the C
2
H
2
-
ran sample shows the presence of spherical micro-particles
where as complete absence of these spheres is observed in
the O
2
-ran sample. This means that C
2
H
2
maintains the
spherical shape of the precursor droplets, which is clear
evidence that C
2
H
2
is only a sensitizer of the process but
does not participate in the decomposition of the precursor.
Also, in the presence of tungsten, C
2
H
2
dissociates and
forms carbon structures such as carbon nano-tubes. It was
shown that vanadium surfaces can be used as catalysts for
the growth of carbon nano-tubes [18] from C
2
H
2
. On the
other hand, O
2
actively participates in the breakdown of the
precursor droplets and in the process increases the yield of
the WO
3
nano-wires at the expense of aspect ratio of the
wires in general. The O
2
-ran sample also has very brittle
thin films with cracks in a somewhat ordered manner. This
ordered cracking after annealing could be attributed to the
growth pressure (thermal stress) from the 1D nano-
structures.
The TEM micrograph of a typical wire grown from
O
2
-run WO
3
particles shown in Fig. 4b revealed a core-
shell structure (redrawn in Fig. 4c) with the WO
x
wire at
the core (EDS in Fig. 4a) and the carbon–Au–Pd composite
around the wire as a shell (EDS in Fig. 4e). C–Au–Pd is a
material used in the prior-to-SEM coating to improve
conduction for enhanced imaging. The shell is thicker on
one side than on the other; that is, the wire is not centred
through the C–Au–Pd wrapping. This shell served as a
contamination, which obscured the electron diffraction of
the wire so that the stoichiometry studies of the WO
x
nano-
wire could not be accomplished. In line with our previous
studies, we can speculate that the wire is WO
x
with x being
less than three due to oxygen loss during annealing even as
elaborated in chemical reactions of the type in Eq. 4.
In order to observe the growth of nano-wires, we soni-
cated a few spheres of WO
3
into iso-propanol and placed
them on carbon-holey Cu grid for in-situ annealing and
imaging in a Jeol CM200 transmission electron micro-
scope. A series of images, shown in Fig. 5, were taken
periodically of intervals of 45 min whilst heating at tem-
peratures ranging from 700 °C to 900 °C using a heating
device specially tailored for this microscope. The images
showed no indication of growth of one-dimensional
structures. This is attributed to the vacuum typical of TEM.
Any atoms that are sublimated from the spheres are
immediately removed by the high vacuum giving a very
small probability of condensing and growing into 1D nano-
structured geometry. However, the shrinking of the spheres
is an indication that the atoms are indeed evaporating from
the surface. However, not all sublimated atoms are
removed from their parent spheres; some return to make
Table 1 The experiment parameter used to obtain the WO
3
samples by laser pyrolysis
Sample Precursor Gas 1 (8 cm
3
/min) Gas 2 (8 cm
3
/min) Gas 3 variable Nano-wire yield Morphology
W1 WCl
6
? Ethanol O
2
Ar Ar High Slabs ? Rods
W2 WCl
6
? Ethanol C
2
H
2
Ar Ar Low Sphere ? Rod
374 Nanoscale Res Lett (2008) 3:372–380
123
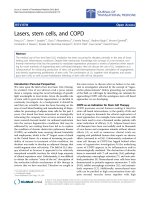
small mounds on the sphere surface making the sphere
rougher. The rate of sphere size reduction due to loss of
atoms is depicted in Fig. 5b. It is interesting to note that the
smaller sphere C shrank faster than the larger sphere B.
This means that wires grown from small spheres grow
faster than those that grow from large spheres.
For us to understand the novel growth of these nano-
wires, it is important to briefly review some related growth
mechanisms available in literature. Sir Frederick Frank
proposed the ‘screw dislocation theory’ in 1949. Central to
this dislocation theory were Polanyi, Orowan, Taylor,
Burger and Mott & Nabarro [19]. Defects and dislocation
in the initial crystals initiate one-dimensional growth;
‘‘ …the crystal face always has exposed molecular terraces
on which growth can continue, and the need for fresh 2D
nucleation never arises…’’ [ 19]. In 1964, detailed studies
on the morphology and growth of silicon whiskers by
Wagner & Ellis [20] led to a new concept of crystal growth
Fig. 2 Scanning electron
micrographs of WO
3
nano-rods
grown under oxygen as a central
carrier gas and C
2
H
2
as the
secondary carrier gas showing a
thin film that has flaked up into
orderly slabs between which are
numerous nano-wires. Inset (a)
shows a close look at the nano-
wires in between the slabs. Inset
(b) zooms in onto the nano-wire
area and inset (c) display one
nano-wire’s end
Fig. 3 Scanning electron
micrographs of WO
3
nano-rods
grown under C
2
H
2
as a central
carrier gas and oxygen as the
secondary carrier gas. The
spherical droplets from the
precursor maintain their shape
until their deposition into micro-
particles. Inset (a) is a micro-
particle before annealing
showing the genesis of the
growth of a nano-wire. After
annealing there are numerous
nano-wires growing from and in
between the spheres. Dotted box
(b) shows a region where a
number of nano-wires are seen
sprouting from spheres
Nanoscale Res Lett (2008) 3:372–380 375
123
from vapour, which was called the vapour–liquid–solid
(VLS) mechanism. The new growth mechanism was built
around three important facts: (a) silicon whiskers did not
contain an axial screw dislocation (b) an impurity was
essential for whisker growth and (c) a small globule was
always present at the tip of the whisker during growth.
From fact (a), it was clear that growth from vapour did not
occur according to Frank’s screw dislocation theory and
from, facts (b) and (c), it was important that a new growth
mechanism be studied.
In 1975, Givarzigozov [21] introduced the fundamental
aspects of the VLS mechanism. Emphasis was placed on
the dependence of the growth rate on the whisker diameter.
It was found that the growth rate decreased abruptly for
submicron diameters and vanished at some critical diam-
eter d
c
B 0.1 lm in accordance with the Gibbs–Thomson
effect. Basing on this effect, which states that the solubility
limit of a precipitate (b) in a matrix (a) varies with the
precipitate’s radius, Givarzigozov suggested that the
effective difference between the chemical potential of the
precipitate in the vapour phase and in the terminal pre-
cipitate [whisker], Dl, is given by
Dl ¼ Dl
0
À
4Kr
D
ð1Þ
Dl
0
is the difference at a plane boundary (when
diameter, D, of the precipitate tends to ?), K is the
atomic volume of the precipitate and r is the surface free
energy of the precipitate. The dependence of growth rate, G,
on the super-saturation (Dl/k
B
T) given by V = b(Dl/k
B
T)
n
,
where b and n are coefficients to be evaluated from
experimental data, was used to derive an expression
V
1=n
¼
Dl
0
k
B
T
b
1=n
À
4Kr
k
B
T
b
1=n
1
D
ð2Þ
The main characteristics of VLS mechanism are (1) the
presence of a catalyst and (2) direct proportionality of the
diameter of the nanostructure to the growth rate. Thick
whiskers grow longer than thinner ones because this
growth can be afforded by the continual supply of building
blocks in the CVD system. Plotting the growth rate, V,[21]
or terminal length l
?
[22] of the whisker versus D gives
curves with a positive ascent. A plot of V
1/n
versus 1/D
gives a straight line graph with a negative slope [21].
Recently, an in situ growth profile in real time for
tungsten oxide nano-wires was followed by Kasuya et al.
(2008) [23] by injecting ultra-small flow-rates of O
2
on a
heated tungsten surface placed on a scanning electron
microscope stage. It was difficult to ascertain if the length-
and-diameter data would be in agreement with the VLS
mechanism because the images were rather poor. This was
due to the poor vacuum caused by the intentional injection
of O
2
, which was useful for the targeted reaction. The
length of the nano-wire as a function time l(t) was found to
take the form of
ltðÞ¼l
0
1 Àexp ÀatðÞ½ ð3Þ
where l
0
is the final length and a is the growth or decay
coefficient.
We however study the final state of the fully grown WO
3
nanostructures. Our present length-diameter data for the
nano-wires could not agree with the above VLS theory for
two conflicting reasons: (1) no particular catalyst could be
identified with certainty (2) we found an inverse propor-
tionality between length and diameter of the nano-wires. It
was therefore important to study a new model to attempt to
explain the new findings. Since the production of solid-state
nano-wires is after annealing of the solid-state particles, the
mechanism of growth can neither be according to liquid-
based ‘‘Solution-Liquid-Solid’’ mechanism proposed by
Trenter and Buhro [24, 25] nor in line with the ‘‘Super-
Critical Fluid Synthesis’’ mechanism proposed by Holmes
Fig. 4 TEM image of a WO
3
nano-wires in (b) reveals that the wire
is a core with a shell of carbon, Au and Pd from prior-to-SEM coating
as confirmed by EDS in (a) and (e). Inset (c) is an illustration of the
core-shell structure of the WO
3
nano-wire and C/Au/Pd layer and (d)
is TEM image of carbon nanotubes found alongside the WO
3
nano-
wires
376 Nanoscale Res Lett (2008) 3:372–380
123
[26] and which has been later supported by Korgel and co-
workers [27]. These data certainly support our newly pro-
posed ‘‘Solid–Vapour–Solid (SVS)’’ mechanism reported in
our previous publication [28] where we reported solid-state
W
18
O
49
nano-tips produced by annealing solid-state WO
3
nano-spheres (prepared by ultrasonic spray pyrolysis) in
argon environment. Synthesis of solid materials from solid
precursors is not new. Solid-state reactions are very slow and
difficult to carry out to completion unless carried out at very
high temperatures where reacting atoms can diffuse through
solid material to the reaction front more easily. Transfor-
mation of one phase to another (with the same chemical
composition) can also occur in solid state, either at elevated
temperatures or elevated pressures (or both). For the growth
rate of many solid-state reactions (including tarnishing),
inter-diffusion of ions through the product layer increases the
thickness Dx parabolically with time (Dx)
2
µ t [29]. This is a
sharply different dependence from the Eq. 1 proposed by
Kasuya et al. [23] above. In some solid-state processes,
nucleation can be homogeneous. This is often the case for
thermal decomposition, for example, as is the case in the
current reactions
WO
3
spheres=
slabs
!
ÀÀÀÀÀÀÀÀÀÀÀÀÀÀ!
500
C; 17 h; Argon
WO
x
nanowiresðÞ
þ O
2
ð4Þ
In this Letter, we introduce for the first time the statistical-
mechanical aspects of this proposed SVS model and fit the
ensuing mathematical expressions to the data.
For the sake of simplicity, we consider the source of
molecules to be a solid sphere of radius R
0
, containing
Fig. 5 In situ TEM annealing
of WO
3
micro-spheres in
vacuum at 700–900 °C.
Micrographs were taken
periodically as shown in (a).
Note the variation of spheres A,
B and C and the enlargement of
space around these spheres as
time of annealing increases. The
variation of sphere diameter
with time for sphere B and C are
plotted in (b). Exponential
decay curves are fitted and show
that the smaller sphere C shrinks
faster than B
Nanoscale Res Lett (2008) 3:372–380 377
123
molecules of mass, M and assume the molecules to be
spherical of average molecular diameter, X. We assume
further that in changing the morphology from a sphere to a
wire, only the surface molecules can migrate from the
sphere to the newly forming wire or rod. For instance it has
been demonstrated [30] that the surface diffusive flux, J
S
of
atoms on a surface of a slab of length L given by J
S
=
-(dc/dx)$
0
L
D(y)dy is different from the more familiar bulk
diffusive flux written from the first Fick’s law as J
B
=
-D
B
(dc/dx)L where dc/dx is the concentration gradient. In
this case, transformation from sphere to rod takes place
layer after layer. The sphere shrinks but the as-forming rod
lengthens as illustrated in Fig. 6.
If the sphere is amorphous and the wire is crystalline as
normally observed experimentally, then the densities of the
material in the initial sphere and the final wire are different
and can be written, respectively, as q
am
and q
cryst
. The
number of atoms in the first layer of the sphere can
therefore be written as
N
surf
1
¼ 4pR
2
0
X
q
am
M
ð5Þ
If all these atoms assemble into a rod of diameter D and
length l
1
then the number of molecules in the rod can be
written in terms of length l
1
as
N
rod
1
¼
p
4
D
2
l
1
q
cryst
M
ð6Þ
However, not all the atoms in Eq. 5 end up making the
rod. The actual fraction that self-assembles into the rod is
proportional to the Boltzmann’s fraction, which depends on
the temperature T of the ambient given as
N
rod
1
N
surf
1
¼ exp À
E
A
k
B
T
ð7Þ
E
A
is the activation energy of the atoms.
After the first layer has assembled into the rod of length l
1
,
the next layer in the sphere has a radius of R
0
-X which forms
the next segment of the rod of length l
2
. The subsequent
layers have radii of R
0
- 2X, R
0
- 3X, R
0
- 4X, R
0
- 5X
and so forth. The ith layer will have a radius of R
0
-(i-1)X
such that the number of atoms in the ith layer is
N
surf
i
¼ 4pX
q
am
M
R
0
À i À1ðÞX½
2
ð8Þ
This corresponds to the number of atoms in the ith segment
of the rod of length l
i
given as
l
i
¼ 16
q
am
X
q
cryst
exp À
E
A
k
B
T
R
0
À i À1ðÞX½
2
1
D
2
ð9Þ
The total length of the wire is a summation of all the
segments of the wire emanating from each corresponding
layer in the source sphere.
l ¼ l
1
þ l
2
þ l
3
þ þ l
N
¼
X
N
i
l
i
¼ f
1
D
2
ð10Þ
where
f ¼ 16
q
am
X
q
cryst
exp À
E
A
k
B
T
X
N
i
R
0
À i À1ðÞX½
2
ð11Þ
Parameter f is a function of temperature T and also
depends on the geometry of the source of the atoms. The
higher the annealing temperature, T, the higher the slope, f.
This fact may mean that thinner nano-wires can be
obtained at higher annealing temperatures. But there must
be a lower limit to how thinner the nano-wires can get in
the SVS mechanism since at much higher temperatures all
solid-state starting material should evaporate away leaving
nothing to form the nano-wires with. These limits are yet to
be determined. The same question has been asked if there
is a thermo-dynamical lower limit to the nano-wires growth
by VLS [31]. It can be seen that if the source is equally
crystalline then the ratio of the densities in the source to the
final structure is unity. By quick inspection, one can see
that the geometry described by the summation in Eq. 11 is
proportional to the total surface area of all atomic or
molecular layers in the source. A plot of l versus 1/D
2
should be a positive straight line graph with a y-intercept of
zero and a slope of f. Similarly a plot of aspect ratios l/D
versus 1/D
3
is supposed to be a positive straight line going
through the origin and having the slope, f.
In the VLS mechanism, given a constant flux of mole-
cules in the source, a nano-wire that has a large diameter
will grow much longer compared to when it starts out with
a small diameter. In the SVS growth, the thinner the wire
the longer it is and vice versa as shown in the plots of
Fig. 7a. When aspect ratios, defined here as the ratio of
length to diameter, is plotted against diameter, the same
r = R
0
-
r = R
0
…
r = R
0
-2
t = t
0
t = t
1
t = t
2
t = t
n
0
1
n
2
…
0
1
0
1 2
n
Evaporation
Condensation
1
2
Fig. 6 Proposed schematic of the solid–vapour–solid mechanism of
growth of 1D nano-structure from a spherical layer of atoms in a tip
growth
378 Nanoscale Res Lett (2008) 3:372–380
123
profile is obtained (Fig. 7b). When length and aspect ratio
are plotted against 1/D
2
and 1/D
3
, respectively, in accor-
dance with Eq. 10, positive slopes are manifested (Fig. 8)
almost equal to each other as expected from the above
theory and of the order of * 10
-20
m
3
. This value is
related to the order of magnitude of the average volume of
the WO
3
nano-wires. It should be noted that reverse growth
from one-dimensional to spherical particles is also possible
at suitable annealing conditions. For instance, nano-belts of
Zn acetate were converted into aggregates of ZnO nano-
particles as reported in this journal [32].
Conclusion
In summary, liquid atomization and subsequent laser
pyrolysis were carried out using a CO
2
laser tuned at its
10P
20
line of wavelength 10.6 lm. SEM characterization
of the as-produced WO
3
samples showed that selective
photochemical reactions by the laser have a part to play in
initiating self assembly growth centres even without the
need for a catalyst. Self assembly is only continued by
further annealing. We have shown that oxygen carrier gas
gives a higher yield of WO
3
nano-wires by laser pyrolysis
than acetylene. The latter also shows trace amounts of
multi-walled carbon nano-tubes. The transmission electron
microscopy reveals that the nano-wires are core-shell
structures of a mixture of Au, Pd and C in the shell and
WO
3
at the core. The shell is due to the prior-to-SEM
coating to improve imaging. The absence of catalysts in
addition to the analysis of the nano-wire length-and-
diameter data has validated a new growth mechanism,
which we have called SVS growth as proposed earlier [28].
Acknowledgements Authors would like to thank Prof. Michael
Witcomb, Mr. Mthokozisi Masuku, Mr. Henk van Wyk and Ms.
Retha Rossouw. The South African Department of Science and
Fig. 7 Scatter plots of (a) length of the nano-wire versus the
corresponding diameter (b) aspect ratio versus diameter
Fig. 8 Scatter plots of (a) length versus 1/D
2
and (b) aspect ratio
(L/D) versus 1/D
3
. The linearized plots (a) and (b) have similar
slopes within experimental error as predicted by the current
theory [(6.22 ± 2.77) 9 10
-20
m
3
and (6.25 ± 0.831) 9 10
-20
m
3
,
respectively]
Nanoscale Res Lett (2008) 3:372–380 379
123
Technology (DST) project for the African Laser Centre, the National
Research Foundation (NRF), the DST/NRF Centre for Excellence in
Strong Materials and the CSIR National Centre for Nano-Structured
Materials are acknowledged.
References
1. P.A. Cox, Transition Metal Oxides: An Introduction to Their
Electronic Structure and Properties (Oxford University Press,
Oxford, 1992)
2. C.G. Granqvist, A. Azens, A. Hjelm, L. Kullman, G.A. Niklas-
son, D. Ro
¨
nnow et al., Sol. Energy 63, 199 (1998). doi:10.1016/
S0038-092X(98)00074-7
3. C.G. Granqvist, E. Avendano, A. Azens, Thin Solid Films 442,
201 (2003). doi:10.1016/S0040-6090(03)00983-0
4. A. Hoel, L.F. Reyes, P. Heszler, V. Lantto, C.G. Granqvist, Curr.
Appl. Phys. 4, 547 (2004). doi:10.1016/j.cap.2004.01.016
5. M. Bendahan, R. Boulmani, J.L. Seguin, K. Aguir, Sens. Actu-
ators 100, 320 (2004). doi:10.1016/j.snb.2004.01.023
6. R.F. Mo, G.Q. Jin, X.Y. Guo, Mater. Lett. doi:10.1016/
j.matlet.2006.12.061
7. Y. Shigaya, T. Nakayama, M. Aono, Sci. Technol. Adv. Mater. 5,
647 (2004). doi:10.1016/j.stam.2004.02.021
8. M. Gillet, K. Aguir, M. Bendahan, P. Mennini, Thin Solid Films
484, 358 (2005). doi:10.1016/j.tsf.2005.02.035
9. C. Bittencourt, R. Landes, E. Llobert, G. Molas, X. Correig,
M.A.P. Silva et al., J. Electrochem. Soc. 149, H81 (2002).
doi:10.1149/1.1448821
10. P. Ivanov, J. Hubalek, K. Malysz, J. Prasek, X. Vilanova, E.
Llobert et al., Sens. Actuators B 100, 293 (2004). doi:10.1016/
j.snb.2003.12.065
11. C.L. Dai, M.C. Liu, F.S. Chen, C.C. Wu, M.W. Chang, Sens.
Actuators B Chem. (2006). doi:10.1016/j.snb.2006.10.055
12. J. Rajeswari, P.S. Kishore, B. Viswanathan, T.K. Varadarajan,
Nanoscale Res. Lett. 2, 496 (2007). doi:10.1007/s11671-007-
9088-y
13. X.P. Wang, B.Q. Yang, H.X. Zhang, P.X. Feng, Nanoscale Res.
Lett. 2, 405 (2007)
14. H.R. Bachmann, H. Noth, R. Rinck, K.S. Kompa, Chem. Phys.
Lett. 29, 627 (1974). doi:10.1016/0009-2614(74)85107-9
15. C.M. Bowden, J.D. Stettler, N.M. Witriol, J. Phys. B Atom. Mol.
Phys. 10, 1789 (1977). doi:10.1088/0022-3700/10/9/028
16. B.W. Mwakikunga, A. Forbes, E. Sideras-Haddad, R.M. Eras-
mus, G. Katumba, B. Masina, Int. J. Laser Nanoparticles (2008)
(in press)
17. B.W. Mwakikunga, E. Sideras-Haddad, A. Forbes, C. Arendse,
Phys. Status Solidi 205, 150 (2008). doi:10.1002/pssa.200776829
18. J.W. Seo, K. Hernadi, C. Miko, L. Forro, Appl. Catal. Gen. 260,
87 (2004). doi:10.1016/j.apcata.2003.10.003
19. F.C. Frank, Discuss Faraday Soc. 5, 48 (1949). doi:10.1039/
df9490500048
20. R.S. Wagner, W.S. Ellis, Appl. Phys. Lett. 4, 89 (1964).
doi:10.1063/1.1753975
21. E.I. Givargizov, J. Cryst. Growth 31, 20 (1975). doi:10.1016/
0022-0248(75)90105-0
22. J. Kikkawa, Y. Ohno, S. Takeda, Appl. Phys. Lett. 86, 123109-1
(2005). doi:10.1063/1.1888034
23. K. Kasuya, T. Ooi, Y. Kojima, M. Nakao, Appl. Phys. Express 1,
034005 (2008). doi:10.1143/APEX.1.034005
24. T.J. Trenter et al., Science 270, 1791 (1995). doi:10.1126/
science.270.5243.1791
25. W. Buhro, Adv. Mater. Opt. Electron. 6, 175 (1996). doi:10.1002/
(SICI)1099-0712(199607)6:4\175::AID-AMO236[3.0.CO;2-C
26. J.D. Holmes et al., Chem. Eur. J. 9, 2144 (2003). doi:10.1002/
chem.200204521
27. T. Hanrath, B. Korgel, Adv. Mater. 5, 15 (2003)
28. BÁW. Mwakikunga, E. Sideras-Haddad, C. Arendse, M.J. Wit-
comb, A. Forbes, J. Nanosci. Nanotechnol. (2008) (in press)
29. S. Elliot, The Physics of Chemistry of Solids (Wiley, Chichester,
2000)
30. J.B. Hudson, Surface Science—An Introduction (Butterworth-
Heinemann, Boston, 1992)
31. T.Y. Tan, N. Li, U. Gosele, Appl. Phys. Lett. 83, 1199 (2003).
doi:10.1063/1.1599984
32. Y. Zhang, F. Zhu, J. Zhang, L. Xia, Nanoscale Res. Lett. 3, 201
(2008). doi:10.1007/s11671-008-9136-2
380 Nanoscale Res Lett (2008) 3:372–380
123