Báo cáo hóa học: " Cu-Doping Effects in CdI2 Nanocrystals: The Role of Cu-Agglomerates" potx
Bạn đang xem bản rút gọn của tài liệu. Xem và tải ngay bản đầy đủ của tài liệu tại đây (288.38 KB, 4 trang )
NANO PERSPECTIVES
Cu-Doping Effects in CdI
2
Nanocrystals: The Role
of Cu-Agglomerates
M. Idrish Miah
Received: 12 September 2008 / Accepted: 11 November 2008 / Published online: 22 November 2008
Ó to the authors 2008
Abstract Cu-doping effects in CdI
2
nanocrystals are
studied experimentally. We use the photostimulated second
harmonic generation (PSSHG) as a tool to investigate the
effects. It is found that the PSSHG increases with
increasing Cu content up to 0.6% and then decreases due to
the formation of the Cu-agglomerates. The PSSHG for the
crystal with Cu content higher than 1% reduces to that for
the undoped CdI
2
crystal. The results suggest that a crucial
role of the Cu-metallic agglomerates is involved in the
processes as responsible for the observed effects.
Keywords Nanocrystals Á Defects Á Surface properties Á
Electron–phonon interaction
Introduction
Nonlinear spectroscopy and photostimulated second har-
monic generation (PSSHG) are the two important tools to
investigate the higher-order nonlinear optical processes, in
particular, in semiconductors [1]. The PSSHG is prevented
by symmetry in a centrosymmetric material process. So, in
order to observe the PSSHG, one needs to have a
noncentrosymmetric process. Fortunately, there are differ-
ent ways to enhance the PSSHG. These include (1) the
reduction of the size of the crystals to the nanometer scale,
(2) lowering the crystal temperature and (3) insertion of
suitable impurities into the crystal with an appropriate
amount [1]. The nanometer-sized crystals take into account
the quantum-confined effect (quantum confinement domi-
nates the material’s electronic and optical properties),
where k-space bulk-like dispersion disappears and discrete
excitonic-like nanolevels occur within the forbidden
energy gap.
CdI
2
single crystals are indirect and wide-bandgap
semiconductors having layered structure, space group C
4
6v
,
with highly anisotropic chemical bonds. The band structure
calculations of the CdI
2
crystals have also shown [2–4]a
large anisotropy in the space charge density distribution
causing high anisotropy in the corresponding optical
spectra. The anisotropic behaviour of the CdI
2
crystals
favours the local noncentrosymmetry, making them be able
for the PSSHG investigations.
Experimental as well as theoretical investigations per-
formed in pure CdI
2
single crystals in the last few years
using nonlinear spectroscopy have shown that CdI
2
pos-
sesses higher-order optical nonlinearities [5–8]. An
investigation for the magnetic field stimulated ferroelec-
tricity in CdI
2
–Cu has also been reported [9]. However, this
measurement was preliminary performed a decade ago and
the most recent report for this system is rare [10, 11].
Here we study Cu-doping effects in CdI
2
nanocrystals
experimentally. We use the photostimulated second har-
monic generation (PSSHG) as a tool to investigate the
effects. It is found that the PSSHG increases with
increasing Cu content up to 0.6% and then decreases due to
the formation of the Cu-agglomerates, suggesting that a
crucial role of the Cu-metallic agglomeration is involved in
M. I. Miah (&)
Nanoscale Science and Technology Centre, Griffith University,
Nathan, Brisbane, QLD 4111, Australia
e-mail: m.miah@griffith.edu.au
M. I. Miah
School of Biomolecular and Physical Sciences, Griffith
University, Nathan, Brisbane, QLD 4111, Australia
M. I. Miah
Department of Physics, University of Chittagong, Chittagong
4331, Bangladesh
123
Nanoscale Res Lett (2009) 4:187–190
DOI 10.1007/s11671-008-9215-4
the processes. The PSSHG for the crystal with Cu content
higher than 1% reduces to that for the undoped CdI
2
crystal.
Experimental Details
Investigated samples are taken from 0.8 to 10 nm thick
crystals of CdI
2
doped with Cu as well as undoped.
Cu-doped CdI
2
nanocrystals were synthesized from the
mixture of CdI
2
and CuI using standard Bridgman-Stock-
barger method. Structure was monitored using an X-ray
diffractometer and the homogeneity was controlled using a
polarimeter. The nanocrystal sample thickness was con-
trolled using a radio-frequency interferometer, using
conventional fringe-shift technique as discussed in details
in Ref. [12]. The investigation was performed at liquid
nitrogen temperature by mounting the samples in temper-
ature-regulated cryostat. We used a Nd:YAG laser, as a
fundamental laser for the PISHG, which generates pico-
second pulses (average power 15 MW) with a repetition
rate of 80 mHz. The output PSSHG (k = 530 nm) and
fundamental (k = 1,060 nm) signals were spectrally sep-
arated by a grating monochromator with a spectral
resolution of *5nmmm
-1
. Detection of the doubled-
frequency (in the green spectral region) output PSSHG
signal was performed by a photomultiplier (with time
resolution about 0.5 ns), with an electronic boxcar inte-
grator (EBI) for the registration of the output. During
evaluation of the time-delayed nonlinear optical response,
we measured the light intensities at the fundamental (x)
and doubled-frequencies (2x) with time steps of *50 fs
using the EBI in the time-synchronized pump-probe con-
ditions. The second-order effective susceptibilities were
calculated using the relation [13]:
I 2x; tðÞ¼
2l
3=2
0
e
À3=2
0
x
2
l
2
A
v
2
ijk
I
2
x; t À sðÞ
n 2xðÞn
2
xðÞ
sin
lDktðÞ
2
lDktðÞ
2
"#
2
;
where l is the length of the nonlinear medium, i.e. the
crystal thickness, l
0
and e
0
are the magnetic and dielectric
static (in vacuum) susceptibilities, respectively, A is the
area of the pumping beam which processes Gaussian-like
form, n(x) and n(2x) are, respectively, the refractive
indices for the pumping and PSSHG doubled frequencies,
v
ijk
are the components of the second-order nonlinear
optical susceptibility determined from different angle of
the incident light and Dk ¼ k 2xðÞÀ2k xðÞis phase
matching wave vector factor defined by photostimulated
birefringence. The light intensities of the time-dependent
pumping I(x,t) and frequency doubled PSSHG signals
I(2x,t - s) were measured for different times (t) of pulse
duration and for different delaying times (s).
Results and Discussion
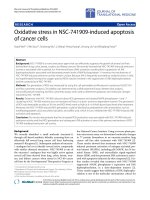
The pumping power density dependence of the PSSHG
signal was measured. Figure 1 shows the results for a
crystal (0.8 nm). As can be seen, the PSSHG increases with
increasing power density and then decreases to a value a
little higher than background after reaching a maximum.
The PSSHG dependence also shows a beginning of slight
increase. However, a significant enhancement in PSSHG
occurs for the nanocrystal. The qualitative and quantitative
changes that occurred for the nanocrystal correspond to the
manifestation of the quantum-confined excitonic levels
perpendicular to the layer.
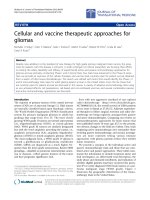
Figure 2 shows the pump-probe delay dependence of the
PSSHG signal for a typical sample (1.2 nm; 0.8% Cu). As
can be seen, the relaxation time of the signal is relatively
large. Such a relaxation time is typically for the relaxation
of a particular layer in layered crystals, where a significant
contribution from the interlayer rigid phonons might be
involved [14]. The relatively large relaxation time
observed in the PSSHG pulses demonstrates the principal
role of long-lived electron–phonon states in the observed
effects explained within a model of photostimulated elec-
tron–phonon anharmonicity [15], where the relaxation time
for the thin nanolayers should be larger than for the strong
localized electron–phonon states due to the nanosized
effects.
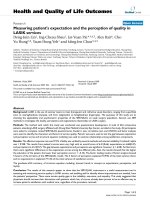
The second-order susceptibility determining the PSSHG
as a function of sample thickness for a doped sample
(0.8 %) is shown in Fig. 3. As can be seen, the PSSHG
decreases with increasing the thickness of the crystal, and
for the thickness higher than 10 nm, the PSSHG reduces to
that for the undoped crystal (Fig. 4), demonstrating that a
significant enhancement is achieved for the 0.8 nm thick
crystal.
Power density (TW m
-2
)
0.0 0.1 0.2 0.3 0.4 0.5 0.6
PSSHG signal (arb. unit)
-4
0
4
8
12
16
20
Fig. 1 Pumping power density dependence of the PSSHG signal for a
sample
188 Nanoscale Res Lett (2009) 4:187–190
123
Figure 5 shows the second-order susceptibility as a
function of Cu-doping density for a sample with crystal
thickness 2.5 nm. The second-order susceptibility depen-
dence of the Cu-doping density for a thin sample (0.8 nm)
is shown in Fig. 6. From Figs. 5 and 6 one can see that with
increasing Cu content up to 0.6% the PSSHG significantly
increases. For the Cu content 0.6% the PSSHG achieves its
maximum for a crystal with thickness 0.8 nm. The inser-
tion of the Cu impurities favours a stronger local electron–
phonon interaction, particularly its anharmonic part,
through the alignment of the local anharmonic dipole
moments by the pumping light [9]. As a particular role of
the local electron–phonon anharmonicity is described by
third-order rank tensors in disordered systems [10], the
PSSHG is very similar to that introduced for the third-order
nonlinear optical susceptibility, which has been confirmed
by observing the relatively large third-order susceptibility
of undoped CdI
2
single crystals [7]. The local disordering
of the Cu agglomerates plays additional role in the nano-
size-confined effects.
The PSSHG is found to be decreased for Cu density
higher than 0.6%. This decrease of PSSHG with increasing
Cu content is caused by agglomeration of the Cu impurities
that is typical of such kinds of layered crystals. As dem-
onstrated earlier [9], this can be understood in terms of the
agglomerate chemistry. The creation of the Cu agglomer-
ates favours a reduction in the active electron–phonon
centres, effectively contributing to the noncentrosymmetry
of the output charge density, as well as leads to the
occurrence of metallic clusters which additionally scatter
light, and consequently, suppresses the effect at higher Cu
content through the limitation of the enhancement of the
local hyperpolarizability for the Cu agglomerate as well as
the corresponding nonlinear dielectric susceptibility. From
the above analysis, one can conclude that a crucial role of
ττ
(s)
0.00 0.02 0.04 0.06 0.08 0.10
PSSHG signal (arb. unit)
0
2
4
6
8
Fig. 2 Pump-probe delay dependence of the PSSHG for a typical
sample
Thickness (nm)
2.0 4.0 6.0 8.0 10.0
Tensor element (pm/V)
0.3
0.4
0.5
0.6
0.7
0.8
Fig. 3 Second-order susceptibility as a function of sample thickness
for a doped sample
Thickness (nm)
2.0 4.0 6.0 8.0 10.0
Susceptibility (pm/V)
0.30
0.35
0.40
0.45
0.50
Fig. 4 Second-order susceptibility as a function of sample thickness
for the undoped sample
Cu doping (%)
0.0 0.2 0.4 0.6 0.8 1.0
Susceptibility (pm/V)
0.36
0.38
0.40
0.42
0.44
0.46
0.48
0.50
Fig. 5 Second-order susceptibility as a function of Cu-doping density
for a sample with thickness 2.5 nm
Nanoscale Res Lett (2009) 4:187–190 189
123
the metallic agglomerates was involved in the processes
and was responsible for the observed effects.
Conclusions
Cu-doping effects in CdI
2
nanocrystals were studied
experimentally using the PSSHG and the chemistry
responsible for the effects discovered. It was found that the
PSSHG increases with increasing Cu content up to 0.6%
and then decreases due to the formation of the Cu-
agglomerates, suggesting that a crucial role of the metallic
agglomerates was involved in the processes. The PSSHG
for the crystal with Cu content higher than 1% was found to
be reduced to that for the undoped CdI
2
crystal.
References
1. W.E. Born (ed.), Ultrashort Processes in Condensed Matter
(Plenum Press, New York, 1993)
2. J. Bordas, J. Robertson, A. Jakobsson, J. Phys. C 11, 2607 (1978)
3. J. Robertson, J. Phys. C 12, 4753 (1979)
4. Ya.O. Dovgii, I.V. Kityk, Yu.M. Aleksandrov, V.N. Kolobanov,
V.N. Machov, V.V. Michailin, J. Appl. Spectrosc. 43, 1168
(1985). doi:10.1007/BF00662338
5. F. Adducci, I.M. Catalano, A. Cingolani, A. Minafra, Phys. Rev.
B 15, 926 (1977). doi:10.1103/PhysRevB.15.926
6. I.M. Catalano, A. Cingolani, R. Ferrara, M. Lepore, Helv. Phys.
Acta 58, 329 (1985)
7. M.I. Miah, Opt. Mater. 18, 231 (2001). doi:10.1016/S0925-
3467(01)00168-9
8. M.I. Miah, Opt. Mater. 25, 353 (2004). doi:10.1016/j.optmat.
2003.08.007
9. I.V. Kityk, S.A. Pyroha, T. Mydlarz, J. Kasperczyk, M. Czer-
winski, Ferroelectrics 205, 107 (1998). doi:10.1080/00150199808
228391
10. V. Bondar, Mater. Sci. Eng. B 71, 258 (2000). doi:10.1016/
S0921-5107(99)00386-4
11. H. Ollafsson, F. Stenberg, Opt. Mater. 25, 341 (2004). doi:10.1016/
j.optmat.2003.08.010
12. I.V. Kityk, Z. Prikl, Spektrosck 42, 487 (1985)
13. C.C. Devis, Laser and Electro-Optics, Fundamentals and Engi-
neering (Cambridge University Press, New York, 1985)
14. S.A. Pyroha, S. Metry, I.D. Olekseyuk, I.V. Kityk, Funct. Mater.
7, 209 (2000)
15. J.V. McCanny, R.H. Williams, R.B. Murray, P.C. Kemeny,
J. Phys. C: Solid State Phys. 10, 4255 (1977). doi:10.1088/0022-
3719/10/21/014
Cu-doping (%)
0.0 0.2 0.4 0.6 0.8 1.0 1.2
Susceptibility (pm/V)
0.4
0.5
0.6
0.7
Fig. 6 Second-order susceptibility as a function of Cu-doping density
for a thin sample
190 Nanoscale Res Lett (2009) 4:187–190
123