Báo cáo hóa học: " Effect of Growth Temperature on Bamboo-shaped Carbon–Nitrogen (C–N) Nanotubes Synthesized Using Ferrocene Acetonitrile Precursor" pot
Bạn đang xem bản rút gọn của tài liệu. Xem và tải ngay bản đầy đủ của tài liệu tại đây (475.08 KB, 7 trang )
NANO EXPRESS
Effect of Growth Temperature on Bamboo-shaped
Carbon–Nitrogen (C–N) Nanotubes Synthesized
Using Ferrocene Acetonitrile Precursor
Ram Manohar Yadav Æ Pramod Singh Dobal Æ
T. Shripathi Æ R. S. Katiyar Æ O. N. Srivastava
Received: 7 October 2008 / Accepted: 24 November 2008 / Published online: 10 December 2008
Ó to the authors 2008
Abstract This investigation deals with the effect of
growth temperature on the microstructure, nitrogen con-
tent, and crystallinity of C–N nanotubes. The X-ray
photoelectron spectroscopic (XPS) study reveals that the
atomic percentage of nitrogen content in nanotubes
decreases with an increase in growth temperature. Trans-
mission electron microscopic investigations indicate that
the bamboo compartment distance increases with an
increase in growth temperature. The diameter of the
nanotubes also increases with increasing growth tempera-
ture. Raman modes sharpen while the normalized intensity
of the defect mode decreases almost linearly with
increasing growth temperature. These changes are attrib-
uted to the reduction of defect concentration due to an
increase in crystal planar domain sizes in graphite sheets
with increasing temperature. Both XPS and Raman spectral
observations indicate that the C–N nanotubes grown at
lower temperatures possess higher degree of disorder and
higher N incorporation.
Keywords Carbon nitrogen (C–N) nanotubes Á
Bamboo-shaped nanotubes Á Spray pyrolysis
Introduction
Hollow and porous structures, such as nanotubes of carbon
and other inorganic materials, have emerged as an
intriguing class of nanomaterials due to their widespread
novel properties and applications [1–8]. Doped carbon
nanotubes have also attracted considerable attention owing
to their outstanding properties [9–14]. Among various
doped nanotubes, nitrogen-doped carbon (C–N) nanotubes
exhibit novel electronic, chemical, and mechanical prop-
erties that are not found in pure carbon nanotubes [15]. To
exploit these novel properties fully, low dopant concen-
trations were incorporated within these tubes [16]. Using
such low concentration, the electronic conductance would
be significantly enhanced without altering mechanical
properties [17]. In addition, because of the presence of
donors in N-doped nanotubes, their surface would become
more reactive [18]. This reactivity would be extremely
useful in the development of field-emission sources, nano-
electronics, sensors, and strong composite materials.
In order to exploit curious properties, it is essential to
develop synthesis methods, which are capable of producing
C–N nanotubes of specific length preferably in aligned
configurations. Regarding synthesis, chemical vapor
deposition (CVD) is the simplest yet effective technique
for the formation of CNTs and C–N nanotubes. The
understanding of the mechanisms involved in the growth of
CNTs by CVD is a critical point. It needs to be elucidated
as how to control the degree of growth necessary for many
envisaged applications of CNTs. There are a plethora of
experimental parameters that need to be taken into account
R. M. Yadav Á O. N. Srivastava
Department of Physics, Banaras Hindu University,
Varanasi 221005, India
R. M. Yadav (&) Á P. S. Dobal
Department of Physics, VSSD College, Kanpur 208002, India
e-mail:
T. Shripathi
UGC-DAE Consortium for Scientific Research,
University Campus, Khandwa Road, Indore 452017, India
R. S. Katiyar
Department of Physics, University of Puerto Rico, San Juan,
PR, USA
123
Nanoscale Res Lett (2009) 4:197–203
DOI 10.1007/s11671-008-9225-2
along the basic knowledge about the way they influence
each other. One crucial parameter is the shape and chem-
ical state of the catalytic particle employed. In the case of
growth directly on substrates, these two factors are strongly
dependent on the nature of the selected substrate [19]. On
the basis of numerous trial-and-error studies published in
the literature, there is a clear consensus on the importance
of selecting the appropriate catalyst–substrate combination.
However, there remains a high degree of confusion
regarding the exact role played by the chemical composi-
tion and structure of the catalytic particles since the precise
CNT growth mechanism is mostly unknown. Additional
problems arise due to high temperatures and aggressive gas
environments associated with the CVD process—the initial
shape and chemical composition of the catalyst changes in
a complex way [20]. The influence of the oxidation state of
the catalyst for CNT growth has been investigated recently
[21–23]. However, a controversial point in such cases is
that the chemical analysis is performed ex situ with the
consequent modification of the original composition due to
exposure to air, which makes interpretation of the data
difficult. Investigations of the growth of CNT by metal-
catalyzed CVD have generally found that, under any given
conditions, there exist some maximum lengths to which the
CNT can be grown. Detailed studies of CNT length versus
growth time generally have shown that at any given tem-
perature CNTs grow at an approximately constant rate for a
certain period of time (which depends on CVD conditions)
after which growth ceases [24–33]. CNT nucleation and
growth are generally believed to occur when a catalytic
metal sample forms nanometer-sized particles at elevated
temperatures and then C
2
H
4
or other carbon feedstock
molecules decompose upon these particles to release their
carbon atoms. If the particle is in the correct size range, the
carbon atoms arrange themselves into a cylinder of con-
centric carbon shells that grows away from the catalytic
particle as a carbon nanotube. CNT growth stops when the
catalytic particle becomes deactivated. Possible mecha-
nisms for this deactivation include over coating with
carbon and conversion of the metal into metal carbide or
other noncatalytic forms. Whatever may be the mechanism,
the cessation of growth after a relatively short time, with
corresponding short maximum length of producible CNTs,
clearly limits the utility of CNTs in many materials
applications. Hence, an understanding of the mecha-
nism(s), CNT growth cessation as well as the influence of
other process parameters is necessary. Keeping these
aspects in view, we have synthesized bamboo-shaped C–N
nanotube bundles by spray pyrolysis of ferrocene–aceto-
nitrile solution. This study focuses on the effect of
variation of growth temperature on the microstructural
features, nitrogen concentration, and the crystallinity of the
nanotubes and the inter-relationship of these features.
Experimental Details
The details about the experimental set-up of spray pyro-
lysis have already been given in our previous publications
[34, 35]. It may be mentioned that whereas ferrocene
contains carbon and iron, the solvent acetonitrile contains
nitrogen, carbon, and hydrogen. Varying the concentration
of ferrocene in a given volume of acetonitrile automatically
changes the nitrogen concentration in the solution and
hence in the as-grown CNTs. All the experiments have
been performed at the optimum flowrate of 2 mL/min. For
this investigation, we choose ferrocene–acetonitrile as a
precursor at 5 mg/mL concentration of ferrocene in ace-
tonitrile while keeping all the other experimental
parameters constant. The syntheses of C–N nanotubes have
been done at 850, 900, and 950 °C. The as synthesized
product was taken out and characterized by using scanning
electron microscopic (SEM) (Philips, XL-20), transmission
electron microscopic (TEM), and X-ray photoelectron
spectroscopic (XPS) techniques. Philips EM CM-12 was
used for TEM measurements, whereas the X-ray photo-
electron spectrum was recorded in VSW ESCA instrument
(using Al K
a
radiation with a total resolution *0.9 eV at
2 9 10
-9
torr base vacuum). The unpolarized Raman
spectra of the C–N nanotube samples were recorded in
back scattering geometry using a micro-Raman set-up
(Jobin-Yvon, Model T64000) consisting of a Microscope
(Olympus) with an 809 objective, triple-monochromator,
and a charge-coupled device (CCD) multi-channel detec-
tor. Samples were excited with 514.5 nm line from an
Ar-ion laser (Coherent, Model Innova 90). With a 25-mm
CCD and 1800 grooves/mm grating, the spectral resolution
was typically\1cm
-1
. Our observations indicated that the
C–N nanotubes that grown at lower temperature possess
higher degree of disorder and higher N incorporation.
Results and Discussion
Microstructural Analysis
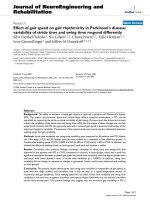
SEM exploration revealed the formation of clean, well-
aligned C–N nanotube bundles at all the growth tempera-
tures. A representative SEM micrograph is shown in
Fig. 1a, which clearly shows the formation of nanotube
bundles having length of about 430 lm. Figure 1b is the
magnified image of a nanotubes bundle shown in Fig. 1a,
which clearly exhibits that the as-grown nanotubes do not
contain any impurities traces like amorphous and vitreous
carbon. It is also clear from this micrograph that the
nanotubes are in aligned fashion.
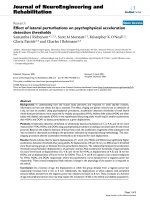
TEM investigations reveal the variation in micro-
structure of C–N nanotubes synthesized at different
198 Nanoscale Res Lett (2009) 4:197–203
123
temperatures. The TEM micrographs, as shown in Fig. 2a–c,
clearly illustrated that the C–N nanotubes were of a bamboo-
shaped structure for all temperatures. The average diameters
of nanotubes are about 55, 60, and 73 nm, respectively, at
850, 900, and 950 °C. The average diameter of the nano-
tubes slightly increases with increase in growth temperature
in the range of 850 to 950 °C as shown in Fig. 2. The
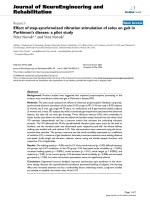
diameter distribution of these C–N nanotubes obtained from
the TEM analysis is represented qualitatively in Fig. 3.As
the growth temperature increases more agglomeration
occurs, resulting in a larger-sized catalyst particles and
therefore larger diameter nanotubes were obtained. Similar
observations on C–N nanotubes have been made by using
other precursors [31, 36]. The compartment distance also
increases with increase in growth temperature. As the tem-
perature increases, the nitrogen content decreases and results
in increased compartment separation. The increased com-
partment distance with decreasing nitrogen concentration
results from the enhancement in the number of compartment
layers with nitrogen incorporation as also suggested by Jang
et al. [37].
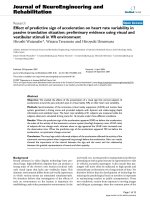
XPS Analysis
Figure 4 shows the XPS spectrum of C–N nanotubes.
Figure 4a shows the C 1s peaks at 284.2 eV and Fig. 4b
shows the N 1s peaks at *401 eV, at different growth
temperatures. The percentage (atomic) nitrogen content in
Fig. 1 a SEM image of large area of as-grown nanotubes/nanotubes
bundles; b the magnified image of a nanotubes bundle as shown in (a)
Fig. 2 TEM images of nanotubes grown at a 850 °C, b 900 °C, and c
950 °C temperatures
Nanoscale Res Lett (2009) 4:197–203 199
123
the nanotubes decreases with increase in growth temper-
ature, as shown in Fig. 4c. The percentage (atomic)
nitrogen contents present in the nanotubes are 8.29, 4.65,
and 3.19% for 850, 900, and 950 °C, respectively, and
their relative composition comes out to be C
11
N, C
23
N,
and C
30
N. van Dommele et al. [38] have reported the
tuning nitrogen functionalities in catalytically grown
nitrogen-containing carbon nanotubes as well as the
influence of growth temperature on nitrogen content. Our
results corroborate their findings of an increase in C/N
ratio with increasing temperature. Based on the TEM and
XPS investigations, it is apparent that the increases in the
bamboo compartment distance of the C–N nanotubes are
due to the decreased nitrogen content in C–N nanotubes
with increase in temperature. Earlier we have shown that
in our case the base growth mechanism is the most
favored mechanism in the formation of bamboo-shaped
C–N nanotubes [34, 35]. In the base growth model, C and
N incorporation results in the walls being pushed away
from the stationary catalyst to form the tubular structure.
The nucleation and growth of CNT follow the adsorption–
decomposition-surface diffusion-bulk diffusion–nucleation
process [39]. Nitrogen plays the key role in compartment
generation by the formation of pentagons in addition to
hexagons [40] and also by increasing the bulk diffusion
of carbon and nitrogen species in catalyst nanoparticles
[41]. As the growth temperature increases, consequently
the nitrogen concentration in the nanotubes decreases,
and therefore compartment layers are formed at longer
distances. This could be the reason for an increase in
the compartment distances with increasing growth
temperature.
Raman Spectroscopic Analysis
Raman spectroscopy has been applied for the identification
and characterization of a wide variety of nano-structured
materials [42–46] and has been shown to be a perfect tool
to evaluate the crystallinity and the defects in carbon
structures [47] as well as to analyze the behavior of carbon
nanoparticles embedded in different matrices [48]. Raman
spectra of the C–N nanotubes that grown at different
temperatures are shown in Fig. 5. The strong band around
1585 cm
-1
, which is referred to as the G-band, is usually
regarded as a Raman-allowed G-point vibration corre-
sponding to the optical phonon modes of E
2g
symmetry in
graphite and often called tangential mode for carbon
nanotubes [42, 43]. The D-band at around 1351 cm
-1
,
which originates from defects in the curved graphene
sheets, tube ends, or from the presence of carbon coating
on the outside of the tubular bands [44], is associated with
optical phonons close to the K-point of the Brillouin zone
in graphite and carbon nanotubes.
Fig. 3 The diameter distribution of C–N nanotubes synthesized at
three different temperatures
Fig. 4 XPS spectra of C–N nanotubes grown at different tempera-
tures; a C 1s spectra, b N 1s spectra, and c variation of nitrogen
content in nanotubes with growth temperature
200 Nanoscale Res Lett (2009) 4:197–203
123
The integrated intensity of D mode is usually normal-
ized with respect to that of the G mode for estimating the
defect concentration [49, 50]. For C–N nanotubes, differ-
ences in chemical bond lengths and atomic masses as well
as the formation of pentagons due to the doping of N atoms
lead to local distortion in the graphite sheets. So the
intensity ratio of the D to G modes (I
D
/I
G
) is strongly
dependent on the defect fraction originating from nitrogen
incorporation and could be considered as a measure of the
degree of nitrogen hybridization [51, 52]. As the concen-
tration of the N atoms increases, the D-band becomes
stronger and broader. The value of I
D
/I
G
for the N-doped
CNTs grown at three temperatures is plotted in Fig. 6. The
values of I
D
/I
G
decrease from *1.49 to 1.025 as growth
temperature increases from 850 to 950 °C (the N content
decreases from 8.29 to 3.19%). The data show that the
degree of long-range ordered crystalline perfection
increases with the temperature and decreases by the N
doping. The value of I
D
/I
G
increases by about 0.4 for the
increase in the N content of about 5%. However, almost
negligible change was observed in I
D
/I
G
for CVD grown
C–N nanotubes using pyridine and pyridine ? melamine
as nitrogen sources [53].
Figure 7 displays the changes of the full width at half-
maximum (FWHM) of the D and G bands versus growth
temperature, respectively. It is noticed that the FWHM of
the D and G bands reduces with increasing growth tem-
perature. This is also evident from the figure that the
FWHM of G-band is more influenced by growth temper-
ature than that of the D-band. Their width variations may
be taken as a measure of the degree of the disorder (or the
concentration of defects). Hence, narrowing of the Raman
modes indicates a better crystallization of the nanotubes or
a larger crystal planer domain size in graphite sheets and
consequently a lower degree of disorder or a lower defect
Fig. 5 Raman spectra of C–N nanotubes at different growth
temperatures; a 850 °C, b 900 °C, and c 950 °C recorded using
514.5 nm line of Ar-ion laser
Fig. 6 Variation of Raman intensity ratio of D and G bands (I
D
/I
G
)at
different growth temperatures of nanotubes
Fig. 7 Variation of FWHM of D and G bands with increasing growth
temperature
Nanoscale Res Lett (2009) 4:197–203 201
123
concentration at higher growth temperature. Moreover, the
G-band shifts from *1578 to 1569 cm
-1
, whereas the D
band shifts from *1353 to 1344 cm
-1
(given in Table 1), as
the temperature increase from 850 to 950 °C. The amount of
shifts correlated to the density of bamboo compartment and
consequently to the percentage of N content (or the con-
centration of defects). The above Raman results show that
the degree of disorder and consequently the N hybridization
decreases with increasing growth temperature. This is in
accordance with TEM and XPS findings.
Conclusions
Our investigations revealed that the percentage (atomic) of
nitrogen content in the nanotubes depends on the growth
temperature and decreases with increase in temperature.
The nanotubes have bamboo-shaped structure for all the
growth temperatures. Bamboo compartment distance and
the diameter of the nanotubes increase with increasing
growth temperature. The FWHMs of the D and G modes
reduce linearly with increasing growth temperature. The
normalized intensity of the D mode (I
D
/I
G
) decreases with
increasing growth temperature. These are interpreted as
increasing in crystal planar domain sizes in graphite sheets
and consequently lowering in the defect concentration or
the degree of disorder.
Acknowledgments The authors are grateful to Prof. C. N. R. Rao,
Prof. P. M. Ajayan, Prof. A. R. Verma, for their encouragement and to
Dr. Kalpana Awasthi for helpful discussions. The financial support
from DST (UNANST), India is gratefully acknowledged.
References
1. S. Iijima, Nature 354, 56 (1991). doi:10.1038/354056a0
2. P.M. Ajayan, Chem. Rev. 9, 1787 (1999). doi:10.1021/cr970102g
3. S.K. Srivastava, V.D. Vankar, V. Kumar, Nanoscale Res. Lett. 3,
25 (2008). doi:10.1007/s11671-007-9109-x
4. J. Goldberger, R.R. He, Y.F. Zhang, S.W. Lee, H.Q. Yan, H.J.
Choi, P.D. Yang, Nature 422, 599 (2003). doi:10.1038/nature
01551
5. R. Tenne, Nat. Nanotechnol. 1, 110 (2006). doi:10.1038/nnano.
2006.62
6. C. Yan, D. Xue, Adv. Mater. 20, 1055 (2008). doi:10.1002/
adma.200701752
7. C. Yan, D. Xue, Electrochem. Commun. 9, 1247 (2007). doi:
10.1016/j.elecom.2007.01.029
8. J. Liu, D. Xue, Adv. Mater. 20, 2622 (2008). doi:10.1002/adma.
200800208
9. D.L. Carroll, P. Redlich, X. Blase, J C. Charlier, S. Curran, P.M.
Ajayan, S. Roth, M. Ru
¨
hle, Phys. Rev. Lett. 81, 2332 (1998). doi:
10.1103/PhysRevLett.81.2332
10. W.K. Hsu, S.Y. Chu, E. Mun
˜
oz-Picone, J.L. Boldu
´
, S. Firth, P.
Franchi, B.P. Roberts, A. Schilder, H. Terrones, N. Grobert, Y.Q.
Zhu, M. Terrones, M.E. McHenry, H.W. Kroto, D.R.M. Walton,
Chem. Phys. Lett. 323, 572 (2000). doi:10.1016/S0009-2614
(00)00553-4
11. R. Czerw, M. Terrones, J.C. Charlier, X. Blase, B. Foley, R.
Kamalakaran, N. Grobert, H. Terrones, D. Tekleab, P.M. Ajayan,
W. Blau, M. Ruhle, D.L. Carroll, Nano Lett. 1, 457 (2001). doi:
10.1021/nl015549q
12. D. Golberg, P.S. Dorozhkin, Y. Bando, Z C. Dong, C.C. Tang, Y.
Uemura, N. Grobert, M. Reyes-Reyes, H. Terrones, M. Terrones,
Appl. Phys. A. 76, 499 (2003). doi:10.1007/s00339-002-2047-7
13. J C. Charlier, M. Terrones, M. Baxendale, V. Meunier, T.
Zacharia, N.L. Rupesinghe, W.K. Hsu, N. Grobert, H. Terrones,
G.A.J. Amaratunga, Nano Lett. 2, 1191 (2002). doi:10.1021/
nl0256457
14. F.J. Owens, Nanoscale Res. Lett. 2, 447 (2007). doi:10.1007/
s11671-007-9082-4
15. M. Terrones, A. Jorio, M. Endo, A.M. Rao, Y.A. Kim, T. Hayashi,
H. Terrones, J.C. Charlier, G. Dresselhaus, M.S. Dresselhaus,
Mater Today 7, 30 (2004). doi:10.1016/S1369-7021(04)00447-X
16. M. Yudasaka, R. Kikuchi, Y. Ohki, S. Yoshimura, Carbon 35,
195 (1997). doi:10.1016/S0008-6223(96)00142-X
17. R. Sen, B.C. Satishkumar, A. Govindaraj, K.R. Harikumar, G.
Raina, J.P. Zhang, A.K. Cheetham, C.N.R. Rao, Chem. Phys.
Lett. 287, 671 (1998). doi:10.1016/S0009-2614(98)00220-6
18. K. Jiang, L.S. Schadler, R.W. Siegel, X. Zhang, H. Zhang, M.
Terrones, J. Mater. Chem. 14, 37 (2004). doi:10.1039/b310359e
19. T. de los Arcos, M.G. Garnier, J.W. Seo, P. Oelhafen, V.
Thommen, D. Mathys, J. Phys. Chem. B 108
, 7728 (2004). doi:
10.1021/jp049495v
20. S. Helveg, C. Lo’pez-Cartes, J. Sehested, P.L. Hansen, B.S.
Clausen, J.R.R. Nielsen, F.A. Pedersen, J.K. Nørskov, Nature
427, 426 (2004). doi:10.1038/nature02278
21. T. de los Arcos, F. Vonau, M.G. Garnier, V. Thommen,
P. Oelhafen, M. Du
¨
ggelin, D. Mathis, R. Guggenheim, Appl.
Phys. Lett. 80, 2383 (2002). doi:10.1063/1.1465529
22. H. Sato, Y. Hori, K. Hata, K. Seko, H. Nakahara, Y. Saito,
J. Appl. Phys. 100, 104321 (2006). doi:10.1063/1.2364381
23. A. Okita, A. Ozeki, Y. Suda, J. Nakamura, A. Oda, K. Bhatta-
charyya, H. Sugawara, Y. Sakai, Jpn J. Appl. Phys. 45, 8323
(2006). doi:10.1143/JJAP.45.8323
24. G.Y. Xiong, D.Z. Wang, Z.F. Ren, Carbon 44, 969 (2006). doi:
10.1016/j.carbon.2005.10.015
25. Y.H. Yun, V. Shanov, Y. Tu, S. Subramaniam, M. Schulz,
J. Phys. Chem. B 110, 23920 (2006). doi:10.1021/jp057171g
26. Q.W. Li, X.F. Zhang, R.F. DePaula, L.X. Zheng, Y.H. Zhao, L.
Stan, T.G. Holesinger, P.N. Arendt, D.E. Peterson, Y.T.T. Zhu,
Adv. Mater. 18, 3160 (2006). doi:10.1002/adma.200601344
27. M.J. Bronikowski, Carbon 44, 2822 (2006). doi:10.1016/
j.carbon.2006.03.022
28. S.R. Jian, Y.T. Chen, C.F. Wang, H.C. Wen, W.M. Chiu, C.S.
Yang, Nanoscale Res. Lett. 3, 230 (2008). doi:10.1007/s11671-
008-9141-5
29. D.N. Futaba, K. Hata, T. Yamada, K. Mizuno, M. Yumura, S.
Iijima, Phys. Rev. Lett. 95, 056104 (2005). doi:10.1103/PhysRev
Lett.95.056104
30. A. Magrez, J.W. Seo, C. Miko, K. Hernadi, L. Forro, J. Phys.
Chem. B 109, 10087 (2005). doi:10.1021/jp050363r
Table 1 Peak frequencies of Raman D and G mode of C–N nano-
tubes at three different growth temperatures
Growth
temperature
(°C)
Peak frequency (cm
-1
)
D-mode G-mode
850 1353.08 1578.36
900 1348.37 1573.28
950 1344.85 1569.32
202 Nanoscale Res Lett (2009) 4:197–203
123
31. C. Singh, M.S. Shaffer, A.H. Windle, Carbon 41, 359 (2003). doi:
10.1016/S0008-6223(02)00314-7
32. S.K. Srivastava, V.D. Vankar, V. Kumar, V.N. Singh, Nanoscale
Res. Lett. 3, 205 (2008). doi:10.1007/s11671-008-9138-0
33. M. Lin, J.P.Y. Tan, C. Boothroyd, K.P. Loh, E.S. Tok, Y.L. Foo,
Nano Lett. 6, 449 (2006). doi:10.1021/nl052356k
34. R.M. Yadav, T. Shripathi, A. Srivastava, O.N. Srivastava, J.
Nanosci. Nanotechnol. 5, 820 (2005). doi:10.1166/jnn.2005.102
35. R.M. Yadav, A. Srivastava, O.N. Srivastava, J. Nanosci. Nano-
technol. 4, 719 (2004). doi:10.1166/jnn.2004.105
36. C.J. Lee, S.C. Lyu, H.W. Kim, J.H. Lee, K.I. Cho, Chem. Phys.
Lett. 359, 115 (2002). doi:10.1016/S0009-2614(02)00655-3
37. J.W. Jang, C.E. Lee, S.C. Lyu, T.J. Lee, C.J. Lee, Appl. Phys.
Lett. 84, 2877 (2004). doi:10.1063/1.1697624
38. S. van Dommele, A.R. Izquirdo, R. Brydson, K.P. de Jong, J.H.
Bitter, Carbon 46, 138 (2008). doi:10.1016/j.carbon.2007.10.034
39. S. Hofmann, G. Csanyi, A.C. Ferrari, M.C. Payne, J. Robertson,
Phys. Rev. Lett. 95, 036101 (2005). doi:10.1103/PhysRevLett.
95.036101
40. X.F. Zang, X.B. Zang, G.V. Tendelloo, S. Amelinckx, M.O.
deBeeck, J.V. Landuyt, J. Cryst. Growth 130, 368 (1993). doi:
10.1016/0022-0248(93)90522-X
41. C.H. Lin, H.L. Chang, C.M. Hsu, A.Y. Lo, C.T. Kuo, Diamond
Relat. Mater. 12, 1851 (2003). doi:10.1016/S0925-9635(03)002
09-7
42. Y. Li, B. Zhang, X.Y. Tao, J.M. Xu, W.Z. Huang, J.H. Luo, T. Li,
Y. Bao, H.J. Geise, Carbon 43, 295 (2005). doi:10.1016/j.carbon.
2004.09.014
43. P. Tan, L. An, L. Liu, Z. Guo, R. Czerw, D.L. Carroll, P.M.
Ajayan, N. Zhang, H. Guo, Phys. Rev. B 66, 245410 (2002). doi:
10.1103/PhysRevB.66.245410
44. L. Liu, Y. Qin, Z.X. Guo, D. Zhu, Carbon 41, 331 (2003). doi:
10.1016/S0008-6223(02)00286-5
45. B.W. Mwakikunga, E.S. Haddad, A. Forbes, C. Arendse, Phys.
Status Solidi (a) 205, 150 (2008). doi:10.1002/pssa.200776829
46. Q. Zhao, H.D. Wagner, Philos. Trans. R. Soc. Lond. A 362, 2407
(2004). doi:10.1098/rsta.2004.1447
47. G.F. Malgas, C.J. Arendse, N.P. Cele, F.R. Cummings, J. Mater.
Sci. 43, 1020 (2008). doi:10.1007/s10853-007-2230-5
48. G. Katumba, B.W. Mwakikunga, R. Mothibinyane, Nanoscale
Res. Lett. 3, 421 (2008). doi:10.1007/s11671-008-9172-y
49. X.C. Ma, E.G. Wang, R.D. Tilley, D.A. Jefferson, W. Zhou,
Appl. Phys. Lett. 77, 4136 (2000). doi:10.1063/1.1332407
50. L. Zhang, H. Li, K.T. Yue, S.L. Zhang, X. Wu, J. Zi, Phys. Rev.
B 65, 73401 (2002). doi:10.1103/PhysRevB.65.073401
51. E.J. Liang, P. Ding, H.R. Zhang, X.Y. Guo, Z.L. Du, Diamond
Relat. Mater. 13, 69 (2004). doi:10.1016/j.diamond.2003.08.025
52. Y.T. Lee, N.S. Kim, S.Y. Bae, J. Park, S.C. Yu, H. Ryu, H.J. Lee,
J. Phys. Chem. B 107, 12958 (2003). doi:10.1021/jp0274536
53. S. Webster, J. Maultzsch, C. Thomsen, J. Liu, R. Czerw, M.
Terrones, F. Adar, C John, A. Whitley, D.L. Carroll, Mater. Res.
Symp. Proc. 772, M7.8.1. (2003)
Nanoscale Res Lett (2009) 4:197–203 203
123