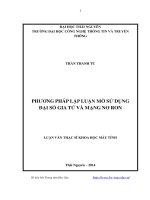
Code mạng nơ ron sử dụng Matlab
Bạn đang xem bản rút gọn của tài liệu. Xem và tải ngay bản đầy đủ của tài liệu tại đây (1.69 MB, 91 trang )
Neural Networks: MATLAB examples
Neural Networks course (practical examples) © 2012 Primoz Potocnik
Primoz Potocnik
University of Ljubljana
Faculty of Mechanical Engineering
LASIN - Laboratory of Synergetics
www.neural.si |
Contents
1. nn02_neuron_output - Calculate the output of a simple neuron
2. nn02_custom_nn - Create and view custom neural networks
3. nn03_perceptron - Classification of linearly separable data with a perceptron
4. nn03_perceptron_network - Classification of a 4-class problem with a 2-neuron perceptron
5. nn03_adaline - ADALINE time series prediction with adaptive linear filter
6. nn04_mlp_xor - Classification of an XOR problem with a multilayer perceptron
7. nn04_mlp_4classes - Classification of a 4-class problem with a multilayer perceptron
8. nn04_technical_diagnostic - Industrial diagnostic of compressor connection rod defects [data2.zip]
9. nn05_narnet - Prediction of chaotic time series with NAR neural network
10. nn06_rbfn_func - Radial basis function networks for function approximation
11. nn06_rbfn_xor - Radial basis function networks for classification of XOR problem
12. nn07_som - 1D and 2D Self Organized Map
13. nn08_tech_diag_pca - PCA for industrial diagnostic of compressor connection rod defects [data2.zip]
Page 1 of 91
Neuron output
Neural Networks course (practical examples) © 2012 Primoz Potocnik
PROBLEM DESCRIPTION: Calculate the output of a simple neuron
Contents
●
Define neuron parameters
●
Define input vector
●
Calculate neuron output
●
Plot neuron output over the range of inputs
Define neuron parameters
close all, clear all, clc, format compact
%
w
%
b
%
Neuron weights
= [4 -2]
Neuron bias
= -3
Activation function
func = 'tansig'
% func = 'purelin'
% func = 'hardlim'
% func = 'logsig'
w =
4
-2
b =
-3
func =
tansig
Define input vector
p = [2 3]
p =
2
3
Calculate neuron output
activation_potential = p*w'+b
Page 2 of 91
neuron_output = feval(func, activation_potential)
activation_potential =
-1
neuron_output =
-0.7616
Plot neuron output over the range of inputs
[p1,p2] = meshgrid(-10:.25:10);
z = feval(func, [p1(:) p2(:)]*w'+b );
z = reshape(z,length(p1),length(p2));
plot3(p1,p2,z)
grid on
xlabel('Input 1')
ylabel('Input 2')
zlabel('Neuron output')
Published with MATLAB® 7.14
Page 3 of 91
Custom networks
Neural Networks course (practical examples) © 2012 Primoz Potocnik
PROBLEM DESCRIPTION: Create and view custom neural networks
Contents
●
Define one sample: inputs and outputs
●
Define and custom network
●
Define topology and transfer function
●
Configure network
●
Train net and calculate neuron output
Define one sample: inputs and outputs
close all, clear all, clc, format compact
inputs = [1:6]' % input vector (6-dimensional pattern)
outputs = [1 2]' % corresponding target output vector
inputs =
1
2
3
4
5
6
outputs =
1
2
Define and custom network
% create network
net = network( ...
1,
... % numInputs,
number of inputs,
2,
... % numLayers,
number of layers
[1; 0],
... % biasConnect, numLayers-by-1 Boolean vector,
[1; 0],
... % inputConnect, numLayers-by-numInputs Boolean matrix,
[0 0; 1 0], ... % layerConnect, numLayers-by-numLayers Boolean matrix
[0 1]
... % outputConnect, 1-by-numLayers Boolean vector
);
% View network structure
view(net);
Page 4 of 91
Define topology and transfer function
% number of hidden layer neurons
net.layers{1}.size = 5;
% hidden layer transfer function
net.layers{1}.transferFcn = 'logsig';
view(net);
Configure network
net = configure(net,inputs,outputs);
view(net);
Train net and calculate neuron output
Page 5 of 91
% initial network response without training
initial_output = net(inputs)
% network training
net.trainFcn = 'trainlm';
net.performFcn = 'mse';
net = train(net,inputs,outputs);
% network response after training
final_output = net(inputs)
initial_output =
0
0
final_output =
1.0000
2.0000
Published with MATLAB® 7.14
Page 6 of 91
Classification of linearly separable data with a perceptron
Neural Networks course (practical examples) © 2012 Primoz Potocnik
PROBLEM DESCRIPTION: Two clusters of data, belonging to two classes, are defined in a 2-dimensional input space. Classes are
linearly separable. The task is to construct a Perceptron for the classification of data.
Contents
●
Define input and output data
●
Create and train perceptron
●
Plot decision boundary
Define input and output data
close all, clear all, clc, format compact
% number of samples of each class
N = 20;
% define inputs and outputs
offset = 5; % offset for second class
x = [randn(2,N) randn(2,N)+offset]; % inputs
y = [zeros(1,N) ones(1,N)];
% outputs
% Plot input samples with PLOTPV (Plot perceptron input/target vectors)
figure(1)
plotpv(x,y);
Page 7 of 91
Create and train perceptron
net = perceptron;
net = train(net,x,y);
view(net);
Plot decision boundary
figure(1)
plotpc(net.IW{1},net.b{1});
Page 8 of 91
Published with MATLAB® 7.14
Page 9 of 91
Classification of a 4-class problem with a perceptron
Neural Networks course (practical examples) © 2012 Primoz Potocnik
PROBLEM DESCRIPTION: Perceptron network with 2-inputs and 2-outputs is trained to classify input vectors into 4 categories
Contents
●
Define data
●
Prepare inputs & outputs for perceptron training
●
Create a perceptron
●
Train a perceptron
●
How to use trained perceptron
Define data
close all, clear all, clc, format compact
% number of samples of each class
K = 30;
% define classes
q = .6; % offset of classes
A = [rand(1,K)-q; rand(1,K)+q];
B = [rand(1,K)+q; rand(1,K)+q];
C = [rand(1,K)+q; rand(1,K)-q];
D = [rand(1,K)-q; rand(1,K)-q];
% plot classes
plot(A(1,:),A(2,:),'bs')
hold on
grid on
plot(B(1,:),B(2,:),'r+')
plot(C(1,:),C(2,:),'go')
plot(D(1,:),D(2,:),'m*')
% text labels for classes
text(.5-q,.5+2*q,'Class A')
text(.5+q,.5+2*q,'Class B')
text(.5+q,.5-2*q,'Class C')
text(.5-q,.5-2*q,'Class D')
%
a
b
c
d
%
%
%
%
define output coding for classes
= [0 1]';
= [1 1]';
= [1 0]';
= [0 0]';
% Why this coding doesn't work?
a = [0 0]';
b = [1 1]';
d = [0 1]';
Page 10 of 91
%
%
%
%
%
%
c
%
a
b
d
c
= [1 0]';
Why this coding doesn't work?
= [0 1]';
= [1 1]';
= [1 0]';
= [0 1]';
Prepare inputs & outputs for perceptron training
%
P
%
T
define inputs (combine samples from all four classes)
= [A B C D];
define targets
= [repmat(a,1,length(A)) repmat(b,1,length(B)) ...
repmat(c,1,length(C)) repmat(d,1,length(D)) ];
%plotpv(P,T);
Create a perceptron
net = perceptron;
Train a perceptron
ADAPT returns a new network object that performs as a better classifier, the network output, and the error. This loop allows the
network to adapt for xx passes, plots the classification line, and continues until the error is zero.
Page 11 of 91
E = 1;
net.adaptParam.passes = 1;
linehandle = plotpc(net.IW{1},net.b{1});
n = 0;
while (sse(E) & n<1000)
n = n+1;
[net,Y,E] = adapt(net,P,T);
linehandle = plotpc(net.IW{1},net.b{1},linehandle);
drawnow;
end
% show perceptron structure
view(net);
Page 12 of 91
How to use trained perceptron
%
p
y
%
For example, classify an input vector of [0.7; 1.2]
= [0.7; 1.2]
= net(p)
compare response with output coding (a,b,c,d)
p =
0.7000
1.2000
y =
1
1
Published with MATLAB® 7.14
Page 13 of 91
ADALINE time series prediction
Neural Networks course (practical examples) © 2012 Primoz Potocnik
PROBLEM DESCRIPTION: Construct an ADALINE for adaptive prediction of time series based on past time series data
Contents
●
Define input and output data
●
Prepare data for neural network toolbox
●
Define ADALINE neural network
●
Adaptive learning of the ADALINE
●
Plot results
Define input and output data
close all, clear all, clc, format compact
% define segments of time vector
dt = 0.01; % time step [seconds]
t1 = 0
: dt : 3; %
first time vector [seconds]
t2 = 3+dt : dt : 6; %
second time vector [seconds]
t = [t1 t2];
% complete time vector [seconds]
% define signal
y = [sin(4.1*pi*t1) .8*sin(8.3*pi*t2)];
% plot signal
plot(t,y,'.-')
xlabel('Time [sec]');
ylabel('Target Signal');
grid on
ylim([-1.2 1.2])
Page 14 of 91
Prepare data for neural network toolbox
%
%
%
%
%
%
p
There are two basic types of input vectors: those that occur concurrently
(at the same time, or in no particular time sequence), and those that
occur sequentially in time. For concurrent vectors, the order is not
important, and if there were a number of networks running in parallel,
you could present one input vector to each of the networks. For
sequential vectors, the order in which the vectors appear is important.
= con2seq(y);
Define ADALINE neural network
% The resulting
% using delayed
inputDelays
=
learning_rate =
network will predict the next value of the target signal
values of the target.
1:5; % delayed inputs to be used
0.2; % learning rate
% define ADALINE
net = linearlayer(inputDelays,learning_rate);
Adaptive learning of the ADALINE
% Given an input sequence with N steps the network is updated as follows.
% Each step in the sequence of inputs is presented to the network one at
% a time. The network's weight and bias values are updated after each step,
Page 15 of 91
% before the next step in the sequence is presented. Thus the network is
% updated N times. The output signal and the error signal are returned,
% along with new network.
[net,Y,E] = adapt(net,p,p);
% view network structure
view(net)
% check final network parameters
disp('Weights and bias of the ADALINE after adaptation')
net.IW{1}
net.b{1}
Weights and bias of the ADALINE after adaptation
ans =
0.7179
0.4229
0.1552
-0.1203
-0.4159
ans =
-1.2520e-08
Plot results
% transform result vectors
Y = seq2con(Y); Y = Y{1};
E = seq2con(E); E = E{1};
% start a new figure
figure;
% first graph
subplot(211)
plot(t,y,'b', t,Y,'r--');
legend('Original','Prediction')
grid on
xlabel('Time [sec]');
ylabel('Target Signal');
ylim([-1.2 1.2])
% second graph
subplot(212)
plot(t,E,'g');
grid on
Page 16 of 91
legend('Prediction error')
xlabel('Time [sec]');
ylabel('Error');
ylim([-1.2 1.2])
Published with MATLAB® 7.14
Page 17 of 91
Solving XOR problem with a multilayer perceptron
Neural Networks course (practical examples) © 2012 Primoz Potocnik
PROBLEM DESCRIPTION: 4 clusters of data (A,B,C,D) are defined in a 2-dimensional input space. (A,C) and (B,D) clusters represent XOR classification problem. The task is
to define a neural network for solving the XOR problem.
Contents
●
Define 4 clusters of input data
●
Define output coding for XOR problem
●
Prepare inputs & outputs for network training
●
Create and train a multilayer perceptron
●
plot targets and network response to see how good the network learns the data
●
Plot classification result for the complete input space
Define 4 clusters of input data
close all, clear all, clc, format compact
% number of samples of each class
K = 100;
% define 4 clusters of input data
q = .6; % offset of classes
A = [rand(1,K)-q; rand(1,K)+q];
B = [rand(1,K)+q; rand(1,K)+q];
C = [rand(1,K)+q; rand(1,K)-q];
D = [rand(1,K)-q; rand(1,K)-q];
% plot clusters
figure(1)
plot(A(1,:),A(2,:),'k+')
hold on
grid on
plot(B(1,:),B(2,:),'bd')
plot(C(1,:),C(2,:),'k+')
plot(D(1,:),D(2,:),'bd')
% text labels for clusters
text(.5-q,.5+2*q,'Class A')
text(.5+q,.5+2*q,'Class B')
text(.5+q,.5-2*q,'Class A')
text(.5-q,.5-2*q,'Class B')
Page 18 of 91
Define output coding for XOR problem
%
a
c
b
d
encode clusters a and c as one class, and b and d as another class
= -1; % a | b
= -1; % ------= 1; % d | c
= 1; %
Prepare inputs & outputs for network training
%
P
%
T
define inputs (combine samples from all four classes)
= [A B C D];
define targets
= [repmat(a,1,length(A)) repmat(b,1,length(B)) ...
repmat(c,1,length(C)) repmat(d,1,length(D)) ];
% view inputs |outputs
%[P' T']
Create and train a multilayer perceptron
% create a neural network
net = feedforwardnet([5 3]);
% train net
net.divideParam.trainRatio = 1; % training set [%]
net.divideParam.valRatio
= 0; % validation set [%]
net.divideParam.testRatio = 0; % test set [%]
% train a neural network
[net,tr,Y,E] = train(net,P,T);
% show network
view(net)
Page 19 of 91
plot targets and network response to see how good the network learns the data
figure(2)
plot(T','linewidth',2)
hold on
plot(Y','r--')
grid on
legend('Targets','Network response','location','best')
ylim([-1.25 1.25])
Plot classification result for the complete input space
% generate a grid
span = -1:.005:2;
[P1,P2] = meshgrid(span,span);
pp = [P1(:) P2(:)]';
% simulate neural network on a grid
aa = net(pp);
% translate output into [-1,1]
%aa = -1 + 2*(aa>0);
% plot classification regions
figure(1)
mesh(P1,P2,reshape(aa,length(span),length(span))-5);
colormap cool
Page 20 of 91
view(2)
Published with MATLAB® 7.14
Page 21 of 91
Classification of a 4-class problem with a multilayer perceptron
Neural Networks course (practical examples) © 2012 Primoz Potocnik
PROBLEM DESCRIPTION: 4 clusters of data (A,B,C,D) are defined in a 2-dimensional input space. The task is to define a neural network for classification of arbitrary point in
the 2-dimensional space into one of the classes (A,B,C,D).
Contents
●
Define 4 clusters of input data
●
Define output coding for all 4 clusters
●
Prepare inputs & outputs for network training
●
Create and train a multilayer perceptron
●
Evaluate network performance and plot results
●
Plot classification result for the complete input space
Define 4 clusters of input data
close all, clear all, clc, format compact
% number of samples of each class
K = 100;
% define 4 clusters of input data
q = .6; % offset of classes
A = [rand(1,K)-q; rand(1,K)+q];
B = [rand(1,K)+q; rand(1,K)+q];
C = [rand(1,K)+q; rand(1,K)-q];
D = [rand(1,K)-q; rand(1,K)-q];
% plot clusters
figure(1)
plot(A(1,:),A(2,:),'k+')
hold on
grid on
plot(B(1,:),B(2,:),'b*')
plot(C(1,:),C(2,:),'kx')
plot(D(1,:),D(2,:),'bd')
% text labels for clusters
text(.5-q,.5+2*q,'Class A')
text(.5+q,.5+2*q,'Class B')
text(.5+q,.5-2*q,'Class C')
text(.5-q,.5-2*q,'Class D')
Page 22 of 91
Define output coding for all 4 clusters
%
a
b
d
c
coding (+1/-1) of 4 separate classes
= [-1 -1 -1 +1]';
= [-1 -1 +1 -1]';
= [-1 +1 -1 -1]';
= [+1 -1 -1 -1]';
Prepare inputs & outputs for network training
%
P
%
T
define inputs (combine samples from all four classes)
= [A B C D];
define targets
= [repmat(a,1,length(A)) repmat(b,1,length(B)) ...
repmat(c,1,length(C)) repmat(d,1,length(D)) ];
Create and train a multilayer perceptron
% create a neural network
net = feedforwardnet([4 3]);
% train net
net.divideParam.trainRatio = 1; % training set [%]
net.divideParam.valRatio
= 0; % validation set [%]
net.divideParam.testRatio = 0; % test set [%]
% train a neural network
[net,tr,Y,E] = train(net,P,T);
% show network
view(net)
Page 23 of 91
Evaluate network performance and plot results
% evaluate performance: decoding network response
[m,i] = max(T); % target class
[m,j] = max(Y); % predicted class
N = length(Y); % number of all samples
k = 0;
% number of missclassified samples
if find(i-j),
% if there exist missclassified samples
k = length(find(i-j)); % get a number of missclassified samples
end
fprintf('Correct classified samples: %.1f%% samples\n', 100*(N-k)/N)
% plot network output
figure;
subplot(211)
plot(T')
title('Targets')
ylim([-2 2])
grid on
subplot(212)
plot(Y')
title('Network response')
xlabel('# sample')
ylim([-2 2])
grid on
Correct classified samples: 100.0% samples
Page 24 of 91
Plot classification result for the complete input space
% generate a grid
span = -1:.01:2;
[P1,P2] = meshgrid(span,span);
pp = [P1(:) P2(:)]';
% simualte neural network on a grid
aa = net(pp);
% plot classification regions based on MAX activation
figure(1)
m = mesh(P1,P2,reshape(aa(1,:),length(span),length(span))-5);
set(m,'facecolor',[1 0.2 .7],'linestyle','none');
hold on
m = mesh(P1,P2,reshape(aa(2,:),length(span),length(span))-5);
set(m,'facecolor',[1 1.0 0.5],'linestyle','none');
m = mesh(P1,P2,reshape(aa(3,:),length(span),length(span))-5);
set(m,'facecolor',[.4 1.0 0.9],'linestyle','none');
m = mesh(P1,P2,reshape(aa(4,:),length(span),length(span))-5);
set(m,'facecolor',[.3 .4 0.5],'linestyle','none');
view(2)
Page 25 of 91