Sustainable Natural Resources Management Part 3 ppt
Bạn đang xem bản rút gọn của tài liệu. Xem và tải ngay bản đầy đủ của tài liệu tại đây (1.78 MB, 14 trang )
Fuzzy Image Processing, Analysis and
Visualization Methods for Hydro-Dams and Hydro-Sites Surveillance and Monitoring
17
Map i,j S i,j 255 I i,j
Infrared IR R,IR
(7)
where I
R,IR
[H×W] represents the intensity of the red component in the infrared image of the
current plot.
The segmentation result in "cold" and "not cold" areas for the infrared plot image given in
Figure 6, where the segmented image is presented as a binary image (black
– "not cold",
white
– "cold"), and its associated water infiltration severity degree map, are given in Fig. 9.
The final processing step is the bimodal fusion of visible and infrared water infiltration
severity information. We use the two individual information sources already provided by
the independent image processing and analysis stages: the visible and infrared image
processing, to obtain the overall assessment and quantification of the water infiltration
amount in the currently analysed plot. Several fusion schemes are available, varying from
very simple (pixel-based) to complex ones, to perform the information integration from two
or more modalities; the most used in particular for visible and infrared bimodal information
fusion can be found in (Yin and Malcolm, 2000; O’Conaire
et al., 2006). Among these, one of
the simplest schemes is by weighted averaging of the decisions given by each modality
alone at pixel level, provided that the visible and infrared image registration was previously
performed. Let us denote the decision about the plausibility of presence of a certain event in
the spatial position (i,j) in the visible spectrum modality by d
Vis
(i,j) and the decision about
the plausibility of presence of the same event in the spatial position (i,j) in the infrared
modality by d
IR
(i,j). We also consider the weights (confidences) assigned to each modality
denoted by w
Vis
and w
IR
, chosen to satisfy the constraints: w (0;1);
Vis
w (0;1);
IR
ww1.
Vis IR
The confidences w
Vis
and w
IR
assigned to each modality are derived based
on expert’s knowledge about the relative significance of each modality in assessing the
severity of the water infiltration. The presence of calcite shows persistant, longer duration
water infiltration in the plot, thus its weight should be higher than the infrared’s
information source weight. We chose as confidence values in our application: w
Vis
=0.65 and
w
IR
=0.35. As information sources to be weighted aggregated, we use the individual water
infiltration severity degrees maps, Map
Vis
and Map
IR
. The overall water infiltration severity
degree map, represented as an intensity image in the range {0,1,
…,255}, with 255 –
maximum infiltration severity, is obtained as:
InfMap(i,
j
)w Map (i,
j
)w Map (i,
j
).
Vis Vis IR IR
(8)
An example of the resulting water infiltration severity degree map after bimodal image
fusion, for the plot presented in Fig. 6, is given in Fig. 10. Then this overall decision map can
be used to compute quantitative descriptors of the water infiltration amount and local
severity on the plot. Examples of such simple quantitative descriptors are given in (Gordan
et al., 2007): the percentage of the water infiltration area from the total plot area; the
maximum local severity degree of water infiltration, assessed as the accumulated severity of
the infiltration reported to the total area exhibiting infiltration.
In order to test this method we used the same multi-modal database containing images
acquired from Tarnita dam, near Cluj-Napoca. We selected 5 pairs of plots acquired in both
Sustainable Natural Resources Management
18
modalities (visible and infrared). As shown earlier in this section, a ground truth for visible
image segmentation into calcite areas and non-calcite areas can be easily obtained, and the
same
– a ground truth for pixel classification into cold areas for the infrared images. Thus
we can assess the functionality of these processing stages very accurately. However, this is
not the case for the assessment of water infiltrations severity, which in general can only be
subjectively estimated by human observers. Therefore we can only roughly compare the
results provided by our algorithm, converted to subjective scales, to subjective (human)
evaluation of the water infiltrations based on the visible and infrared plot image evaluation.
These comparative results for the 5 pairs of plots are presented in Table 1. The only
difference from the human expert’s opinion is in the 4
th
line in Table 1, for a plot exhibiting
water infiltration in a very small area, in respect to the local severity of the water infiltration:
although the numerical results show a large local value, the human expert identifies it as not
significant, and this could be explained by the overall assessment done by the human
expert, with almost no attention to local details when the water infiltration region size is not
significant. The segmentation results, both for the visible and infrared plot images show in
all cases good accuracy.
Although we employ here one of the most simple fusion schemes, we can see how the use of
the two modalities can lead to better results than the analysis of each imaging modality
alone. Also, the implementation of the joint analysis of visible and infrared images into the
visual inspections module we described at the beginning of this chapter, has the advantage
of providing numerical estimates of the extension of the water infiltrations and severity of
the water infiltrations in the plots, reducing the risk of human observer subjectivity and
image display quality.
Plot pair
Number
Water
Infiltration
Area
Infiltration
Severity
Infiltration amount
(subjective)
Infiltration severity
(subjective)
1 32.05% 81% Medium/Large Severe
2 23.63% 58% Medium Moderate
3 24.46% 64.7% Medium/Small Moderate
4 2.4% 72% Almost none Reduced
5 43.7% 78% Large Severe
Table 1. Quantitative results of our algorithm against subjective human expert’s opinion
4. Assessment of the water resources management policy in a hydro-site
region
As the hydro-dams reservoirs are also the main water supply resources for the geographical
region, the assessment of the water management policy in the operation of the hydro-dam in
respect to various economical and environmental factors is also an issue of significant
interest. In this respect, we propose and implement a fuzzy decision support component to
help in assessing the water resource management. Whereas the evaluation strategy itself is
inspired by the work of (Zhou & Huang, 2007), employing a hierarchical process analysis
strategy with qualitative reasoning, the presentation of the assessment results is novel, as we
aim to display the evaluation not only in numerical and linguistic form, but also in a visual
Fuzzy Image Processing, Analysis and
Visualization Methods for Hydro-Dams and Hydro-Sites Surveillance and Monitoring
19
form. The originality of the presented solution consists in the presentation of the water
resource management evaluation “grading” in the form of a geotypical textured map of the
region, where the natural texture changes according to the evaluation result for a specific
category and according to the qualifier assigned to the management policy (varying from
worst to very good). Therefore, in this sub-section we primarily emphasize on this
visualization enhanced results presentation part. The interested reader may find more
details of the implementation of the tool in (Gordan
et al., 2010).
To achieve a meaningful graphical representation, we propose to employ fuzzy alpha-
blending, image morphology and fuzzy image inpainting algorithms, which allow the
production of high quality and meaningful geotypically textured maps of the hydro-site
region. This allows the user to get multiple clues on the results of the water resource
management evaluation, and have a stronger impact than the numerical assessment alone.
The advancements and new application tracks of image processing algorithms and display
devices provide the means for advanced graphical representations to be easily integrated in
decision support software tools. These components are not so widely employed in the
existing systems, but some implementations exist, as e.g. the integrated information
management and simulation system combining WebGIS, database and hydrological model
in (Shaomin
et al., 2009) – which integrates a flood simulator and visually presents the
flooded areas; or, the GIS based integrated system, which also incorporates hydrological
analysis and cascade hydroelectric station dispatching functions, with powerful
visualization tools (Shi
et al., 2006).
The case of water resource management assessment may significantly benefit from a
visualization module provided in the form of a geotypically textured map of the evaluated
region. This can easily embed digital maps and natural images specific to the site, combined
with specifically designed rendering tools. The fuzzy evaluation process results should
drive the rendering of the appropriate textures on the digital map of the region.
Adopting the terminology in (Zhou & Huang, 2007), the factors involved in the assessment
of the water resource management are called indexes. Each index represents a relevant
attribute in the water resource management evaluation, and it must allow either a numerical
or a qualitative description. During the system’s setup, a weight must be assigned to each
index, showing its relevance in the assessment of the water resource management. The
weights may vary depending on the available water resources in the region and on the
overall regional conditions. As the water resource management may impact several facets of
life (the natural resources of the region, the ecology and the environment, the society and
the economy of the region), a group of indexes is defined for each category individually.
This will allow an independent evaluation of the water resource management policy’s
impact on each category. So far we implemented the decision support component only for
the category of natural resources. This implies the definition of the appropriate set of
relevant indexes for the natural resources, influenced by the water management policy.
As shown in the literature, five indexes are most relevant for the natural resources category in
the framework of water resource management: the total water resources; the water resources
per capita; the utilization rate of the water resources; the annual rainfall; the water shortage
rate (Zhou & Huang, 2007). These five indexes are grouped into the index layer of the
component. Based on their current values and on the management evaluation procedure, the
Sustainable Natural Resources Management
20
quality of the water resource management policy in respect to the natural resources
preservation is expressed in terms of five fuzzy qualifiers: Worst, Bad, Moderate, Good and
Best, grouped in the output layer of the component – known as the “condition layer”.
The decision support component for the evaluation of water resource management policy in
respect to the natural resources preservation must include a so-called training phase, in
which the specialist helps defining the fuzzy sets membership functions associated to each
index and each linguistic qualifier in a set Q={
Worst, Bad, Moderate, Good, Best} (in respect to
the specific category), and the weights of the indexes in the evaluation. Then, in the
evaluation phase, the current values of the indexes – let us consider them given in the form
of a vector x - are provided to the input of the system. Based on the values in x, the
evaluation algorithm computes a membership degrees vector u[1×5], showing the
confidence in assigning the currently examined water management policy to the fuzzy
categories from Q, in the
Worst to Best order. The vector u of confidence degrees in the
suitability of each linguistic qualifier for the current water management policy in respect to
the resource category is also used in the visual rendering sub-system.
The visual rendering of the evaluation results is achieved as follows. Assume that, for the
current geographical region, we have its geographical map, with some manual marking of
the interest categories, as e.g. the one shown in Figure 10, for the Somes river basin in
Romania, corresponding to a good operation situation. Starting from this image, we would
like to generate two geotypically textured images: one corresponding to the
Worst resource
management case, in which the exploitation was not proper, and one corresponding to the
Best resource management case, with a very good water resource management policy.
In principle, the
Best case geotypically textured map simply needs some texture synthesis
applied on the image in Figure 10, using suitable natural textures for the forest, water, rock –
and the approach we employed to generate the natural looking textured map was a
modified version of the exemplar-based image inpainting approach of (Criminisi
et al.,
2003). An example of inpainting the forest region over the map from Figure 10 is shown in
Figure 11. However, in the
Worst case image, it would be good to also apply some additional
processing; a suitable choice is to perform some morphological operations – as: erosion of
the rivers; dilation of the mountain area, to enhance the visual effect of a very bad policy,
prior to inpainting the map with the suitable textures.
Once the two geotypically textured images corresponding to the two extreme water
resource management qualifiers are created, we would like to display any intermediate
results as given by our assessment fuzzy system. Consider the two images represented as
three-dimensional matrices I
Worst
and I
Best
, of size W
I
×H
I
×3 each, where W
I
is the image
width, H
I
- the image height, and 3 is the number of color components per image. We
already have available the degrees in which the management of the water resources can be
considered
Worst (the value of the first component from the vector u), Bad (the value of the
second component from u),
Moderate (the value of the third component from u), Good (the
value of the fourth component from u) and
Best (the value of the last component from u).
The only thing to be done is to combine the two images I
Worst
and I
Best
to obtain the correct
visualization as a new image I
Result
, according to:
,
1
Result Best Worst
II I
(9)
Fuzzy Image Processing, Analysis and
Visualization Methods for Hydro-Dams and Hydro-Sites Surveillance and Monitoring
21
where is some blending factor ranging between 0 and 1, generated at the output of a
Takagi-Sugeno fuzzy system, with the following configuration:
1.
Input fuzzy sets: the five linguistic qualifiers (Worst, Bad, Moderate, Good, Best)
2.
Output fuzzy sets: five singletons – one for each reference value , corresponding to the
reference case of a Worst, Bad, Moderate, Good or Best management. These values were
chosen intuitively and empirically to: A
Worst
=A
1
=0; A
Bad
=A
2
=0.2; A
Moderate
=A
3
=0.5; A
Good
=
A
4
=0.8; A
Best
=A
5
=1
3.
Rule base: five fuzzy rules, associating each qualifier to an output singleton, in the form:
R
k
: If Qualifier is q then
=A
k
, k=1,2, ,5; q = { Worst, Bad, Moderate, Good, Best}.
As the result of the Takagi-Sugeno inference, the output value for the blending factor
is
given by:
5
1
5
1
.
kk
k
k
k
uA
u
The results of the assessment are illustrated for two different cases of indexes’ values: close
to best management and between bad and moderate, but not worst management, as shown
in Figure 12. The results are compliant to the observer’s expectations.
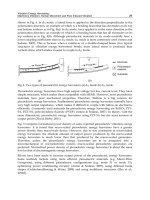
Fig. 10. Illustration of the Somes River Basin marked map, to be further processed in
visualization purposes
Sustainable Natural Resources Management
22
Fig. 11. Illustration of an inpainting result for the forest region with a natural texture,
corresponding to the best resource management case
Fig. 12. Illustration of the water resource management policy assessment for the Resource
category for: The Best management case (confidence 0.926) (left); The Bad to Moderate
management case (confidence 0.41 for Bad and 0.39 to Moderate) (right)
Fuzzy Image Processing, Analysis and
Visualization Methods for Hydro-Dams and Hydro-Sites Surveillance and Monitoring
23
5. Conclusion
This chapter aimed to present a series of novel fuzzy image processing methods and
algorithms implemented in the rather general framework of hydro-dams and hydro-sites
surveillance, monitoring and assessments, emphasizing on their theoretical motivation and
results. Most of these methods have been employed in a hydro-dam and hydro-site
integrated system for the safety decision support of these critical structures, thus the results
are verified on real image data. Future work still needs to be done in this field, as the
integration of the presented fuzzy image analysis algorithms (especially for the visible and
infrared modalities) is just in its beginning; other imaging modalities as e.g. sonar, as well as
the underwater examination of the hydro-dam structure would be of significant interest.
Furthermore, the integration of the hydro-sites surveillance systems with water resource
management policy assessment in the region operated by the dam reservoirs is another
challenging issue.
6. Acknowledgment
Part of the work described in this chapter, as well as the implementation of the system in
Romania and the image acquisition, was performed with the support of the project no.
705/2006 in the frame of CEEX research and development programme, financed by
Romanian Government
7. References
Abare, R. (2006). Shotcrete done right. Failed repair teaches lessons about shotcrete. Public
Works Magazine, January 1, Retrieved from
/>repair.html
Asgian, M.I., Arulmoli, K., Miller, W.O., and Sanjeevan, K. (1988). An expert system for
diagnosis and treatment of dam seepage problems, In: Microcomputer knowledge-
based expert systems in Civil Engineering, Adeli, H., pp. 118-126, American Society of
Civil Engineers (ASCE), ISBN 9780872626539, New York, N.Y.
Bezdek, J. C. (1981). Pattern Recognition with Fuzzy Objective Function Algorithms, Plenum
Press, ISBN 0306406713, New York, N.Y.
Bradlow, D., Palmieri, A., and Salman, S. (2002). Regulatory Frameworks for Dam Safety: A
Comparative Study, World Bank Publications, ISBN 0821351915, Washington, D.C.
Chamorro-Martinez, J., Sanchez, D., Prados-Suarez, B., Galan-Perales, E., and Vila, M.A.
(2003). A hierarchical approach to fuzzy segmentation of colour images, Proceedings
of the 12
th
IEEE International Conference on Fuzzy Systems, Vol. 2, pp. 966 – 971, ISBN
0-7803-7810-5, St. Louis, MO, May 2003
Clairet, J., Bigand, A., and Colot, O. (2006). Color Image Segmentation using Type-2 Fuzzy
Sets, Proceedings of the 1
st
IEEE International Conference on E-Learning in Industrial
Electronics, pp. 52 – 57, ISBN 1-4244-0324-3, Hammamet, Tunisia, December 2006
National Research Council (U.S.) Committee on the Safety of Existing Dams (CSED) (1983).
Safety of existing dams: evaluation and improvement, National Academy Press, ISBN
030903387X, Washington, D.C.
Sustainable Natural Resources Management
24
Craft, C.D., Pearson, R.M., and Hurcomb, D. (2007). Mineral Dissolution and Dam Seepage
Chemistry – The Bureau of Reclamation Experience, Proceedings of the 2007 National
Meeting, Dam Safety 2007, Austin Texas, Lexington, Retrieved from
Criminisi, A., Pérez, P., and Toyama, K. (2003). Object Removal by Exemplar-Based
Inpainting, Proceedings of the IEEE Computer Society Conference on Computer Vision
and Pattern Recognition (CVPR) 2003, Vol. 2, No. 2, pp.721-728, ISBN 0769519008,
Madison, WI, June 2003
Dam Safety Committee (DSC) (2010). Surveillance Reports for Dams, Retrieved from
/>DSC2C.pdf
Dancea, O., Tsatos, O., Gordan, M., and Vlaicu, A. (2010). Adaptive fuzzy c-means through
support vector regression for segmentation of calcite deposits on concrete dam
walls, Proceedings of the 2010 IEEE International Conference on Automation, Quality and
Testing, Robotics (AQTR 2010), Vol. 3, pp. 293-298, ISBN 978-1-4244-6724-2, Cluj-
Napoca, Romania, May 2010
Das, S., Konar, A., and Chakraborty, U.K. (2006). Automatic Fuzzy Segmentation of Images
with Differential Evolution, Proceedings of the IEEE Congress on Evolutionary
Computation (CEC 2006), pp. 2026 – 2033, ISBN 0-7803-9487-9, Vancouver, BC,
Canada, July 2006
Dunn, J. C. (1973). A Fuzzy Relative of the ISODATA Process and Its Use in Detecting
Compact Well-Separated Clusters. Journal of Cybernetics, Vol. 3, No. 3, pp. 32-57,
ISSN 0022-0280
European Parliament (2000). Directive 2000/60/EC (The EU Water Framework Directive).
Official Journal of the European Communities, Vol. OJ L 327, pp. 1-72, ISSN 1725-
2423
Gordan, M., Dancea, O., Vlaicu, A., Stoian, I., Tsatos, O., and Oltean, G. (2007). Hydro-dams
Security Assessment by Visible and Infrared Image Fusion, Proceedings of the 1
st
IFAC Workshop on Convergence of Information Technologies and Control Methods with
Power Plants and Power Systems (ICPS'07), pp. 234-239, ISBN 978-973-713-180-5,
Cluj-Napoca, Romania, July 2007
Gordan, M., Dancea, O., Vlaicu, A., Stoian, I., and Tsatos, O. (2008). Computer Vision
Support Tool for Assessing Concrete Hydro-Dams Surface Deterioration. Journal
of Control Engineering and Applied Informatics, Vol. 10, No. 2, pp. 68-75, ISSN 1454-
8658
Gordan, M., Florea, C., Dancea, O., Stancel, E., and Tsatos, O. (2010). A visualization
enhanced fuzzy decision support tool for water resource management tasks,
Proceedings of the 2010 IEEE International Conference on Automation, Quality and
Testing, Robotics (AQTR 2010), Vol. 3, pp. 105-110, ISBN 978-1-4244-6724-2, Cluj-
Napoca, Romania, May 2010
Hafiane, A., Zavidovique, B., and Chaudhuri, S. (2005). A modified FCM with optimal
Peano scans for image segmentation, Proceedings of the 2005 IEEE International
Fuzzy Image Processing, Analysis and
Visualization Methods for Hydro-Dams and Hydro-Sites Surveillance and Monitoring
25
Conference on Image Processing (ICIP 2005), Vol. 3, pp. 840-843, ISBN 0-7803-9134-9,
Genoa, Italy, September 2005
Marshall, B. D., Neymark, L.A., and Peterman, E.Z. (2003). Estimation of past seepage
volumes from calcite distribution in the Topopah Spring Tuff, Yucca Mountain,
Nevada. Journal of contaminant hydrology, Vol. 62-63 (April-May 2003), pp. 237-247,
ISSN 0169-7722
Najjar, Y. M., Basheer, I.A., and Naouss, W.A. (1996). On the Identification of Compaction
Characteristics by Neuronets. Computers and Geotechnics, Vol. 18, No. 3, pp. 167-187,
ISSN 0266-352X
O’Conaire, C., O'Connor, N., Cooke, E., and Smeaton, A.F. (2006). Comparison of Fusion
Methods for Thermo-Visual Surveillance Tracking, Proceedings of the 9
th
International
Conference on Information Fusion (FUSION 2006), pp. 1-7, ISBN 1-4244-0953-5,
Florence, Italy, July 2006
Ohnishi, Y., and Soliman, M. (1995). Seepage Under Concrete Dam Founded on Rock
Formation using Artificial Neural Networks, Proceedings of the International
Workshop on Rock Foundation of Large Scale Structures, pp. 355-360, Tokyo, Japan,
September 1995
Ollero, A., Martinez-De Dios, J.R., and Arrúe, B.C. (1998). Integrated systems for early
forest-fire detection, Proceedings of the 3
rd
International Conference on Forest Fire
Research and 14
th
Conference on Fire and Forest Meteorology, Vol. 2, pp. 1977-1988,
ISBN 972-97973-0-7, Luso, Portugal, November, 1998
Platt, J. (2000). Probabilistic outputs for support vector machines and comparisons to
regularized likelihood methods, In: Advances in Large Margin Classifiers, Smola, A.,
Bartlett, P., Schölkopf, B., and Schuurmans, D., pp. 61-74, MIT Press, ISBN
0262194481, Cambridge, MA
Shaomin, L., Hai, S., and Cheng, W. (2009). Flood Simulation and Information Management
System’s Design and Implement, Proceedings of the 1
st
International Workshop on
Education Technology and Computer Science (ETCS 2009), Vol. 1, pp.737-740, ISBN
978-1-4244-3581-4, Wuhan, Hubei, China, March 2009
Shi, S., Ye, X., Dong, Z., and Zhou, H. (2006). Research on the Integration of GIS-Based
Digital Valley System, Proceedings of the 1
st
International Multi-Symposiums on
Computer and Computational Sciences (IMSCCS 2006), Vol. 1, pp. 452-457, ISBN 0-
7695-2581-4, Hangzhou, Zhejiang, China, June 2006
Sieh, D., King, D., and Gientke, F. (1988). Dam Seepage Analysis Using Artificial
Intelligence, In: Planning Now for Irrigation and Drainage in the 21st Century, DeLynn,
H., pp 417-422, American Society of Civil Engineers (ASCE), ISBN 9780872626669,
New York, N.Y.
Vapnik, V.N. (1998). Statistical Learning Theory (1
st
Edition), Wiley-Interscience, ISBN
0471030031, New York
Wen, Z., Wu, Z., and Su, H. (2004). Safety monitoring system of dam based on bionics,
Proceedings of 2004 International Conference on Machine Learning and Cybernetics, Vol.
2, pp. 1099 – 1104, ISBN 0-7803-8403-2, Shanghai, China, August 2004
Sustainable Natural Resources Management
26
Yin, Z., and Malcolm, A. (2000). Thermal and Visual Image Processing and Fusion, SIMTech
Technical Report AT/00/016/MVS, Retrieved from tech.a-
star.edu.sg/Research/TechnicalReports/TR0630.pdf
Zhou, Y., and Huang, J. (2007). An AHP-Based Fuzzy Evaluation Approach to Management
of Sustainable Water Resources, Proceedings of the 2007 International Conference on
Wireless Communications, Networking and Mobile Computing (WiCom 2007), pp. 5025
– 5028, ISBN 978-1-4244-1311-9, Shanghai, China, September 2007
2
Upstream Landscape Dynamics of US National
Parks with Implications for Water Quality and
Watershed Management
William B. Monahan and John E. Gross
Inventory and Monitoring Program
United States National Park Service
Fort Collins, Colorado
USA
1. Introduction
The mission of the United States (US) National Park Service (NPS) is to “conserve the
scenery and the natural and historic objects and the wild life therein and to provide for the
enjoyment of the same in such manner and by such means as will leave them unimpaired
for the enjoyment of future generations” (NPS, 1916). NPS currently manages 397 parks
covering about 358,200 km
2
, or approximately 4% of all US states and territories. The
National Park system includes approximately 300 parks that are considered to contain
significant natural resources. These parks are key components of a larger network of
protected areas that anchor the conservation of natural resources in the US. They also afford
direct protection for a number of important and defining resources in the US, including 421
species of threatened or endangered plants and animals, nearly two-thirds of native fishes in
the 50 states (Lawrence et al., 2011), the highest point in North America (Mt. McKinley in
Denali National Park, 6,194 m), the longest cave system in the world (Mammoth Cave
National Park with more than 587 mapped km of caves), the country’s deepest lake (Crater
Lake in Crater Lake National Park, 589 m), the lowest terrestrial point in the western
hemisphere (Badwater Basin in Death Valley National Park at 86 m below sea level), and –
within these extremes – many other natural resources that are significant at local, regional,
and national scales.
While protected areas are foundational to a strong natural resource conservation network,
ecologists have long recognized that virtually all parks are too small to be self-sustaining
ecosystems, and activities outside park boundaries can profoundly impact park resources
(Newmark, 1985; US General Accounting Office, 1994; Parks & Harcourt, 2002; Wiersma et
al., 2004; Hansen & DeFries, 2007; Hansen et al., 2011). Chief among these activities is the
intensification of land use and the appropriation of ecological services. Land use
intensification leads to the conversion of natural habitat, which generally results in an
overall loss of habitat, fragmentation of remaining natural areas, increases in edge zones,
changes in the runoff of water, sediments, and nutrients, and follow-on modification of
physical and ecological processes in terrestrial and aquatic ecosystems. Depending on the
Sustainable Natural Resources Management
28
location, extent, and magnitude of these anthropogenic changes, the effects may propagate
over very large areas and have important consequences for resource management in
protected areas.
While the NPS mission is to protect all natural resources, water is perhaps the most
universally important resource to parks and to protected areas worldwide. Provision of
fresh water is a key ecosystem service provided by many parks, and wetlands and riparian
habitats are often biological ‘hot spots’ that support disproportionately high levels of
biodiversity (Stein et al., 2000; Scott et al., 2001). Because fresh water resources are so
important to parks, the focus of this chapter is on landscape-scale factors that affect water
resources and associated values. Flowing water directly connects water resources inside and
outside park boundaries. Landscape-scale activities beyond park boundaries can
particularly affect water resources and the ability of parks to manage and protect these
resources. A means to identify and quantify imposing threats is thus important to designing
and implementing effective park management strategies.
To manage an extensive network of protected areas like the NPS system of parks, there is a
clear need to assess the system-wide context and status of parks relative to their goals (Scott
et al., 2001; Svancara et al., 2005). Results from broad-scale analyses can identify patterns and
trends that may be undetectable at the individual unit scale, and provide guidance for
changes in regional or national-level policy. Scott et al., (2001), for example, noted that US
protected areas (parks, refuges, etc) disproportionately represent lands characterized by
high elevation, low productivity, and low rainfall – the places that are cold, dry, and barren.
Areas in highly productive river valleys – the location of many biodiversity hot spots – were
disproportionately under-represented in the network of protected areas. The widespread
availability of broad-coverage, geospatial data on environmental conditions and landscape
attributes has facilitated new and sophisticated analyses of the geographical context and
anthropogenic impacts to terrestrial, freshwater, coastal, and marine ecosystems at regional,
national, and global scales (Sanderson et al., 2002; Halpern et al., 2007, 2008; Leu et al., 2008;
Woolmer et al., 2008; Lawrence et al., 2011).
While a few studies have measured and assessed the landscape characteristics of US
National Parks (Scott et al., 2001; Svancara et al., 2009; Davis & Hansen, in press; Wade et al.,
2011), these efforts focused on the broader landscape context or specific components of the
landscape, rather than watersheds, even though water is one of the most defining resources
for parks and other protected areas (Dixon & Sherman, 1991; Hawkins et al., 2003). To our
knowledge, only Lawrence et al., (2011) have rigorously evaluated system-wide the
upstream landscape dynamics of US National Parks, specifically from the perspective of
maintaining protection for freshwater fish diversity. They used broad-scale datasets to
assess both threats to the use of parks as ‘freshwater protected areas’ and the potential
capacity to manage activities in the contributing watersheds. Based on a relatively simple set
of analyses, but involving computationally intensive operations, they were able to identify a
subset of parks that could serve as the foundation for a system that would likely preserve a
large proportion of US freshwater fish.
To guide the analyses in this chapter, we asked a series of questions:
1. Based on established ecological principles and landscape-scale data, what is the general
context of park upstream watersheds?
Upstream Landscape Dynamics of
US National Parks with Implications for Water Quality and Watershed Management
29
2. Which major landscape factors explain most among-park variation in upstream
watershed context?
3. What can we infer about the condition of park freshwater resources, and how do these
vary geographically?
4. What are the major challenges and opportunities for managing park upstream
watersheds?
We first describe the ecological foundation and general approach to evaluating park
upstream watersheds. We proceed to describe the selection of variables and data sources
used in the analyses, and briefly review the ecological basis for including those variables.
We then outline the analytical techniques and criteria for including or omitting parks from
the study. The final sections of the chapter present the results of our watershed and water
quality analyses, and our interpretation of these results. We conclude with a summary of
our principal findings and recommendations for future research.
2. Assessing watershed condition
2.1 Ecological foundation
Figure 1 illustrates our overall conceptual model for assessing parks at a landscape scale.
The model acknowledges key anthropogenic drivers (or stressors), important attributes of
the natural landscape, and contextual elements that affect conservation and management
actions. Analyses that consider these elements can evaluate geospatially explicit broad-scale
vulnerabilities and opportunities for conservation and management. Our model is founded
on more comprehensive analyses by Hansen & DeFries, (2007) of the mechanisms that link
land use intensification to the resources within protected areas.
Fig. 1. Conceptual model used as a basis for landscape-scale assessment of parks.
Sustainable Natural Resources Management
30
Broad-scale data generally available include the human drivers represented in the model,
and all of these drivers are well known to influence biodiversity and other park resources.
Natural systems can be characterized in many ways, and the types of attributes in Figure 1
are a subset of important attributes that can be used to assess the context and condition of
natural systems. The conservation context provides information that may be essential to
decisions on land management. Svancara et al., (2009) conducted a national-level analysis by
county of the conservation context of US national parks and refuges, and they discuss the
use of this information to achieve conservation goals.
2.2 Landscape variables and data sources
Using the conceptual model as an overarching framework, we approached our analyses
within the broader goals of the NPS landscape dynamics monitoring project, NPScape
( NPScape is designed to support
landscape-scale monitoring conducted by the NPS Inventory and Monitoring Program
(Fancy et al., 2009). Key NPScape objectives are to provide: a coherent conceptual and
analytical framework for conducting landscape-scale analyses and evaluations that can
inform decisions; Geographic Information System (GIS) data and maps at broad spatial
scales that transcend the bounds of park-level data; well-documented methods founded on
strong science that are readily repeatable and extensible with local data; and, assistance to
parks in interpreting results.
In support of these objectives, NPScape produces and delivers a suite of landscape-scale
datasets, methods, GIS scripts and tools, maps, and guidance reports to approximately 300
natural resource parks in the NPS system. Results from NPScape are intended to inform
resource management and planning at multiple scales. Because the overarching goal of
NPScape is to deliver information to parks across the entire NPS system, inputs are limited
to data sources that cover broad spatial extents (i.e., regional to national).
NPScape incorporates a large number of datasets that can be roughly categorized into
‘base layers’ and ‘variables’. Base layers are such things as topography, jurisdictional
boundaries, hydrography, and the other geospatial data that are relatively static and that
generally serve as covariates or provide a geopolitical context. The NPScape variables
considered here address two major elements in our conceptual model: stressors and
conservation context.
Important stressors are evaluated by measures of population, housing, roads, and
impervious surface (a category of land cover). Conservation context was evaluated from
the percentage of land in a protected status, and potential management partnerships from
the number of different agency or institutional owners of conservation lands. The
NPScape data sources and variables used in our analyses are described in Tables 1 and 2.
Although NPScape includes a variety of other metrics related to natural land cover and
landscape pattern, we did not use these in our national-level assessment because they
require a more in-depth analysis at ecoregional scales. Our present focus on human
drivers and conservation context is designed to serve as a foundation to these future
studies.