Sustainable Natural Resources Management Part 13 ppt
Bạn đang xem bản rút gọn của tài liệu. Xem và tải ngay bản đầy đủ của tài liệu tại đây (394.48 KB, 10 trang )
Assessment of Livestock Loss Factors in the Western Serengeti, Tanzania
157
farmers who keep livestock and practice crop production. Many of the farmers harvest
natural resources inside the protected areas for domestic consumption. For instance, during
the dry season, livestock keepers illegally graze and water their livestock in the protected
areas (Nyahongo et al., 2005). In addition, illegal hunting within the protected areas is well
documented and illegal bushmeat hunters may sell the illegally obtained meat to generate
income (Arcese et al., 1995; Campbell & Hofer, 1995; Loibooki et al., 2002; Nyahongo et al.,
2005; Holmern et al., 2007a).
Fig. 1. Map of the western Serengeti showing the sampled villages.
3. Data collection
The current study was conducted between April and December 2006. Households were
selected in the following four villages; Robanda, Nyamakendo, Nattambiso and Kowak.
The first three villages were within 10 km from the boundary of the park while Kowak
village was located about 80 km from the park. Households were selected randomly
according to household lists in the villages. For practical reasons (livestock counting
time), we omitted household with more than 200 individual cattle, goats or sheep because
Sustainable Natural Resources Management
158
it was difficult to count the animals each time. January, February and March 2006 were
spent in the villages to introduce researchers to livestock keepers and to establish baseline
data on livestock numbers per selected household. Livestock owners were informed about
the essence of this study and were assured that the data was only collected for research
purpose and not for other purposes like baseline data for setting livestock levels by the
government. After recording the baseline data (i.e. initial numbers of livestock per
selected household), we appointed enumerators. Enumerators were recording any
livestock that died due to diseases, were lost while grazing in the field (hereafter referred
to as poor management), those which were stolen or were depredated. In addition they
recorded livestock that were slaughtered. The gain of livestock recorded included new-
born calves, bought or paid as dowry. While enumerators were collecting data on a daily
basis, the researchers visited each household after every three months to recount the
animals in order to cross check the data that enumerators collected. This was due to the
fact that a researcher was also doing some questionnaire surveys in the area. Furthermore,
livestock owners were asked about the livestock status during the past three months.
Livestock were either counted in the morning before being sent out for grazing (normally
2 to 3 km away from the night holding enclosures) or in the evening when they were
brought back to the night holding enclosures. The counting rate was 15 to 20 households
per day and we spent one week in each village.
All livestock were prized according to matured livestock because market prices for livestock
are only set for mature animals. This allowed us to be able to calculate the mean cost of
livestock loss causes per household per year.
4. Statistical analyses
All analyses were performed using SPSS 16 statistical package. Non-parametric statistics
were applied to test differences among the loss factors.
5. Results
5.1 Causes of livestock gain and loss
Mean household livestock and the subsequent costs or benefits in monetary terms for the
current values of livestock species in each village are summarized in Tables 1 and 2.
Regardless of household locality, various loss causes affected livestock differently (cattle:
Friedman test,
2
= 233.7, df = 3, n = 182, p < 0.001; goats: Friedman test,
2
= 134.1 df = 3, n
= 155, p < 0.001; sheep: Friedman test,
2
= 81.3, df = 3, n = 123, p < 0.001, Fig. 2).
Furthermore, mean number of cattle and goats sold per household was higher than the
number slaughtered (cattle: Wilcoxon sign rank test, Z = -7.24, n = 182, p < 0.001; goats:
Wilcoxon sign rank test, Z = -3.214, n = 155, p = 0.001) but this was not the case for sheep
(Wilcoxon sign rank test, Z = -0.70, n = 123, p = 0.484). In all households, new born calves,
and not animals that were bought or paid as dowry, was the significant source of
replenishment of livestock numbers (cattle: Wilcoxon sign rank test, Z = -8.54, n = 182, p <
0.001; goats: Wilcoxon sign rank test, Z = -8.38, n = 155, p < 0.001; Sheep: Wilcoxon sign rank
test, Z = -7.56, n = 123, p < 0.001).
Assessment of Livestock Loss Factors in the Western Serengeti, Tanzania
159
Livestock
numbers and
loss/gain
Robanda Nyamakendo Nattambiso Kowak Overall
N
Cattle
37
Goats
10
Sheep
15
Cattle
49
Goats
49
Sheep
26
Cattle
46
Goats
45
Sheep
28
Cattle
50
Goats
51
Sheep
54
Cattle Goats Sheep
Mean
numbers
(± SD)
23.4
(17.2)
9.4
(6.0)
13.0
(22.9)
15.2
(12.9)
13.9
(12.2)
8.3
(14.0)
21.6
(12.2)
16.8
(15.0)
14.6
(14.7)
22.5
(22.1)
8.5
(11.7)
9.0
(11.8)
20.5
(16.8)
12.1
(11.2)
11.2
(15.8)
Livestock gain
(%)
Newborn 10.3 21.3 16.2 5.9 15.1 10.8 9.3 16.1 18.5 5.3 11.8 11.1 7.7 16.1 14.2
Bought 1.7 1.1 0.8 3.3 3.6 1.2 2.3 2.4 2.0 0.9 2.3 2.2 2.1 2.4 1.6
Livestock loss
(%)
Diseases 3.4 4.3 5.4 2.6 6.5 2.4 5.1 10.1 5.5 3.1 7.1 6.7 3.5 7.0 5.0
Loss in the
bush
0.4 0 1.5 0.2 1.4 0 0.5 1.2 1.4 0.4 1.2 1.1 0.4 0.9 1.0
Depredation 0.4 0.3 1.5 0.1 0.7 1.2 0.1 1.8 0.7 0.3 4.7 5.6 0.2 1.9 2.2
Theft 0 0 0.1 0.2 0.1 1.2 0.1 0.1 0.1 0.2 0.3 0.3 0.1 0.1 0.4
Household
expenditure
(%)
Sold 2.1 3.2 4.6 4.6 5.8 2.4 2.8 2.4 1.4 1.3 3.5 4.4 2.7 3.7 3.2
Slaughtered 0.4 1.1 0.8 0.5 1.4 1.2 0.5 3.0 2.0 0.1 2.3 2.2 0.4 2.0 1.6
Mean
recruitment
(%)
5.3 13.5 3.1 1.0 2.8 3.6 2.5 -0.1 9.4 0.8 -5.0 -7.0 2.4 2.8 2.3
Note: % means the percentage of the total livestock per village.
Table 1. Mean number of livestock per household and proportion of livestock loss or gain
causes (livestock loss causes: diseases, loss in the bush (poor management while grazing),
depredation and theft; livestock gain: newborn and bought/paid as dowry; household
expenditure: sold and slaughtered for meat)
5.2 Comparison of livestock loss causes among villages
Overall, the mean numbers of livestock that were depredated was higher in Kowak village
(about 80 km from the park boundary) than in villages that were close to the park boundary
(Nattambiso, Nyamakendo and Robanda) (Kruskal-Wallis, H = 14.52, df = 3, p = 0.002,
Kowak: rank = 252, n = 156, Nattambiso: rank = 223.6, n = 119, Nyamakendo: rank = 211.7, n
= 123, Robanda: rank = 225.8, n = 62). However, the difference among species that were
depredated among villages was not statistically significant (Cattle: p = 0.09, Goat: p = 0.113,
Sheep: p = 0.119). In all livestock depredation events spotted hyena Crocuta crocuta was the
only carnivore reported to be responsible for livestock killing.
Mean number of cattle that died of diseases differed significantly among the villages
(Kruskal-Wallis, H = 17.07, df = 3, p = 0.001). Furthermore, the difference in mean number of
cattle that were stolen among villages was almost significant (Kruskal-Wallis, H = 7.12, df =
3, p = 0.068). The remaining cattle loss causes did not differ significantly among villages (p >
0.09 for all cases).
Loss causes in goats did not differ significantly among the four villages (p > 0.076 for all
cases). However, for sheep, loss due to diseases and poor management differed significantly
among the villages (Kruskal-Wallis, H = 9.10, df = 3, p = 0.028 and H = 8.85, df = 3, p = 0.031,
Sustainable Natural Resources Management
160
respectively), while theft and depredation on livestock did not differ among the four
villages (p > 0.118 for all cases).
5.3 Comparison of livestock loss causes among livestock species
Generally, regardless of distance from the park boundary, mean number of livestock species
that were sold, slaughtered for food and that were killed by spotted hyenas differed
significantly between livestock species (sold: Kruskal-Wallis, H = 10.82, df = 2, p = 0.005;
slaughtered: Kruskal-Wallis, H = 17.09, df = 2, p < 0.001; predated: Kruskal-Wallis, H =
14.01, df = 2, p = 0.001). Households sold more cattle (mean rank = 248.5) than goats (mean
rank = 231.4) or sheep (mean rank = 202.7). However, households slaughtered more goats
for food (mean rank = 249.6) than sheep (mean rank = 243.2) or cattle (mean rank = 205.6). In
contrast, sheep were more frequently killed by spotted hyenas (mean rank = 246.6) than
goats or cattle (goat: mean rank = 241.1; cattle: mean rank = 210.6). The remaining loss
causes did not differ significantly among species (p > 0.151).
Livestock
numbers
and
loss/gain
Robanda Nyamakendo Nattambiso Kowak Overall values (US$)
Cattle Goats
Sheep
Cattle
Goats
Sheep
Cattle Goats
Sheep
Cattle
Goats
Sheep
Cattle Goats Sheep
Mean
value of
livestock
1872.0 188.0 260.0 1216.0
278.0 166.0 1728.0
336.0
292.0 1800.0
170.0 180.0 1654.0 243.0 224.0
Livestock
gain
values
(US$)
Newborn
192.8 40.0 42.1 71.7 42.0 17.9 160.7 54.1 54.0 95.4 20.1 20.0 130.1 39.1 33.5
Bought 31.8 2.1 2.1 40.1 10.0 2.0 39.7 33.9 5.8 16.2 3.9 4.0 31.9 12.5 3.5
Livestock
loss (US$)
Disease 63.6 8.1 14.0 31.6 18.1 4.0 88.1 10.1 16.1 55.8 12.1 12.1 59.8 12.1 11.6
Depreda-
tion
7.5 0.6 3.9 1.2 1.9 2.0 1.7 6.0 2.0 5.4 8.0 10.1 4.0 4.1 4.5
Loss in
the bush
7.5 0 3.9 2.4 3.9 0 8.6 4.0 4.1 7.2 2.0 2.0 6.4 2.5 2.5
Theft 0 0 0.3 2.4 0.3 2.0 1.7 0.3 0.3 3.6 0.5 0.5 1.9 0.3 0.8
Household
expendi-
ture (US$)
Sold 39.3 6.0 12.0 55.9 16.1 4.0 48.4 8.1 4.1 23.4 5.9 7.9 41.8 9.0 7.0
Slaughte-
red
7.5 6.0 2.1 6.1 3.9 2.0 8.6 10.1 5.8 1.8 3.9 4.0 6.0 6.0 4.5
Note: Mean local market price of one cattle in the study area was US$ 80, and for goat/sheep was US$
20 in 2006, (the prices were for mature animals).
Table 2. Cost and benefit implications of livestock loss and/or gain causes (US $)
5.4 Economic significance of livestock loss or gain causes
In total, the mean economic value of livestock that households from four villages owned
was TSh 3,181,500 (US$ 2121) (sum of cattle, goats and sheep per household) and newborn
Assessment of Livestock Loss Factors in the Western Serengeti, Tanzania
161
calves per household were worth TSh 304,050 (US$ 202.7). When the effect of livestock loss
causes were pooled, diseases were responsible for TSh 124,500 (US$ 83) per household,
while wild carnivores caused TSh 18,900 (US$ 12.6) per household. On average, the value of
livestock sold per household was TSh 86,700 (US$ 57.8). Livestock losses due to theft and
poor management were TSh 21,600 (US$ 14.4) while animals slaughtered for meat were
worth TSh 24,750 (US$ 16.5) per household. Each village cost-benefit analysis of each loss or
gain causes is summarized in Table 2.
0
5
10
15
20
25
(%)
Robanda
0
5
10
15
20
25
(%)
Nyamakendo
0
5
10
15
20
25
(%)
Nattambiso
Loss/gain factors
0
5
10
15
20
25
(%)
Kowak
Loss/gain factors
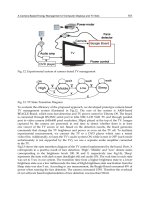
Note: Solid black column represent cattle; column with dotted represent goat and open column
represent sheep
Fig. 2. Overall livestock population dynamics (loss and gain) in four villages recorded from
April to December 2006.
Robanda
Nyamakendo
Nattambiso
Kowak
Sustainable Natural Resources Management
162
6. Discussion
The results of this study suggest that diseases are responsible for higher livestock loss than
any other cause within and among villages. However, sheep loss due to diseases and poor
management differed significantly among the villages. Mean number of cattle and goats
sold was higher than the number slaughtered in all villages. In all households, new born
calves were the most significant source of replenishment of livestock numbers. Livestock
species that were sold, slaughtered for food and killed by spotted hyenas differed
significantly between species whereof goats and sheep were more frequently slaughtered
for food than cattle.
Disease is the major factor responsible for livestock loss in sub-Saharan Africa (Gifford-
Gonzalez, 2000). This factor alone, although not recognized by farmers in Africa (Mwangi,
1997), was responsible for a loss of US$ 83.5 per household during the nine months study
period. When this figure is compared to the average annual cash income per household in
the western Serengeti (US$ 140, (Borge, 2003), loss because of diseases were responsible for
59.6 % of the average annual household income in the target villages. On average, diseases
contributed 5.1 times more of livestock loss than depredation. This observation is consistent
with previous studies in the same area when farmers were requested to rank major factors
of livestock loss (Nyahongo, 2004). Livestock keepers may not observe the direct effect of
diseases on their livestock production due to the fact that sick animals may be slaughtered
and used as food or sold to neighbors while carnivores often consume all edible parts of a
kill, leaving nothing for human consumption. Moreover, diseases often kill a larger number
of new born calves than adults (Nyahongo, pers. Obs, 2006). Livestock keepers may not
observe this as an important loss because the capital investment in terms of veterinary
services, feeding or grazing time and/or output in terms of meat or money (when sold) is
relatively much lower for new-born calves than for adults. Moreover, due to poor livestock
management records, livestock keepers may not be able to know how many livestock they
loose to diseases within a specific period of time. Most of the household in this study did not
keep any record showing their number of livestock, new born or even the last time animals
were treated and the costs implication. In contrast, when a predator breaks into the livestock
enclosures, usually at night (Nyahongo, 2004; Kolowski & Holekamp, 2006; Holmern et al.,
2007b) it may kill several adult animals which may result in serious economic consequences
for the livestock keepers. However, since the compensation scheme that may offset some of
the costs are always lacking in Tanzania, negative attitudes towards carnivores may have
developed among farmers, which have resulted in retaliatory killing practices of carnivores
in or close to village proximities (Holekamp & Smale, 1992; Ogada et al., 2003; Dickman,
2005; Frank et al., 2005; Graham et al., 2005; Holmern et al., 2007b).
A relatively higher number of sheep and goats were depredated by spotted hyena in the
village that was located furthest away from the park boundary. This suggests that even in
open areas with high anthropogenic activities, there are still some refuges for some large
carnivores like spotted hyenas. This observation suggests a need of including a section in
the current wildlife policy to accommodate the protection of wildlife in anthropogenic
dominated areas. For instance, certain carnivore species such as spotted hyenas have the
ability to commute up to 80 km (Hofer & East, 1993) allowing them to forage even in
villages located far from the protected areas. The findings of the present study is
inconsistent with the idea that high depredation is always highest close to reserves
Assessment of Livestock Loss Factors in the Western Serengeti, Tanzania
163
boundaries (Mwangi, 1997). However, as Woodroffe (2000) puts it, behavioral plasticity of
certain carnivore species facilitate their adaptive adjustment to an increasingly precarious
lifestyle in proximity to human, a fact that was reported for spotted hyenas in the Maasai
Mara ecosystem (Boydston et al., 2003). Thus, we cannot conclude that the spotted hyenas
reported at the distant villages commuted from Serengeti or were resident to the village
areas.
Analyses of our data suggests that cattle are kept to solve household needs that require
relatively huge amounts of money while goats and sheep are kept to tackle small household
needs and/or are slaughtered to provide meat protein to the household. This might be due
to the fact that the economic value of one cattle is equivalent to about four goats or sheep.
These ideas are supported by comparing the number of cattle, goats and sheep that were
slaughtered and those that were sold. The proportions of cattle slaughtered were far less
than those sold by households in the study villages (Table 1, Fig 2).
Variables like available water and grazing land, weather, market prices of meat (that could
lead to elevated theft rate), and animal population dynamics in the villages and in the
protected areas adjacent to village areas, diseases occurrence, may, as the variables included
in the analyses, show considerable between year variations. These confounding variables,
which cannot be controlled for in a snap shot study like the present one, might have
influenced the data we collected. For instance, death of livestock due to diseases may
increase with drought or with rain intensity and duration, which cannot be precisely
compared within a year because intensity of rain and duration of rain seasons may differ in
different areas each year in Tanzania affecting pasture quality and available water for
animals. Drought may also influence the number of livestock sold to buy food, because crop
production in the country largely depends on rain. Weather, on the other hand may
influence the survival of new born calves or may influence the level of depredation.
Woodroffe and Frank (2005) observed that rate of livestock depredation by large carnivores
increased with increasing rainfall. Exclusion of households with more than 200 animals
might have further led to an underestimation of livestock loss because more death from
disease (due to density dependent danger of infectious diseases), livestock depredation,
theft and loss due to poor management in the grazing field may be expected to increase with
an increase in livestock numbers.
7. Conclusion
The results from this study show that diseases are the major cause of livestock loss in
villages surrounding SNP and that the levels of loss do not vary much among households in
the western Serengeti. In contrast, livestock depredation by spotted hyena was relatively
low, although it was relatively higher for goats and sheep in household at the most distant
village. Likewise, poor management and theft that can be managed at household level
causes livestock losses as well. However, at the household level, a single depredation event
may cause a serious economic loss.
Livestock depredation may be higher in the areas with high human activities, which
encourage wildlife managers, conservationists and wildlife ecologists to think deeply about
livestock depredation along the gradient of distance from the park and the future
conservation of the carnivores along the same gradient.
Sustainable Natural Resources Management
164
This study suggest that local people would benefit from better education on animal
husbandry practices and extension service to help them maintain the health of their
livestock and to prevent theft and loss of livestock while grazing. We recommend that
disease control and management should be integrated as part of the regional and national
development programs to limit disease transmission between livestock and wildlife and
even among livestock in the villages. Further studies on the types and epidemiology of
diseases causing major livestock losses in the area should be conducted in order to design
appropriate disease control measures.
8. Acknowledgements
The current study was funded by NORAD through the Ministry of Natural Resources and
Tourism, Tanzania and was a part of the Tanzania Wildlife Research Institute (TAWIRI),
Norwegian Institute for Nature Research (NINA) and Norwegian University for Science and
Technology (NTNU) project called Biodiversity and Human Wildlife Interface in Western
Serengeti. We acknowledge the financial support from the Norwegian Peace Corps and the
Quota Programme Scheme (NORAD). We thank Commission for Science and Technology
(COSTECH) and Tanzania National Parks (TANAPA) for granting permissions to the
foreign researchers to work in Serengeti National Park. We thank T. Holmern and B. Stokke
for their valuable comments during the preparation of the manuscript. Finally, we thank
village leaders and our field assistants who in one way or the other contributed to this
important task.
9. References
Arcese, P., Hando, J. & Campbell, K. (1995) In Serengeti II. Dynamics, Managements, and
Conservation of an Ecosystem. (eds A. R. E. Sinclair & P. Arcese), pp. 506-533.
University of Chicago Press, Chicago, Ill, USA.
Berry, H. (1990) The Lions of Etosha. Cat News, 13, 11-12.
Borge, A. (2003) Essays on the Economics of African Wildlife Utilization and Management.
Norwegian University of Science and Technology.
Boydston, E. E., Kapheim, K. M., Watts, H. E., Szykman, M. & Holekamp, K. E. (2003)
Altered Behaviour in Spotted Hyenas Associated with Increased Human Activity.
Animal Conservation, 6, 207-219.
Campbell, K. & Hofer, H. (1995) In Serengeti II: Dynamics, Management and Conservation of an
Ecosystem (eds A. R. E. Sinclair & P. Arcese), pp. 534-570. The University of Chicago
Press, Chicago, Ill.
Dickman, A. J. (2005) An Assessment of Pastoralist Attitudes and Wildlife Conflict in the Rungwa-
Ruaha Region, Tanzania with Particular Reference to Large Carnivores Oxford
University.
Frank, L. G., Woodroffe, R. & Ogada, M. O. (2005) In People and Wildlife Conflicts or
Coexistence? (eds R. Woodroffe, S. Thirgood & A. Rabinowitz), pp. 286-304.
Cambridge University Press, Cambridge, UK.
Gifford-Gonzalez, D. (2000) Animal Disease Challenges to the Emergency of Pastoralism in
Sub-Saharan Africa. Archaelogical Review, 17, 95-139.
Assessment of Livestock Loss Factors in the Western Serengeti, Tanzania
165
Graham, K., Beckerman, A. P. & Thirgood, S. (2005) Human-Predator-Prey Conflicts:
Ecological Correlates, Prey Losses and Patterns of Management. Biological
Conservation, 122, 159-171.
Hofer, H., Campbell, K. L. I., East, M. L. & Huish, S. A. (1996) In The Exploitation of Mammal
Populations (eds J. Taylor & N. Dunstone), pp. 117-146. Chapman and Hall, London,
UK.
Hofer, H. & East, M. L. (1993) The Commuting System of Serengeti Spotted Hyaenas - How
a Predator Copes with Migratory Prey .2. Intrusion Pressure and Commuters Space
Use. Animal Behaviour, 46, 559-574.
Holekamp, K. E. & Smale, L. (1992) pp. 19-20. IUCN, SSC Hyena Specialist Group
Holmern, T., Muya, J. & Røskaft, E. (2007a) Local Law Enforcement and Illegal Bushmeat
Hunting Outside the Serengeti National Park, Tanzania. Environmental
Conservation, 34, 55-63.
Holmern, T., Nyahongo, J. W. & Røskaft, E. (2007b) Livestock Loss Caused by Predators
Outside the Serengeti National Park, Tanzania. Biological Conservation, 135, 518-542.
Infield, M. (1996) In East African Livestock Conference, Small Ruminant Collaborative Research
Support Program University of California, Entebe, Uganda.
Kaltenborn, B. P., Bjerke, T., Nyahongo, J. W. & Williams, D. R. (2006) Animal Preferences
and Acceptability of Wildlife Management Actions Around Serengeti National
Park, Tanzania. Biodiversity and Conservation, 15, 4633-4649.
Kaltenborn, B. P., Bjerke, T. & Strumse, E. (1998) Diverging Attitudes Towards Predators: Do
Environmental Beliefs Play a Part? Human Ecology Review, 5, 1-9.
Kaltenborn, B. P., Bjerke, T. & Vittersø, J. (1999) Attitudes Toward Large Carnivores Among
Sheep Farmers, Wildlife Managers, and Research Biologists in Norway. Human
Dimension and Wildlife, 4, 57-73.
Kellert, S. R. (1985) Public Perceptions of Predators, Particularly the Wolf and Coyote.
Biological Conservation, 31, 167-189.
Kock, R. A. (2003) PACE Eridemiology Unit, AU/IBAR, Nairobi, Kenya.
Kolowski, J. M. & Holekamp, K. E. (2006) Spatial, Temporal, and Physical Characteristics of
Livestock Depredations by Large Carnivores along a Kenyan Reserve Border.
Biological Conservation, 128, 529-541.
Lindsey, P. A., du Toit, J. T. & Mills, M. G. L. (2005) Attitudes of Ranchers Towards African
Wild Dogs I: Conservation Implications on Private Land. Biological Conservation,
125, 113-121.
Loibooki, M., Hofer, H., Campbell, K. L. I. & East, M. L. (2002) Bushmeat Hunting by
Communities Adjacent to the Serengeti National Park, Tanzania: The Importance of
Livestock Ownership and Alternative Sources of Protein and Income.
Environmental Conservation, 29, 391-398.
Mills, G. & Hofer, H. (1998) (ed I. S. H. S. Group), Information Press, Oxford, UK.
Mwangi, N. S. (1997) A Cost-Benefit Analysis of Livestock Predation on the Group Ranches in the
Dispersal Areas of Maasai Mara National Reserve, Kenya. Moi University.
Nabane, N. (1995) In Wildlife and Development Series International Institute for Environment
and Development, London, UK.
Nabane, N. (1996) Zimbabwe: Whose CAMPFIRE? Gender Issues in Community-Based
Conservation: The Case of Masoka Village. The Rural Extension Bulletin: Special Issue
on Community Conservation, 10, 46-49.
Sustainable Natural Resources Management
166
Nyahongo, J. W. (2004) Impact of Human Activities on Carnivore Populations in the Western
Serengeti Ecosystem. University of Dar-es-Salaam.
Nyahongo, J. W., East, M. L., Mturi, F. A. & Hofer, H. (2005) Benefits and Costs of Illegal
Grazing and Hunting in the Serengeti Ecosystem. Environmental Conservation, 32,
326-332.
Ogada, M. O., Woodroffe, R., Oguge, N. O. & Frank, L. G. (2003) Limiting Depredation by
African Carnivores: the Role of Livestock Husbandry. Conservation Biology, 17,
1521-1530.
OIE (2003) Office International des Epizooties, Paris, France.
Perry, B. D., Randolph, T. F., McDermott, J. J., Sones, K. R. & Thornton, P. K. (2002) pp. 148.
International Livestock Research Institute (ILRI), Nairobi, Kenya.
Rasmussen, G. S. A. (1999) Livestock Predation by the Painted Hunting Dog Lycaon pictus in
a Cattle Ranching Region of Zimbabwe: a Case Study. Biological Conservation, 88,
133-139.
Røskaft, E., Bjerke, T., Kaltenborn, B. P., Linnell, J. D. C. & Andersen, R. (2003) Patterns of
Self-reported Fear Towards Large Carnivores Among the Norwegian Public.
Evolution and Human Behavior, 24, 184-198.
Røskaft, E., Händel, B., Bjerke, T. & Kaltenborn, B. P. (2007) Human Attitudes Towards
Large Carnivores in Norway. Wildlife Biology, 13, 172-185.
Stuart, C. T., MacDonald, I. A. W. & Mills, M. G. L. (1985) History, Current Status and
Conservation of Large Mammalian Predators in Cape Province, Republic of South
Africa Biology Conservation, 31, 7-19.
Thomson, G. R., Vosloo, W. & Bastos, A. D. S. (2003) Foot and Mouth Disease in Wildlife.
Virus Research, 19, 145-161.
Treves, A. & Karanth, K. U. (2003) Human-carnivore Conflict and Perspectives on Carnivore
Management Worldwide. Conservation Biology, 17, 1491-1499.
Treves, A., Naughton-Treves, L., Harper, E. K., Mladenoff, D. J., Rose, R. A., Sickley, T. A. &
Wydeven, A. P. (2004) Predicting Human-carnivore Conflict: a Spatial Model
Derived from 25 Years of Data on Wolf Predation on Livestock. Conservation
Biology, 18, 114-125.
URT (2002) (ed Tourism-Department), Ministry of Natural Resources and Tourism, Dar es
Salaam, Tanzania.
Vittersø, J., Kaltenborn, B. P. & Bjerke, T. (1998) Attachment to Livestock and Attitudes
toward Large Carnivores among Sheep Farmers in Norway. Anthrozoös, 11, 210-
217.
WASDA (2007) Washington State Department of Agriculture, Seattle, WA, USA.
Woodroffe, R. (2000) Predators and People: Using Human Densities to Interpret Declines of
Large Carnivores Animal Conservation, 3, 165-173.
Woodroffe, R. & Frank, L. G. (2005) Lethal Control of African Lions (Panthera leo): Local and
Regional Population Impacts. Animal Conservation, 8, 91-98.