Báo cáo hóa học: "Research Article Enabling Seamless Access to Digital Graphical Contents for Visually Impaired Individuals via Semantic-Aware Processing" pdf
Bạn đang xem bản rút gọn của tài liệu. Xem và tải ngay bản đầy đủ của tài liệu tại đây (4.32 MB, 14 trang )
Hindawi Publishing Corporation
EURASIP Journal on Image and Video Processing
Volume 2007, Article ID 18019, 14 pages
doi:10.1155/2007/18019
Research Article
Enabling Seamless Access to Digital Graphical Contents for
Visually Impaired Individuals via Semantic-Aware Processing
Zheshen Wang, Xinyu Xu, and Baoxin Li
Department of Computer Science and Engineering, School of Computing and Informatics, Arizona State University,
Tempe, AZ 85287-8809, USA
Received 15 January 2007; Revised 2 May 2007; Accepted 20 August 2007
Recommended by Thierry Pun
Vision is one of the main sources through which people obtain information from the world, but unfortunately, visually impaired
people are partially or completely deprived of this type of information. With the help of computer technologies, people with visual
impairment can independently access digital textual information by using text-to-speech and text-to-Braille softwares. However,
in general, there still exists a major barrier for people who are blind to access the graphical information independently in real time
without the help of sighted people. In this paper, we propose a novel multilevel and multimodal approach aiming at addressing this
challenging and practical problem, with the key idea being semantic-aware visual-to-tactile conversion through semantic image
categorization and segmentation, and semantic-driven image simplification. An end-to-end prototype system was built based on
the approach. We present the details of the approach and the system, report sample experimental results with realistic data, and
compare our approach with current typical practice.
Copyright © 2007 Zheshen Wang et al. This is an open access article distributed under the Creative Commons Attribution License,
which permits unrestricted use, distribution, and reproduction in any medium, provided the original work is properly cited.
1. INTRODUCTION
Visual information in digital form has become widely avail-
able with the prevalence of computers and the Internet. A
significant part of the digital visual information is conveyed
in graphical form (e.g., digital images, maps, diagrams).
Sighted people can easily enjoy the added value that graph-
ical contents bring to a digital document. Nowadays, people
with visual impairment can independently access digital tex-
tual information with the help of text-to-speech and text-to-
Braille software (e.g., [1]). Unfortunately, in general, without
assistance from sighted people, computer users with visual
impairment are partially or completely deprived of the bene-
fit of graphical information which may be vital to understand
the underlying digital media. For example, there are still no
well-accepted systems/technologies that can readily convert
any online graphics into tactile forms that can be immedi-
ately consumed by a computer user who is blind. In other
words, despite the improved access to information enabled
by recent technology on computer system and software, there
still exists a major barrier for a computer user who is blind to
access the digital graphical information independently with-
out the help of sighted people. Our work aims at addressing
this challenging problem.
Conventional procedures for producing tactile graphics
by sighted tactile graphic specialist (TGS) are in general time-
consuming and labor-intensive. Therefore, it is impractical
to expect a computer user who is blind to rely on such pro-
cedures for instant help. It is thus desirable to have a self-
sufficient method that may deliver a tactile printout on de-
mand whenever the user wants it, independent of the assis-
tance of a sighted professional. This ideal situation is termed
as seamless access to graphics by users with visual impair-
ment, since the user can enjoy continuous reading with in-
stant availability of tactile graphics.
Unlike most of the existing efforts (e.g., [2, 3]) that aim
at improving the efficiency of sighted specialists in producing
tactile graphics, we target at directly helping people with vi-
sual impairment to access the digital images independently.
In other words, the end user of our system is a computer
user who is visually impaired, instead of a TGS. Obviously,
in order to achieve this objective, one key task is to auto-
mate visual-to-tactile conversion. In this paper, we present
a multilevel (from high-semantic level to low semantic level)
and multimodal (visual-to-audio and visual-to-tactile) ap-
proach to this problem. Our key idea is to develop a visual-
to-tactile conversion technique that is semantic-aware. This
is motivated by the fact that human experts do the conversion
2 EURASIP Journal on Image and Video Processing
largely based on the categories and contents (i.e., semantics)
of the underlying graphics [4]. The key idea has been imple-
mented and tested in an end-to-end prototype system.
The paper is organized as follows. In Section 2,webriefly
review the prior art. We define our problem formally in
Section 3 and present both overview and detailed descrip-
tions of the proposed approach in Section 4. Experimental
results are reported in Section 5.WeconcludeinSection 6,
with a brief discussion on future work.
2. PRIOR ART
2.1. Current typical practice
A tactile graphic is a representation of pictorial information
in a relief form that is to be interpreted by touch [4]. Agen-
cies serving the blind population nowadays extensively create
and use tactile graphics for educational purpose. Typically, a
tactile translation session includes a few labor-intensive tasks
[3–9]. Based on our study, some key subtasks that a special-
ist may complete during a tactile translation session are de-
scribed briefly as follows.
(i) Designing. At the start of a translation task, specialists
usually spend time to determine the best method to
use based on the image’s characteristics (e.g., the type
of image or amount of text) and the characteristics of
the intended user’s (e.g., experience with tactile graph-
ics or preferences).
(ii) Image drawing. Some specialists choose to draw the
image from scratch. The objective is to produce an out-
line (e.g., major contours, edges) with the most infor-
mative and important elements.
(iii) Image tracing. Using a scanned image, printout, or dig-
ital file to create an outline of the graphic by drawing
on top of it (e.g., on a blank piece of paper or a separate
image layer within an image editing application).
(iv) Simple image generation using Braille tex t software.
Some simple graphics are generated by using Braille
text software like Braille 2000. This costs a lot of time
as specialists have to piece together appropriate Braille
text box to mirror the original layout of the graphics
(one example on this from AIRC-FBC will be shown
later).
(v) Image texturing. Adding texture to distinct areas like
water area, bars in a bar chart after the outline is com-
pleted. Depending on the complexity of the image this
cantakeconsiderabletime.
(vi) Braille text creation. Braille texts are created, serving as
the explanation in the legends.
(vii) Key creation. Specialists create keys to explain the sym-
bols, lines, textures, figures, and numbers that they
used as labels to simplify the image content.
(viii) Rendering. Using a variety of methods (like foil, cap-
sule paper, and computer embossed) and materials
(wood, cloth, sandpaper, metal, fur, plastics, fleece,
etc.), specialists used the image master to create a tac-
tile graphic.
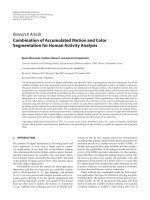
(a) (b)
(c) (d)
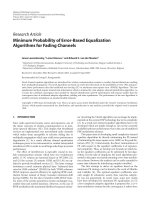
Figure 1: Converting graphics into tactile version for a math stu-
dent: a typical process.
(ix) Multiple-copy production. The master copy is copied
by a thermoform machine so that the Braille plus the
graphics can be produced many times. (Some newer
models can be “photocopied” directly from a line
drawing.)
Figure 1 illustrates an actual example from Arizona In-
structional Resource Center and the Foundation for Blind
Children (AIRC-FBC), where geometrical shapes from a
math book (in Figure 1(a))werereproducedmanually with
different materials (sand paper and cloth) (in Figure 1(b)).
The page in Figure 1(b) is considered as a master copy, and
the staff can give a student a take-home “photocopy” (in
Figure 1(c)) of the master copy by using a thermoform ma-
chine (in Figure 1(d)).
The observation on the current work practice provides
some insights into how to develop computer-based technolo-
gies to automate the tactile translation for our target applica-
tion. For example, the “image tracing” task can be done by
computer through first segmenting the images into distinct
regions, followed by contour extraction; the “image textur-
ing” task can also be automated by filling different areas using
different textures. Generally, there are two basic principles in
producing tactile graphics: portrait only the most important
element and keep the graphic simple. These are largely due to
the fact that the tactile sense has much lower resolution and
bandwidth compared with vision, and thus a tactile picture
with too many details may be very confusing [4].
2.2. Related work
Visual and tactile cognition have been very active research
fields, as evidenced by the number of technical articles pub-
Zheshen Wang et al. 3
lished in the past few decades [9–22]. One specific research
subject is how visual information can be presented to visu-
ally impaired individuals through alternative senses such as
the sense of touch. While processing and analysis of visual
data have been investigated by many researchers in computer
vision and other related fields, there are only a limited num-
ber of algorithms designed to convert visual data into hap-
tic data that can be presented through certain haptic user
interfaces. Some early attempts have been made to design
haptic-based assistive devices that convert visual data into
tactile data. In 1960s, Bliss developed the first converter sys-
tem [23], which mapped the luminance from a camera out-
put to a corresponding array of vibrating metal rods under
the user’s index finger, thus presenting a (non-Braille) tac-
tile version of the characters in text. The representative com-
mercial product “Optacon” was developed in 1980s using a
video camera and a matrix of vibrating pins [24]. In 1970s,
the tactile vision substitution system (TVSS) [25]attempted
to convert the image captured by a video camera into a tactile
image. In the standard version, the tactile image is produced
by a matrix of 20
×20 activators. The matrix is placed either
on the back, or on the chest, or on the brow. The improved
versions of this technology are still available under the label
VideoTact. In similar directions, there have been other exten-
sive research efforts on visual-to-tactile conversion systems.
There are also numerous relatively new products (e.g., the
Tiger embossers [26]).
Recent years, research efforts have also been devoted to
dealing with the conversion of more complex images into
the tactile form. For example, in [27, 28], natural images
(a portrait and an image of a building) were used to illus-
trate the conversion. In [29], complex graphical illustrations
were considered and processed. In these examples, a tactile
image is typically produced by an embosser. “Image simpli-
fication” is in general a key step in these technologies in or-
der to present the visual information on a tactile printout
of limited resolution. Other new technologies keep coming
up. For example, the SmartTouch project [30–32] introduces
a new type of tactile display to present realistic skin sensa-
tion for virtual reality. Similar electrotactile displays also in-
clude those that use the tongue as the receptor of the simu-
lation, that is, various tongue display units (TDUs) [33, 34].
In addition to visual-to-tactile conversion, there is also a lot
of research on conveying visual information via the auditory
channel, such as [21, 35, 36]. Another well-known example
is the optical character recognition- (OCR-) based text-to-
speech conversion devices (e.g., [37]), although they are not
applicable to general visual contents.
One unfortunate fact is that most of the prior sensory
substitution methods did not gain wide acceptance (not even
close to the level of the plain Braille), although their ini-
tial emergency would bring some enthusiasm. Aside from
the typical issues such as high cost, Lenay et al. also argued
[38, 39] that the methodology of simply transducing a sig-
nal from one modality to another is flawed. Nevertheless, for
people that have been deprived of certain sensory capabili-
ties, the missing information is bound to be consumed by an
alternative sense if the missing information is important at
all. Thus, the question is really “how to do this right.” Those
Audio device
Embosser
printer
Figure 2: A conceptual illustration of the application of the pro-
posed approach.
approaches that convey the visual stimulation via a small
tactual field of perception essentially require another cod-
ing/decoding process from the user, and thus a long learning
curve is required [38]. Compared to those approaches, a di-
rect way such as an embossered printout of the contour of an
object matches the direct experience of the user and thus is
easier to grasp without extensive learning.
Two recent projects are worth particular mentioning.
One is the Science Access Project (SAP) aiming at developing
methods for making science, math, and engineering infor-
mation more accessible to people with print disabilities [40].
The SAP project primarily focuses on improving the access to
mathematics and scientific notations in print. Another one is
the Tactile Graphics Project at University of Washington [2],
which developed methodologies and tools to support tran-
scribers in producing effective tactile graphics for people who
are blind.
3. PROBLEM STATEMENT
We aim at addressing the problem of enabling seamless ac-
cess graphical contents in digital documents by users with
visual impairment without depending on the help of sighted
professionals. The basic application scenario is illustrated in
Figure 2, where a user who is blind is reading a document
or browsing the Internet on a computer via a screen reader,
for example. Seamless access means that whenever the read-
ing encounters with graphics, the user will have the option to
immediately print out the graphics on a nearby tactile printer
and then read the printout by touch. She/he can then con-
tinue with the reading. The process of detecting the pres-
ence of graphics, converting them into tactile images, and
then printing them out is done without the intervention of a
sighted people. Such a system would greatly help people with
visual impairment in gaining independence in their com-
puter experience both at home and at work.
Adhering to the two basic principles, portraying the most
important elements, and keeping the pictures simple [4], we
propose a hierarchical approach for both internal representa-
tion/processing and the final outputs to the user. In order to
address the first principle, we use multiple-level multimodal
outputs (Section 4.1). The outputs at each level only present
the most necessary information. High-level semantic infor-
mation is not only used to guide the system to do further
lower-level processing, but also assists a user to mentally in-
tegrate and interpret the impressions from all levels of out-
puts to form a complete virtual picture of the inputs. The
4 EURASIP Journal on Image and Video Processing
hierarchy of the semantics of an image starts with its cate-
gory at the top, and goes down to regions of different con-
cepts, and then to the lowest level with the individual con-
tour lines. For example, an image may be categorized as a
“natural scene,” then regions of mountains and lakes may be
extracted, and then the contours of the mountains and lakes
may be depicted.
In the proposed system, the problem of too much infor-
mation in one picture is alleviated by breaking down the ren-
dering into multiple levels of outputs with different modal-
ities (audio, Braille text, and tactile images). Obviously, it
is difficult for a user to understand a graphic just through
simple tactile lines and limited textures. Our approach with
a multilevel and multimodal structure for both processing
and output is intended to alleviate the lack of resolution and
bandwidth in tactile sensing.
4. PROPOSED APPROACH
In this section, we describe the proposed approach and
its implementation in a prototype system. Digital graphi-
cal contents range from simple line drawings to complex
continuous-tone-scale images. By simple line drawings, we
refer to binary graphics that contain mostly line structures,
such as mathematical plots, diagrams, and illustrative figures
such as street maps, contour of an animal. Simple color-filled
shapes such as pie charts are also included in this category.
Continuous-tone-scale images refer to pictures acquired by a
camera or complex art work such as paintings. While there
are other graphics that may depict properties of both cate-
gories (such as pencil sketches with shading), for clarity of
presentation, we will consider only these two, and any picture
will be attributed to either a line drawing or a continuous-
tone-scale image.
It is relatively easy to convert a line drawing to tactile im-
age (e.g., by simply mapping the lines to tactile lines). This is
in fact what is done by professionals serving the blind pop-
ulation (e.g., Figure 1). It is more challenging to deal with a
continuous-tone-scale image. In a professional setting such
as in AIRC-FBC, an image would be first somehow simpli-
fied by a sighted person into simple line drawings and then
converted to a tactile image. This simplification process is in
many cases almost a recreation of the original image and thus
is not a trivial task that can be done by any transcriber for
any images. As a result, the continuous-tone-scale images are
often simply ignored by a transcriber since there is no stan-
dard and easy way of translating them. Unfortunately, this
situation is worsened in our application scenario, where the
user may encounter any type of graphics while there are no
sighted professionals to help at all. In this scenario, it is not
only an issue of converting a visual image to a tactile image,
it is also an issue of how to let the user know there are graphi-
cal contents in her/his current reading. Relying on the text to
give a hint, such as the reference to a figure in the text, should
be helpful but is not sufficient, given the fact that the graph-
ics may not be colocated with their reference point and that
there are situations where the graphics are simply presented
alongside with the text with little reference therein. Further,
without the help of a sighted person, how to present to the
user a tactile image is yet another issue. Based on these con-
siderations, in our study we define the following tasks.
(i) Build a software agent that actively monitors the com-
puter screen of the user who is blind so that it can detect the
presence of images/graphics. This software agent in a sense
plays the role of a sighted professional in locating the im-
ages/graphics in a document/book before doing tactile trans-
lation. The task involves multiple steps. First, since a user
may have multiple application windows running simultane-
ously on the computer, we need to decide which application
is being read by the user. Secondly, we need to determine
whether there are graphics present, and if yes, where they are
on the screen.
(ii) Develop algorithms that automatically convert any
detected images/graphics into their tactile counterparts so
that they can be printed or embossed immediately if the user
decides to read the image. (In some cases, the user may be
satisfied by the caption or other textual description of the
graphical content, or the high-level information provided by
an analysis module to be discussed later, and she/he may
not want to read the picture by touch.) This is the most
challenging task as there is no standard way of converting a
complex image, even for human transcribers. We propose a
novel approach—multimodal presentation and hierarchical
semantic-aware processing for visual-to-tactile conversion.
(iii) Integrate the components of the technologies into
an end-to-end system, completed with proper user inter-
face so that field tests can be performed. In our current
study, we choose to use a compact ViewPlus tactile printer
(ViewPlus Cub Jr. Embosser) as the output device for the
tactile image, which can sit conveniently next to the user’s
computer.
It is worth elaborating more on the second task due to its
importance in our system. Existing work on visual-to-tactile
conversion is mainly based on edge and contour extraction
(see, e.g., [27, 28]). Since edge and contour are low-level im-
age features that may or may not be directly linked to high-
level semantic meanings in an image, it is difficult to expect
that a given algorithm can process all types of images equally
well. For example, for an image with a lot of texture, edge de-
tection may result in a binary image of excessive small edge
segments, which may pose only as distraction if they are con-
verted directly to tactile lines. Motivated by this considera-
tion, our approach is to perform the conversion based on
a processing step (e.g., edge or contour extraction) that is
aware of the semantics of the images. In our proposed ap-
proach, the semantics of the images are captured by two lay-
ers of processing. At the higher level, we perform image cat-
egorization so that an input image will be classified into one
of the predefined categories. The hypothesis is that know-
ing the category of the image may direct us to choose differ-
ent simplification algorithm in the next step. For example, a
face image may be treated by a model-driven approach where
the face geometry is used as prior knowledge in detecting the
contours; on the other hand, a scenery image may rely mostly
on clustering, segmentation, and texture analysis for extract-
ing the high-level semantics. This semantic-aware process-
ing is carried over to a lower level where we label the regions
of an image into semantically meaningful concepts such as
Zheshen Wang et al. 5
face/skin and hair in a portrait. Again, the motivation is to
allow separate treatment of the regions of the images, rather
than leaving the simplification entirely at the mercy of a plain
edge detector, for example.
In the following, we first present an overview of our ap-
proach (Section 4.1), and then discuss in more detail the key
components of the proposed approach (Sections 4.2–4.5).
4.1. System overview
The overall design of the approach/system and the dataflow
are illustrated in Figure 3.Theoutputsgofromhighlevelto
low level (from top to bottom) with more and more details.
The key blocks in the processing flow are briefly described in
the following.
Active window capture and saving
Upon being invoked, the system starts a software agent that
monitors all user applications to determine which one is be-
ing used. (It is called “active window” in this paper.) We have
developed such an agent under the Windows environment.
This software agent further captures the content inside the
window and saves it as an image, which is the input to the
subsequent processing steps.
Graphic/image detection and graphic/image-text
segmentation
In this step, the system automatically detects the presence of
graphics in the captured image, and locates and segments the
graphics into separate images. We assume that the image is
either present entirely or absent entirely in a window. Partial
images are not considered, although in principle they can be
addressed through one more step of user interaction. Note
that, as discussed briefly previously, we are treating the con-
tent captured from the active window as a “whole” image and
then process that image to detect and extract images/graphics
if any, including performing the separation of text and im-
ages/graphics. While it is possible to directly tap into the un-
derlying application (e.g., an Internet browser) to perform
text analysis in order to detect the presence of graphics, this
approach would require that the system understands the pro-
tocols of any possible application software a user may have
on the computer, which is impractical. Thus, we believe that
our approach of treating the active window content simply
as an image and using image processing techniques to solve
the detection and localization problems is more practical and
general.
Text translation and background information extraction
After graphic/image-text segmentation, the text parts may
be processed by the OCR engine, yielding actual ASCII
text which then can be translated into Braille using existing
Braille software. Then, the system can extract the keywords
from the caption, legend, or context as the highest level of
semantic information. In the case that there are texts embed-
ded in the detected picture (such as annotations inside a sci-
entific illustration), it is also desirable to detect text in the
picture and then convert them into Braille to be overlaid on
the final tactile image. At least one piece of the existing work
[2, 3] has addressed similar tasks to certain degree, and thus
our current effort is focused on processing only the graphics.
Semantic graphic/image categorization
This step labels the image with one of the predefined cate-
gories. The images with semantic labels will help us in further
image segmentation and simplification. In our current study,
we define five semantic concepts for continuous-tone-scale
image and employ multiple-class multiple-instance learning
[41] approach to achieve categorization. This is explained in
more detail in Section 4.3.
Semantic concept-based region labeling
In this step, we further define some more specific semantic
concepts for each category from the previous step. Essen-
tially, we segment an image into regions of different semantic
meanings.
Semantics aware graphic/image simplification for
visual-to-tactile conversion
The purpose of both semantic categorization and region la-
beling is to provide guidance to further process the image so
that the unavoidable simplification of the input can be done
in a way that keeps the most important semantic meanings
of the original image. For example, knowing that the im-
age is a portrait may ensure the simplification stage to keep
some human-specific visual features such as face contour,
eyes, mouth. Also, knowing a region is sky or grass, we may
preserve more texture information for the plant region than
for the sky. Image simplification is in a sense the most dif-
ficult part of visual-tactile translation, which is a challenge
even for sighted professionals serving the blind population.
Our key idea is to use the semantic labels for both the entire
image and regions of the image to guide the simplification.
For example, edge detection algorithm may be used to de-
tect edges with different thresholds for different semantic re-
gions. This novel perspective of introducing semantic-aware
approaches to build automated algorithms is motivated by
the typical process of human tactile translation, as we have
learned from our collaborators in AIRC-FBC and from the
literature (see, e.g., [4]).
Subsequent subsections elaborate the key components of
the proposed approach.
4.2. Graphic/image detection and graphic/image-text
segmentation
This step detects whether there are graphics present in the ac-
tive window, and simultaneously, locates those graphical re-
gions, if any, so that they can be cropped out for further pro-
cessing. Related work on document analysis has addressed
similar tasks to a large degree. In our system, a primary re-
quirement on the algorithm is its good speed performance
6 EURASIP Journal on Image and Video Processing
Data flow Processing flow Input/output
Window image
Graphic/image
text regions
Background
information
Category
information
Graphics/images
with labeled regions
Simplified
graphics/images
Graphic/image
segmentation and
labeling
Ta ct i le im ag e w i th
labeled regions
Semantic
levels
High
Low
1
2
3
4
Active window
capture and saving
Graphic/image
detection &
segmentation
Background
info. extraction
Graphic/image
categorization
Graphic/image
simplification
Input from
keyboard
Press a key to
start
“This image
isabout ”
“This image
belongsto ”
Simplified
tactile image
Audio
Audio
Embosser
Embosser
1
2
3
4
Audio
Inputfromkeyboard
Inputfromkeyboard
NoYe s
Exit
Continue?
Figure 3: Overall design and dataflow of the system.
even on a regular desktop PC, since this module needs to
be active all the time (in practice, the detection can be
done just periodically, e.g., once in few seconds). Accord-
ingly, we use a simple strategy. We first compute horizon-
tal projection of each line to get the histogram of numbers
of nonwhite pixels in each line. Then, we use the distribu-
tion of the “valleys” in the projection to label the strips (in
a certain height) as “text strip” and “graphic/image strip”.
(Strips labeled as “graphic/image” mean that there is one or
more graphic/image regions included in this strip.) Further,
we divide strips into blocks and label each block as “non-
graphic/image block” or “graphic/image block” based on the
number of colors in the region. The distribution of the tex-
ture is further used to separate text and simple line drawing
(assuming that the former will have more evenly distributed
and denser texture than the latter). This simple method was
found to be very computationally inexpensive and effective
in our experiments, although there is much room for fur-
ther improvement to handle difficult cases such as a web page
with images or textured patterns as the background. Some
results are given in Section 5.1.
4.3. Extracting high-level semantics based on
image categorization
Semantic image categorization plays an important role in the
proposed system. This step not only provides some high-
level coarse semantics regarding the captured graphics that
can be conveyed to a user, it also facilitates the idea of
semantic-aware image processing for visual-to-tactile con-
version. Based on consultation with graphics transcribers at
AIRC-FBC and the prior experiences reported in the litera-
ture (see, e.g., [4]), the initial design in our approach catego-
rizes the extracted graphics/image into two large categories:
simple line drawings and continuous-tone-scale images. As
discussed earlier, simple line drawing may be relatively eas-
ily processed even if the tactile translation is to be done au-
tomatically. However, the continuous-tone-scale image case
has not been fully addressed. Thus, our study is directed
mostly to handle the latter case. It is relative easy to classify
an image into either a simple line drawing or a continuous-
tone-scale image. In the current work, we define the follow-
ing five semantic categories, which in a sense are a critical
subset of the examples defined in [4]:
(i) object: close-range shots of man-made objects, typi-
cally on a clean background.
(ii) people: images with human figure(s), typically from a
long-range shot.
(iii) portrait: images of a human subject in a close-range
shot, typically on a clean background.
(iv) scene: images of natural scenery.
(v)structure:imagesofscenesofman-madestructures
(buildings, city scenes, etc.).
The category of an image is deemed as important for our
application for at least two reasons: it should be able to tell
the user some topical information hence helping her/him
in better understanding the document and in determining
whether to further explore the image by touch. Note that
Zheshen Wang et al. 7
although in many cases the textual context would contain
some information about the embedded graphics, it is not
always the case since the reading may include any material
such as Internet browsing. The graphics may also appear in
different places in a document than the referring text. It is
always more desirable and reliable to obtain the topical in-
formation directly from the image (or from a caption of the
image whenever possible). Unfortunately, there is no simple
method for systematically categorizing images and this is still
an active research topic. Among others, machine-learning
approaches have shown to be very promising for this prob-
lem [19, 42, 43]. In this paper, we adopt a novel multiple-
class multiple-instance learning (MIL) approach [41]which
extends the binary MIL approaches to image categoriza-
tion. Our approach has the potential advantage of avoiding
the asymmetry among multiple binary classifies (which are
used in typical MIL-based classification algorithms such as
[44–48]) since our method allows direct computation of a
multiclass classifier by first projecting each training image
into multiclass feature space based on the instance proto-
types learned by MIL, and then simultaneously minimizing
the multiclass support vector machine (SVM) [38]objective
function. We will present some results of using this approach
for our proposed application in Section 5.
4.4. Extracting low-level semantics based on
region labeling
The high-level semantics extracted in the previous step can
supply the user with some topical information like “the im-
age is one of human portrait”. In this step, we further seg-
ment images into regions with semantic labels according to
a set of predefined concepts, for each of the predefined im-
age categories separately, for example, “sky,” “water,” “plant,”
“sand,” and “mountain” for the “natural scene image” cate-
gory. In the case of simple line drawings, we have considered
bar charts, pie charts, functional curve plots, and block dia-
grams. To this end, a simple strategy is to prepare a number
of training images for each concept. In current study, for both
training and test images, we divide them into small blocks
and then extract visual features from each block. Further, we
use SVM to do training and labeling on the block level, from
which we assign concept labels to each block of the test im-
ages. Since this labeling process is done at the block level,
to consider correlation among adjacent blocks, a smooth-
ing step is used to generate more continuous labels. These
steps are detailed in the below, with some sample results to
be given in Section 5.
Feature extraction
In our study, we use a simple six-dimensional feature vector.
Three of them are the average color components in a block in
the HSV color space. The other three represent square root of
energy in the high-frequency bands of the wavelet transforms
[19, 41], the square root of the second-order moment of
wavelet coefficients in high-frequency bands. To obtain these
moments, Daubechies-4 wavelet transform is applied to the
blocks of the image. After a one-level wavelet transform, a
block (e.g., 4
×4) is decomposed into four frequency bands:
the LL, LH, HL, and HH bands. Each band contains 2
×2co-
efficients. Without loss of generality, we may suppose that the
coefficients in the HL band are
{C
k,l
, C
k,l+1
, C
k+1,l
, C
k+1,l+1
}.
One feature is
f
=
1
4
1
i=0
1
j=1
c
2
k+i,l+j
1/2
. (1)
The other two features are computed similarly in the LH and
HH bands. This choice of features is inspired by prior works
such as [38] that shows that moments of wavelet coefficients
in various frequency bands are effective for representing tex-
ture.
Labeling of the blocks
With the features detected for the blocks, we use SVM to
classify the blocks. Our current study uses LibSVM [49]for
both samples training and multiclass classification. Several
parameters need to be specified for LibSVM. The most signif-
icant ones are γ (used in the RBF kernel function) and C, the
constant controlling the trade-off between training error and
regularization. The following three steps are run to identify
the best parameters: (1) apply a ‘coarse grid search’ on pairs
of (C, γ) using two-fold cross-validation, with C
= 2
−10
,2
−8
,
,2
15
,andγ = 2
−15
,2
−13
, ,2
10
. (2) After a better (C,
γ) region with high-cross-validation accuracy is identified,
apply a finer grid search on that region. (3) The pair that
gives the maximum two-fold cross-validation accuracy is se-
lected to be the “optimal” parameters and is used in the ex-
periments.
Smoothing
A simple strategy is used to smooth the labels based on those
of the neighboring blocks: if more than half of the 8 neigh-
bors of one block have the same label that is different from
that of the centric block, the centric block is relabeled to the
majority label of its neighbors. This simple scheme may not
be able to maintain fine details of the regions and thus a re-
fined filter may be needed. Nevertheless, in most examples
we encounter, coarse contours of the regions are sufficient
for our purpose.
4.5. Semantic-aware graphic/image simplification for
visual-to-tactile conversion
The common way for simplification in tactile graphic/image
translation is edge/contour detection since the extracted edge
features match the essentially binary nature of most tactile
graphics (i.e., presence or absence of tactile lines or dots).
Depending on the specific algorithm and the algorithmic pa-
rameters, edge/contour detector can in general extract edge
or contour segments at different “scales,” with a larger scale
corresponding to a “big picture” view and a smaller scale cor-
responding to fine details. However, in general it is difficult
to decide to what extent the details should be preserved for
a given input image. Too many lines in a tactile image may
8 EURASIP Journal on Image and Video Processing
∗ Text extraction, recognition,
and understanding
∗ Categorization
∗ Segmentation and labeling
Text info., category label
Semantic region labels
Semantic component/
structure info.
∗ Component/structure
detection and analysis
∗ Color extraction
∗ Edge/contour detection
∗ Texture extraction
High level
Low level
Low-level info.
Semantic info.
Color, texture,
edge/contour
Synthesis
Semantic-aware
simplification
Output info.
Multiscale
audio output + tactile printout
Figure 4: Diagram of semantic-aware graphic/image simplifica-
tion.
cause confusion [4], but over simplified displays are also dif-
ficult to understand for the user. We have to strike a balance
between them so that a desired level of details for different re-
gions of different semantic meanings may be preserved. For
example, in “scene” images, we may keep more texture in-
formation (more details) in the “plant” regions than in the
“sky” regions.
Our basic strategy in this paper is to use the semantics
extracted in the previous steps to guide the proper choice of
scales for each semantic region. Furthermore, a na
¨
ıve edge
detector may produce broken and/or scatter short edge seg-
ments that may serve only to confuse a user who is blind if
they are directly converted to tactile lines. But any attempt to
clean up the edges, such as by linking short ones to form a
long contour, may do harm as well if those processing steps
are purely driven by the low-level edges. With the two levels
of semantics extracted in the previous steps of our approach
(semantic category information for each image and seman-
tic labels for regions within an image), we employ different
strategies for simplification for different semantic regions of
images from different categories, so as to obtain the optimal
results.
Figure 4 illustrates the simplification process based on
this idea. A specific example is given in Figure 5,wherewe
first know it is a “portrait” image from categorization, then
corresponding segmentation and labeling are carried out (b).
Since it is a “portrait” image, face detection is implemented
and face region can be extracted (c). Then we combine the
high-level semantic information (b and c) and low-level in-
formation (d) into (e), based on which we may have several
outputs in different “scales” as shown in (f), (g), and (h).
In our current study, the semantic-aware simplification
is achieved largely based on incorporating the automati-
cally extracted semantics into an edge detector, with different
strategies for each category, as described below.
(i) Object. We keep the longest continuing line and remove
all other small line segments in order to keep the outer
contour of the object. (We assume that the image has a
uniform background and the longest edge is the outer
contour of the object.) An example is shown in Figures
11(a), 11(b),and11(c).
(ii) Portrait. We first carry out face detection over the image.
According to [4], it is more preferable to represent fa-
cial organs with simple lines than with complex details.
In order to retain some characteristics from the origi-
nal image rather than presenting all face images as the
same template, we propose to use face-model-driven
simplification processing in cleaning up the edge map
extracted from the original image. A simple face model
in Figure 6 is used. The edge map of a face image
is fitted into this model so that we keep only those
edge segments corresponding to the major facial fea-
tures (and also link some fragmented edge segments if
needed). An example is shown in Figures 11(g), 11(h),
and 11(i).
(iii) Scene. We keep the boundary of different semantic re-
gions and preserve or fill in with predefined texture
patterns.
(iv) Structure. In edge detection, we choose the scale which
is able to preserve the longest lines (assumed to be the
contour of the man-made structures) with least tiny
line segments. Alternatively, we carry out building de-
tection [50] first and maintain the main lines in build-
ing areas but remove all other information. An exam-
ple is shown in Figures 11(d), 11(e),and11(f).
(v) People. We perform human detection [51]andextract
the outer contour of the human figure. We give the
bounding boxes of the “human” regions, label them,
and print the figures by removing all the details out-
side the outer contour separately with annotations. An
exampleisgiveninFigures11(j), 11(k),and11(l).
While our current study uses only the above simple
semantic-aware techniques in simplification, which are not
adequate for complex situations (e.g., an image with many
people and various structures), the experimental results al-
ready show that the idea of semantics driven simplification is
very promising. Further development along the same direc-
tion should improve the current system for handling more
complex cases.
5. EXPERIMENTAL RESULTS
In this section, we present sample results from our exper-
iments in testing the various components of the proposed
approach. The experiments are based on an actual setup as
in Figure 2. Unless noted otherwise, the tactile graphics pre-
sented in this paper were produced by our current system
using a ViewPlus Cub Jr. Embosser. Note that, as illustrated
in Figure 3, in actual testing, the system is able to utilize the
audio device to output information such as the categories
of the images. It is also able to generate multiple printouts
Zheshen Wang et al. 9
High
level
Low
level
Multiscale
outputs
a
b
c
d
e
f
g
h
Figure 5: An example of combining region and edge: (a) original image; (b) result of semantic concept-based segmentation and labeling
(black hair; yellow Skin; red clothes); (c) result of face detection; (d) result of na
¨
ıve edge detection; (e) combined image; (f) simplified
and simplified-level-1 regions with labels; (g) simplified and simplified-level-2 contour; (h) simplified and simplified-level-3 contour with
texture.
Figure 6: A simple face model.
(a) (b) (c)
Figure 7: A simple example of graphic/image detection and
graphic/image-text segmentation. Left. The desktop of the user’s
computer screen. The user has two applications running with the
frontal being the active window (which the user is currently read-
ing). Center. The cropped image from the active window. Right. Ex-
tracted images from the active window.
on demand, corresponding to different layers of details. For
simplicity of presentation, in this section, we focus on only
the lowest layer of output (the default layer of the system),
which always produces one tactile printout for any detected
image.
5.1. Results of graphic/image detection and
graphic/image-text segmentation
A software agent for detecting the current active window, de-
termining the presence/absence of graphics in the active win-
dow, and locating the graphics and cropping them into im-
ages, has been built. With this software agent, we are able
to obtain very good results in most experiments. Further
study will be focused on addressing challenging cases such as
web pages that have a grayed-out image as the background.
Figure 7 illustrates some sample results.
5.2. Results of semantic-image categorization
Our target application attempts to consider graphics from
various electronic sources including the Internet. We have
thus built a small database based on the SIMPLIcity database
[42, 43] to test the feasibility of our method for semantic-
image categorization. The images in the database fall into
the following five categories as defined earlier: object, peo-
ple, portrait, scene, and structure. Each category has 100 im-
ages (shown in Figure 8 are some samples of each category).
While being small, this database is in fact a very challenging
one since (1) many images present several semantic concepts
rather than one single concept (e.g., in the category ‘scene’,
an image may simultaneously contain water, mountain, and
plant); (2) the images are very diverse in the sense that they
have various kinds of background, colors, and combinations
of semantic concepts. Despite the challenges, the proposed
multiclass multiple-instance learning approach has achieved
reasonably good results on this dataset, demonstrating that
this is indeed a promising approach which is worth pursuing
10 EURASIP Journal on Image and Video Processing
(a) (b)
Figure 8: Two sample images for each of the five categories, respectively; object, portrait, structure, people, and scene. The samples illus-
trate the diversity and complexity of the categories, which renders it difficult to use, for example, a rule-based reasoning approach for the
categorization.
(a) (b)
Figure 9: (a) Two examples for “scene” images (blue sky, white water, green plant, yellow sand, brown mountain). (b) Two examples for
“portrait” images (blue eyes, yellow skin, black hair, white background, red clothes).
Table 1: Confusion matrix on the SIMPLIcity dataset over one ran-
dom test set.
Object People Portrait Structure Scene
Object 72% 14% 6% 2% 6%
People 6% 78% 0.0% 10% 6%
Portrait 8% 10% 74% 4% 4%
Structure 6% 12% 2% 70% 10%
Scene 0.0% 14% 2% 10% 74%
further in the proposed project. For this dataset, images
within each category are randomly divided into a training set
and a test set, each with 50 images. Ta bl e 1 reports the typi-
cal results from one split of the training and testing sets (the
confusion matrix from the testing stage). In [41], the per-
formance is compared with those from other state-of-the-art
approaches, showing our approach is advantageous.
5.3. Results of semantic concept-based region labeling
We present in this subsection some examples for semantic
labeling of the “scene” and the “portrait” images. For the
“scene” images, we used five concepts in the labeling: sky,
water, plant, sand, and mountain. For the “portrait” im-
ages, we assume that the background is uniform and we use
the following five concepts: skin, clothes, hair, background,
and eyes. It turned out that the simple features defined in
Section 4.4 work reasonably well for skin and hair detection
but poorly for eye detection. This is not totally bad news since
we have realized the potential limitation of the simple label-
ing strategy based on the simplistic feature vector; and we
expect to follow up with further development that explic-
itly imposes models in handling concepts with strong geom-
etry such as eyes. This is also true for concepts in the “ob-
ject” and “structure” categories. A few examples are shown in
Figure 9.
5.4. Results from semantics-aware image
simplification for tactile translation
The basic ideas of Section 4.5 are tested and illustrated with
the following experiments: we used a Canny edge detector as
the primary step for all categories and then carry out corre-
sponding simplification methods for different categories or
regions according to their respective semantic meanings.
Figure 10 shows the results of Canny’s edge detector with
default scales of extracted “object,” “portrait,” “people,” and
“structure” images (shown in Figure 11,leftcolumn),which
generates too many details that are deemed as confusing by
our testers who are blind if they are printed out through the
embosser printer directly.
Figure 11 shows the original extracted edges from the ex-
tracted images, the respective results from the specific pro-
cessing steps for different semantic categories or regions, and
the actual printout. For “object” (a), based on the edge map
from the Canny’s algorithm, the longest line, which is the
outer contour of the object, is detected and preserved; all
other inside or outside details are removed. For “portrait”
(b), a bounding box of face region is given with a Braille la-
bel “face” (“face” in font of Braille US computer). In the face
region, lines and dots are fitted with a face model (Figure 6),
dots which fit the model are preserved; broken lines are also
repaired according to the model. For “structure”(b), a scale
of 0.3 which is able to maintain the longest and cleanest con-
tour lines is chosen. Compared to Figure 10(b), Figure 11(e)
is deemed by our evaluators who are blind as more intu-
itive and acceptable. For “people” (Figures 11(j), 11(k),and
11(l)), bounding boxes of human figures are presented with
labels “People1”and “People2” (“People1” and “People2” in
font of Braille US computer). Here, we present the content
Zheshen Wang et al. 11
(a) (b) (c) (d)
Figure 10: “Canny” edge detection results of images in Figure 11 (left column), using a default scale.
(a) (b) (c)
(d) (e) (f)
(g) (h) (i)
(j) (k) (l)
Figure 11: Examples of “object,” “structure,” “portrait,” and “people” from extracted images to tactile graphics: sample outputs from the
system. Original extracted images, semantic-aware simplified results, and the actual tactile printouts, respectively.
of human figure separately in order to make the final output
much easier to understand for the blind people [4].
5.5. Comparisons with current practice
Finally, we provide three examples to compare the out-
put from our system with that from current practice. In
Figure 12, images in the first row were translated into tactile
pictures (the second row) with Braille 2000 in AIRC-FBC by
a tactile transcriber, with the third row being the results from
our system using scanned images in the first row as input.
For better visualization, we use printed copies of the Brail
version in the second row and swell papers in the third row.
The comparison of these results was performed with three
disability specialists, one being blind herself.
These specific case studies exemplify some advantages
of the proposed system. Firstly, it has been reported by the
AIRC-FBC staff that using Braille boxes for creating the tac-
tile graphics (the second row of Figure 12) was very tedious
even for the simple figures in the first row of Figure 12.She
also mentioned that, with another software, TGD Pro, she
would be able to draw basic shapes without having to care-
fully pick Braille boxes as with Braille 2000; however she
pointed out that that would require recreation of the figure,
12 EURASIP Journal on Image and Video Processing
Antennae
Head
Eye
Legs
Body
Wing covers
Spot
Transparent
wings
(a)
Plant tip
Sun
= light
Darwin’s experiment
(b) (c)
(d) (e) (f)
(g) (h) (i)
Figure 12: Comparing the proposed system with current practice of professionals serving the blind population.
which again is not easy. With our approach, as long as the
digital version is available (e.g., through scanning), the con-
version can be done automatically. Assuming that the images
in the first row of Figure 12 are encountered during reading
an electronic book, then a user who is blind will be able to get
the tactile image of the third row with the proposed system,
and thus all the troubles in getting the second row will not
exist at all to the user, hence achieving seamless access to the
first row. We could also supply the automatically generated
tactile picture for a transcriber to edit for further improve-
ment. This underscores one earlier point that our system,
while targeted at users who are blind, may also be helpful
for sighted professionals.
In this comparative study, one specialist pointed out that
although one’s tactile sense can not discern the same level of
detail that one’s visual sense can, that does not preclude a tac-
tile graphic from having more variations to delineate differ-
ences between various characteristics in a graphic, which are
unfortunately missing in the results from the current prac-
tice. For example, in Figure 12(b),thesunwithraysisrepre-
sented as a simple circle in Figure 12(e) which loses the intu-
itive feature of the original shape. In contrast, in our output
(Figure 12(h)), the zigzag contour is well kept which is con-
sidered as a better tactile representation of the visual graphics
according to the specialists in this experiment. Similarly, in
the third example, only the skeletons are reserved in the man-
ual result (Figure 12(f)) while in our version (Figure 12(i)),
whole shapes (e.g., the outer contour of the feathers) and
more details (e.g., the paw with nails) are described and
truthfully maintained.
Moreover, one of the specialists also mentioned that if the
manual conversion is done by volunteer Braillist and vision
resource teachers, as in many practical cases, results would
be worse. Many of them do not have a high level of techni-
cal knowledge to use the more sophisticated software to pro-
duce tactile diagrams, which typically have a steep learning
curve. And these individuals are often not professionals in
the related field, so they may not know or understand what
concepts the particular graphic intends to convey. Thus, they
cannot know what characteristics or elements are essential
and should be emphasized and which ones are not as im-
portant. In those situations, basing the conversion largely on
the original visual image is a better choice, which is naturally
achieved with our approach.
5.6. Summary of evaluation of the system
The current system runs on a desktop PC with a 1.86 GHz
CPU and 1.0 GB RAM. The time needed to complete all pro-
cessing steps is between 20–30 seconds, depending on the
contents of the current window. (It varies due to different
numbers of graphics within the active window.)
Our evaluation of the current system is mainly on the us-
ability of the prototype system. That is, the evaluation aims
at answering the following question: whether methodology
and system design indeed achieve the claimed objective, that
is, enabling seamless access for a computer user who is blind.
To this end, our evaluation was done primarily through the
following channels: (1) collect feedbacks on the system from
professionals who work for the blind population (e.g., our
collaborators in AIRC-FBC); (2) test-run the system with in-
house researchers and student participants who are blind;
(3) test-run the system with general blind population on
disabilities conferences (e.g., the CSUN 2007 conference);
Zheshen Wang et al. 13
(4) collect feedbacks from system vendors who make assis-
tive devices. The feedbacks collected thus far have been affir-
mative. Our future plan on evaluation includes quantitative
testing and comparison of the individual components.
6. CONCLUSION AND FUTURE WORK
In this paper, a novel approach/system based on semantic-
aware processing is proposed aiming at enabling seamless ac-
cess to digital graphical contents for visually impaired indi-
viduals. As shown in Figure 3, the system first detects and
extracts images/graphics from current active window; then
context information is extracted and those images/graphics
are categorized into several predefined semantic categories.
Further, for each category, images/graphics are segmented
into regions according to corresponding predefined semantic
concepts. Simplification steps are then executed and the re-
sults are finally printed out from an embosser printer. Com-
pared with existing work, this appears to be among the first
to serve the end-user directly. The novel hierarchical multi-
modal structure is not only used to guide the system to do
further lower-level processing, but also to facilitate a user’s
consumption of the underlying information. Algorithms and
specific strategies for each component of the approach are
presented. Experimental results have shown that the pro-
posed approach is a desirable and promising solution to the
challenging problem of enabling independent access to digi-
tal graphic contents by users with visual impairment.
While the first prototype has shown its potential, all the
components of the system are subject to further improve-
ment. In particular, we are extending the number of image
categories to include more types of images. Also, an impor-
tant future step is to refine the semantic-aware simplification
techniques for each of the categories so as to provide more
versatile outputs that can suit to different needs of the user
(in addition to be based on the automatically extracted se-
mantics).
1
ACKNOWLEDGMENTS
The authors would like to thank Arizona Instructional Re-
source Center, Foundation for Blind Children (AIRC-FBC),
Phoenix for providing inputs and feedback to our approach,
and for supporting the research by allowing the authors’ fre-
quent access to their facilities. Some of the sample data were
kindly supplied by AIRC-FBC. In particular, Ms. Inge Durre
from AIRC-FBC has been involved in fruitful discussion that
helped to shape some of the key ideas of the paper.
1
It is worth pointing out that if in the future low-cost and high-resolution
refreshable tactile displays become a reality (e.g., through the work de-
scribed in [52]), they can be readily used as the output device of the pro-
posed system in this paper. In that case, the hierarchical nature of our ap-
proach will readily support an interactive exploration of the tactile display,
supporting functionalities such as zooming into a region of the image for
exploring more details.
REFERENCES
[1] JAWS: edomscientific.com/fs products/JAWS
HQ.asp.
[2] Tactile Graphics Project at University of Washington: http://
tactilegraphics.cs.washington.edu.
[3] R. E. Ladner, M. Y. Ivory, R. Rao, et al., “Automating tactile
graphics translation,” in Proceedings of the 7th International
ACM SIGACCESS Conference on Computers and Accessibility
(ASSETS ’05), pp. 150–157, Baltimore, Md, USA, October
2005.
[4] P. K. Edman, Tactile Graphics, AFB Press, Sewickley, Pa, USA,
1992.
[5] R. S. Wall and A. L. Corn, “Production of textbooks and in-
structional materials in the United States,” Journal of Visual
Impairment & Blindness, vol. 96, no. 4, pp. 212–222, 2002.
[6] D. Burger, “Improved access to computers for the visually
handicapped: new prospects and principles,” IEEE Transac-
tions on Rehabilitation Engineering, vol. 2, no. 3, pp. 111–118,
1994.
[7] A. L. Corn and R. S. Wall, “Training and availability of Braille
transcribers in the United States,” Journal of Visual Impairment
& Blindness, vol. 96, no. 4, pp. 223–232, 2002.
[8] American Foundation for the Blind, “Survey on the produc-
tion of textbooks and instructional materials,” 2000.
[9] R. Hinton, “First introduction to tactiles,” British Journal of
Visual Impairment, vol. 9, no. 3, pp. 79–82, 1991.
[10] M. Akamatsu, I. S. MacKenzie, and T. Hasbroucq, “A com-
parison of tactile, auditory, and visual feedback in a pointing
task using a mouse-type device,” Ergonomics,vol.38,no.4,pp.
816–827, 1995.
[11] P. Cavanagh, J. M. Kennedy, D. G. Pelli, and M. Palomares,
“Close encounters: details veto depth from shadows,” Science,
vol. 287, p. 2421, 2000.
[12] A. D’Angiulli and J. M. Kennedy, “Children’s tactual explo-
ration and copying without vision,” International Journal of
Rehabilitation Research, vol. 24, no. 3, pp. 233–234, 2001.
[13] Y. Hatwell and F. Marinez-Sarrochi, “The tactile reading of
maps and drawings, and the access of blind people to works
of art,” in Touching for Knowing,Y.Hatwell,A.Streri,andE.
Gentaz, Eds., pp. 255–273, John Benjamings, Amsterdam, The
Netherlands, 2003.
[14] M. A. Heller and J. M. Kennedy, “Perspective taking, pictures,
and the blind,” Perception & Psychophysics,vol.48,no.5,pp.
459–466, 1990.
[15] J. M. Kennedy and I. Juricevic, “Haptics and projection: draw-
ings by Tracy, a blind adult,” Perception, vol. 32, no. 9, pp.
1059–1071, 2003.
[16] J. M. Kennedy and J. Bai, “Haptic pictures: fit judgments pre-
dict identification, recognition memory, and confidence,” Per-
ception, vol. 31, no. 8, pp. 1013–1026, 2002.
[17] J. M. Kennedy and C. Merkas, “Depictions of motion devised
by a blind person,” Psychonomic Bulletin & Review, vol. 7,
no. 4, pp. 700–706, 2000.
[18] J. M. Kennedy, “Drawings by the blind: sighted children and
adults judge their sequence of development,” Visual A rts Re-
search, vol. 10, pp. 1–6, 1984.
[19] K. J. Kokjer, “Information capacity of the human fingertip,”
IEEE Transactions on Syste ms, Man and Cybernetics, vol. 17,
no. 1, pp. 100–102, 1987.
[20] L. E. Magee and J. M. Kennedy, “Exploring pictures tactually,”
Nature, vol. 283, pp. 287–288, 1980.
[21] L. Merabet, J. Rizzo, A. Amedi, D. C. Somers, and A. Pascual-
Leone, “Opinion: what blindness can tell us about seeing
14 EURASIP Journal on Image and Video Processing
again: merging neuroplasticity and neuroprostheses,” Nature
Revie ws Neuroscience, vol. 6, no. 1, pp. 71–77, 2005.
[22] K. Pathak and L. Pring, “Tactual picture recognition in con-
genitally blind and sighted children,” Applied Cognitive Psy-
chology, vol. 3, pp. 337–350, 1989.
[23] J. Bliss, M. Katcher, C. Rogers, and R. Shepard, “Optical-to-
tactile image conversion for the blind,” IEEE Transactions on
Man Machine Systems, vol. 11, no. 1, pp. 58–65, 1970.
[24] D. Stein, “The Optacon: Past, Present, and Future,” National
Federation of the Blind (NFB): />nfb/Publications/bm/bm98/bm980506.htm.
[25] C. C. Collins and P. Bach-y-Rita, “Transmission of pictorial in-
formation through the skin,” Advances in Biological and Medi-
cal Physics, vol. 14, pp. 285–315, 1973.
[26] Tiger Embosser: .
[27] T. Way and K. Barner, “Automatic visual to tactile
translation—part I: human factors, access methods, and
image manipulation,” IEEE Transactions on Rehabilitation
Engineering, vol. 5, no. 1, pp. 81–94, 1997.
[28] T. Way and K. Barner, “Automatic visual to tactile
translation—part II: evaluation of the TACTile image creation
system,” IEEE Transactions on Rehabilitation Engineering,
vol. 5, no. 1, pp. 95–105, 1997.
[29] M. Y. Ivory, A. P. Martin, R. Megraw, and B. Slabosky, “Aug-
mented cognition: an approach to increasing universal benefit
from information technology,” in Proceedings of the 1st Inter-
national Conference on Augmented Cognition,LasVegas,Nev,
USA, July 2005.
[30] H. Ando, T. Miki, M. Inami, and T. Maeda, “The nail-mounted
tactile display for the behavior modeling,” in Proceedings of
ACM SIGGRAPH Conference Abstracts and Applications,p.
264, San Antonio, Tex, USA, July 2002.
[31] T. Nojima, D. Sekiguchi, M. Inami, and S. Tachi, “The Smart-
Tool: a system for augmented reality of haptics,” in Proceed-
ings of IEEE Virtual Reality Conference (VR ’02), pp. 67–72,
Orlando, Fla, USA, March 2002.
[32] SmartTouch: />touch.
[33] />[34] />releases/2004-06/uom-
aeo060204.php.
[35] A. D. Heyes, “Human navigation by sound,” Physics in Tech-
nology, vol. 14, no. 2, pp. 68–75, 1983.
[36] P. B. L. Meijer, “An experimental system for auditory image
representations,” IEEE Transactions on Biomedical Engineering,
vol. 39, no. 2, pp. 112–121, 1992.
[37] iCARE Haptics: />[38] C. Lenay, S. Canu, and P. Villon, “Technology and perception:
the contribution of sensory substitution systems,” in Proceed-
ings of the 2nd International Conference on Cognitive Technol-
ogy, pp. 44–53, Aizu, Japan, August 1997.
[39] A. A. Ammar, O. Gapenne, C. Lenay, and J. J. Stewart, “Effect
of bimodality on the perception of 2D forms by means of a
specific assistive technology for blind persons,” in Proceedings
of the Conference on Assistive Technology for Vision and Hear-
ing Impairment (CVHI ’2002), pp. 45–52, Grenade, Espagne,
August 2002.
[40] .
[41] X. Xu and B. Li, “Multiple class multiple-instance learning and
its application to image categorization,” International Journal
of Image and Graphics, vol. 7, pp. 427–444, 2007.
[42] J. Li and J. Z. Wang, “Automatic linguistic indexing of pictures
by a statistical modeling approach,” IEEE Transactions on Pat-
tern Analysis and Machine Intelligence, vol. 25, no. 9, pp. 1075–
1088, 2003.
[43] J. Z. Wang, J. Li, and G. Wiederhold, “SIMPLIcity: semantics-
sensitive integrated matching for picture libraries,” IEEE
Transactions on Pattern Analysis and Machine Intelligence,
vol. 23, no. 9, pp. 947–963, 2001.
[44] O. Maron, “Learning from ambiguity,” Doctoral dissertation,
Massachusetts Institute of Technology, AI Technical Report
1639, Cambridge, Mass, USA, 1998.
[45] O. Maron and T. Lozano-P
´
erez, “A framework for multiple-
instance learning,” in Advances in Neural Information Process-
ings Systems, vol. 10, MIT Press, Cambridge, Mass, USA, 1998.
[46] Q. Zhang and S. A. Goldman, “EM-DD: an improved
multiple-instance learning technique,” in Advances in Neural
Information Processing Systems, vol. 14, pp. 1073–1080, MIT
Press, Cambridge, Mass, USA, 2002.
[47] R. A. Amar, D. R. Dooly, S. A. Goldman, and Q. Zhang,
“Multiple-instance learning of real-valued data,” in Proceed-
ings of the 18th International Conference on Machine Learn-
ing (ICML ’01), pp. 3–10, Morgan Kaufmann, San Francisco,
Calif, USA, November 2001.
[48] Y. X. Chen and J. Z. Wang, “Image categorization by learning
and reasoning with regions,” Journal of Machine Learning Re-
search, vol. 5, pp. 913–939, 2004.
[49] LibSVM: />∼cjlin/libsvm.
[50] Z. Wang and C. Li, “Building detection and recognition via
the improved HOUGH transform,” in Proceedings of the In-
ternational Computer Congress on Wavelet Analysis and Its Ap-
plications, and Active Media Technology, vol. 2, pp. 1075–1080,
2004.
[51] N. C. Krishnan, B. Li, and S. Panchanathan, “Detecting and
classifying frontal, back, and profile views of humans,” in
Proceedings of the International Conference on Computer Vi-
sion Theory and Application (VISAPP ’07), Barcelona, Spain,
March 2007.
[52] NIST: />affairs/factsheet/visualdis-
play.htm.