Báo cáo hóa học: "Research Article A Markov Model for Dynamic Behavior of ToA-Based Ranging in Indoor Localization" ppt
Bạn đang xem bản rút gọn của tài liệu. Xem và tải ngay bản đầy đủ của tài liệu tại đây (1.59 MB, 14 trang )
Hindawi Publishing Corporation
EURASIP Journal on Advances in Signal Processing
Volume 2008, Article ID 241069, 14 pages
doi:10.1155/2008/241069
Research Article
A Markov Model for Dynamic Behavior of ToA-Based
Ranging in Indoor Localization
Mohammad Heidari and Kaveh Pahlavan
Center for Wireless Information Network Studies, Electrical and Computer Engineering, Worcester Polytechnic Institute,
100 Institute Road, Worcester, MA 01609, USA
Correspondence should be addressed to Mohammad Heidari,
Received 28 February 2007; Revised 27 July 2007; Accepted 26 October 2007
Recommended by Sinan Gezici
The existence of undetected direct path (UDP) conditions causes occurrence of unexpected large random ranging errors which
pose a serious challenge to precise indoor localization using time of arrival (ToA). Therefore, analysis of the behavior of the ranging
error is essential for the design of precise ToA-based indoor localization systems. In this paper, we propose a novel analytical
framework for the analysis of the dynamic spatial variations of ranging error observed by a mobile user based on an application
of Markov chain. The model relegates the behavior of ranging error into four main categories associated with four states of the
Markov process. The parameters of distributions of ranging error in each Markov state are extracted from empirical data collected
from a measurement calibrated ray tracing (RT) algorithm simulating a typical office environment. The analytical derivation of
parameters of the Markov model employs the existing path loss models for the first detected path and total multipath received
power in the same office environment. Results of simulated errors from the Markov model and actual errors from empirical data
show close agreement.
Copyright © 2008 M. Heidari and K. Pahlavan. This is an open access article distributed under the Creative Commons Attribution
License, which permits unrestricted use, distribution, and reproduction in any medium, provided the original work is properly
cited.
1. INTRODUCTION
Recently, indoor localization technology has attracted sig-
nificant attention, and a number of commercial and mili-
tary applications are emerging in this field [1]. Indoor chan-
nel environments suffer from severe multipath phenomena,
creating a need for novel approaches in design and devel-
opment of systems operating in these environments [2, 3].
Precise indoor localization systems are designed based on
range measurements from time of arrival (ToA) of the di-
rect path (DP) between transmitter and receiver, which is
severely challenged by unexpected large errors [4]. Therefore,
the ranging error modeling is essential in design of precise
ToA-based indoor localization systems.
There are empirical indoor radio propagation chan-
nel models available in the literature aiming primarily at
telecommunication applications [5–8]. These models were
designed prior to the understanding of the indoor localiza-
tion problem, and hence they did not concern the behavior
of ranging error in indoor environment. Therefore, they do
not provide a close approximation to the empirical observa-
tions of the ranging error [9]. More recently, indoor radio
propagation channel models designed for ultrawide band-
width (UWB) communications, specifically the work of IEEE
802.15.3 and IEEE 802.15.4a, have paid indirect attention to
the indoor localization problem [10–15], and recent research
studies propose UWB measurement system to obtain high-
accuracy localization systems [16, 17]. However, these indi-
rect models have not paid special attention to the occurrence
of undetected direct path (UDP) conditions, which is the
main cause of large errors in ranging estimate. The first direct
empirical model for ranging error is reported in [9, 18, 19].
These new direct models, however, do not address the spa-
tial correlation of the ranging error behavior observed by a
mobile user.
This paper presents a new methodology and a frame-
work for modeling and simulation of dynamic variations of
ranging error observed by a mobile user based on an ap-
plication of Markov chain. Markov chains, and particularly
hidden Markov models (HMMs), are widely used in the
2 EURASIP Journal on Advances in Signal Processing
telecommunication field. In [20], it is proposed to exploit
HMM in radar target detection. In [21], HMM is employed
along with Bayesian algorithms to provide a reliable estimate
of the location of the mobile terminal and to trace it. Fur-
thermore, in [22], HMM is used along with tracking algo-
rithms to provide a footmark of the nonline-of-sight condi-
tions, present a reliable estimate of the location of the mobile
terminal, and track it.
We categorize the ranging error into four different classes
and present clarifications as to the statistical occurrence of
each class of ranging errors. Furthermore, we provide dis-
tributions to model typical values of ranging error observed
in each class of receiver locations. Next, we link each class
of ranging errors to a state of a Markov process which can
be used for the simulation of spatial behavior of the class
of ranging errors for a mobile user randomly traveling in
a building. Finally, we provide a method to statistically ex-
tract the average probabilities of residing in a certain state
for the building under study. The presented model for dy-
namic behavior of ranging error is essential for the design
and performance evaluation of tracking capabilities of the
proposed algorithms for indoor localization. The parameters
of the Markov model are analytically derived from the results
of the UWB measurement conducted on the third floor of
the Atwater Kent laboratories (AK Labs) at Worcester Poly-
technic Institute (WPI). The parameters of distributions of
ranging error in each Markov state are extracted from empir-
ical data collected from a measurement calibrated ray trac-
ing (RT) algorithm simulating the same office environment.
The commonly used RT software, previously used in litera-
ture for communication purposes [23, 24], provides the ra-
dio propagation of the indoor environment in which reflec-
tion and transmission are the dominant mechanisms. It has
been shown that the existing RT software can be a useful and
practical simulation tool to assess the behavior of ranging er-
ror in indoor environments [9].
The paper is organized as follows. Section 2 summarizes
the background of ranging error modeling and classification
of ranging error, while Section 3 introduces a new frame-
work for the classification of ranging error observed in in-
door environment and presents the concept of state probabil-
ity. Section 4 discusses the principles of Markov model, ana-
lytical derivation of the parameters of the Markov chain, and
modeling of the state probabilities. Finally, Section 5 summa-
rizes the results and comments on the outcome of the simu-
lation.
2. FOUR CLASSES OF RANGING ERRORS
2.1. Background
In general, it has been observed that wireless channel con-
sists of paths arriving in clusters. The most popular method
to reflect this behavior on the channel response is based on
Saleh-Valenzuela model [5], in which the discrete multipath
indoor channel impulse response (CIR) can be characterized
as
h(t)
= X
L
l=1
K
k=1
α
k,l
e
jφ
k,l
δ
t −T
l
−τ
k,l
,(1)
where
{T
l
} represents the delay of the lth cluster, {α
k,l
},
{φ
k,l
},and{τ
k,l
} represent tap weight, phase, and delay of
the kth multipath component relative to the lth cluster ar-
rival time (T
l
), respectively, and X represents the log-normal
shadowing [10, 12]. The tap weights,
{α
k,l
}, are determined
based on practical path loss exponents and signal loss of
different building materials for reflection and transmission
mechanisms in indoor environment [25]. The CIR then con-
sists of
{α
k,l
} which are within the dynamic range of the
system. In this article, we use (1), previously used in IEEE
802.15.3a, to model the behavior of channel since it high-
lights the importance of cluster-based arrival of paths. How-
ever, a more sophisticated cluster-based model can be used to
fully model the behavior of the wireless channel. The inter-
ested reader can refer to [11, 15] for more detailed modeling
and description of UWB channels.
The CIR is usually referred to as infinite-bandwidth chan-
nel profile since with infinite bandwidth the receiver could
theoretically acquire every detectable path. Let α
DP
= α
1,1
and τ
DP
= τ
1,1
represent the amplitude and ToA of the
DP component, respectively. In ToA-based positioning sys-
tems, the distance between the antenna pair is obtained using
d
= τ
DP
×c,wherec represents the speed of light. The range
estimate is determined using
d = τ
FDP
×c,whereτ
FDP
repre-
sents the ToA of the first detected path (FDP) of the channel
profile within the dynamic range of the system. The distance
measurement or ranging error in such systems is then de-
fined as ε
=
d −d [9, 18].
In practice, however, the limited bandwidth of the lo-
calization system results in arriving paths with pulse shapes,
which is referred to as channel profile and can be represented
by
h(t)
= X
L
l=1
K
k=1
α
k,l
s
t −T
l
−τ
k,l
,(2)
where s represents the time-domain pulse shape of the filter.
In practice, Hanning and raised-cosine filters are widely used
in today localization domain. As a result of filtering the CIR,
sidelobes of each pulse shape respective to each path can be
constructively or destructively combined to each other and
form different peaks which consequently limit the accuracy
of the ranging process.
In the past decade, empirical results from software simu-
lation using RT [9], wideband [3], and UWB [18]measure-
ments of the indoor radio propagation have revealed the oc-
currence of a wide variety of ranging errors. In the most com-
mon classification of the receiver location, the sight condi-
tion between the transmitter and the receiver categorizes the
receiver location and the ranging error associated with it into
two main classes of line-of-sight (LoS) and nonline-of-sight
(NLoS) conditions. However, further investigation reported
that depending on the relative location of the transmitter and
receiver and their position with respect to the blocking ob-
jects, that is, large metallic objects, these ranging errors can
be further divided into four main categories of detected di-
rect paths (DDPs), natural undetected direct paths (NUDPs),
shadowed undetected direct paths (SUDPs), and no cover-
age (NC) [4, 9, 26, 27].Thefocusofthisresearchisonthe
M. Heidari and K. Pahlavan 3
ranging error modeling of LoS/DDP, NUDP, and SUDP and
on modeling the dynamic behavior of ranging error observed
by mobile client in indoor environment.
2.2. Ranging error classification based on power
The receiver location classification is mainly accomplished by
means of power. In such classifications, the class of ranging
errors associated with each receiver location can be defined
according to the power of the DP component and the total
received power given by
P
DP
= 20 log
10
α
DP
,
P
tot
= 10 log
10
L
l=1
K
k=1
α
k,l
2
(3)
as well as blocking condition λ
i
, which is a binary index to
indicate the blockage of DP and its adjacent components by
an obstructive object. In this paper, it is assumed that for the
specified locations of the transmitter and receiver, the true
value of λ
i
is known, where λ
i
= 0 represents a channel pro-
file which is not blocked and λ
i
= 1 represents a channel
profile which is blocked by an obstructive object.
In DDP class of receiver locations, which is indeed a sub-
class of LoS, λ
i
= 0, P
DP
>η,andP
tot
>η,inwhichη repre-
sents the detection threshold and it is dependent on the mea-
surement noise of the system. Fixing the transmitter power
at a regulated level, η can be related to the dynamic range
of the system. However, increasing the dynamic range of the
system, that is, decreasing η, raises the likelihood of the DP
component to be detected at the receiver side, but it also in-
creases the probability of detecting a noise term (or a side-
lobe peak) as the DP component, that is, a false alarm [28].
Efficient selection of the proper value of η can improve the
accuracy of the localization system [29]. Typical values of
η are 5
∼10 dB above the measurement noise present in in-
door environment. In DDP conditions, τ
FDP
≈ τ
DP
= τ
1,1
and ε = (τ
FDP
−τ
1,1
) ×c result in insignificant ranging error
associated with the ToA measurement given by
f
ε
DDP
(ε) = f
M
(ε), (4)
where f
M
represents the multipath-induced errors which are
considered as the main source of ranging errors in LoS/DDP
class.
In NUDP class of receiver locations, λ
i
= 0andP
tot
>η,
but P
DP
<η, resulting in τ
FDP
= τ
1,k, k=1
, which indicates
that the DP component is not within the dynamic range of
the system, and hence it cannot be detected, but a neigh-
boring path from the first cluster was detected as the FDP.
Consequently, ε
= (τ
FDP
− τ
1,1
) × c is in the order of ray ar-
rivalratedefinedintheCIRsystemmodelpresentedin(2).
It has been shown that NUDP ranging errors are small and
occur in small bursts [4]. The gradual weakening of the DP
component due to loss of power from reflection and trans-
mission mechanisms suggests that by moving further from
the transmitter at a certain break-point distance, the power
of the DP component, P
DP
, falls below the detection thresh-
old, that is, not within the dynamic range of the system, and
consequently the receiver exits DDP condition and enters
NUDP condition. Similar to DDP class of receiver locations,
in NUDP regions, the error is given by
f
ε
NUDP
(ε) = f
M+NUDP
(ε), (5)
where f
M+NUDP
indicates that the multipath and loss of DP
component are the main sources of ranging errors.
Contrary to the above states, in SUDP class of receiver
locations, the attenuation of the multipath components re-
sults in very weak paths regarding the first cluster, that is,
channel profiles with soft onset CIR [11, 30], which shift
the strongest component to the middle of the CIR. Conse-
quently, for SUDP class of receiver locations, P
DP
<ηand
P
tot
>η,butλ
i
= 1 denoting that the receiver location is
blocked by a metallic object. In such scenarios, τ
FDP
= τ
i,j, i=1
,
indicating the blockage of the first cluster and the fact that
the second cluster is detected instead, resulting in FDP com-
ponent being either the first or one of the following paths
of the second cluster. Consequently, ε
= (τ
FDP
− τ
1,1
) × c
is in the order of cluster arrival rate defined in the CIR sys-
tem model. Results of extensive UWB measurement and sim-
ulation in indoor environments confirm the occurrence of
unexpected large ranging errors associated with SUDP con-
dition observed in indoor environment [3, 9, 18, 19]. For
SUDP regions,
f
ε
SUDP
(ε) = f
M+NUDP+SUDP
(ε), (6)
where f
M+NUDP+SUDP
indicates that multipath, loss of DP
component, and blockage are the main sources of ranging
errors.
Finally, for the last class of receiver locations, which is re-
ferred to as NC conditions, P
tot
<ηin which communica-
tion is not feasible and the receiver is out of range. Assuming
that the mobile terminal resides in one of the UDP areas, by
moving further from the transmitter at a certain break-point
distance, the receiver transitions from UDP condition to NC
condition. In NC condition, the range estimate is not avail-
able and ranging error is undefined.
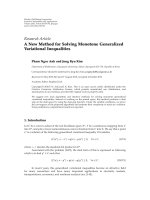
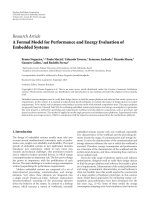
Figure 1 illustrates the areas associated with the four
classes of ranging errors on the third floor of AK Labs at
WPI for the specified location of the transmitter. To deter-
mine the areas, we have used the measurement calibrated
RT software previously used in [9] to generate comprehen-
sive samples of CIR for different locations of the receiver in
the building. The class of ranging errors associated with each
receiver location is defined according to P
DP
and P
tot
given
by (3) and the physical layout of the building, represented
by λ
i
. Increasing the distance of the antenna pair in indoor
environment increases the probability of blockage of the DP
component. In NUDP class of receiver locations, although
the receiver location is not blocked by metallic objects, P
DP
falls below the detection threshold η, and hence the receiver
makes erroneous estimate of the distance of the antenna pair.
In SUDP class of receiver locations, blockage of the DP com-
ponent and its adjacent paths with a metallic object attenu-
ates the DP component and its adjacent paths significantly,
and hence the receiver makes an unexpectedly large ranging
error by detecting another reflected path.
4 EURASIP Journal on Advances in Signal Processing
0 10 2030405060
X (m)
0
5
10
15
20
Y (m)
Area = 219.5124
NC
NUDP
DDP
Tx
SUDP
Figure 1: Indoor receiver classification simulation for a sample lo-
cation of the transmitter. The location of the metallic chamber close
to the transmitter causes lots of SUDP receiver locations.
3. RANGING ERROR CLASSIFICATION
BASED ON DISTANCE
3.1. Infrastructure-distance-measurement- (IDM-)
based model
The receiver location classification described above is very
difficult to obtain as it is computationally tedious and time-
consuming. Alternatively, to avoid the extensive simulation
and/or measurement to categorize the receiver locations in
a building, we have developed an infrastructure-distance-
measurement-(IDM-) based model based on the realistic
path loss models for indoor environment [9] to represent dif-
ferent classes of receiver locations and ranging errors associ-
ated with them. Assuming the knowledge of blockage con-
dition, λ
i
(r),foreachreceiverlocation,theproposedmodel
can be represented as follows:
ξ
i
=
⎧
⎪
⎪
⎪
⎪
⎪
⎪
⎪
⎪
⎪
⎪
⎨
⎪
⎪
⎪
⎪
⎪
⎪
⎪
⎪
⎪
⎪
⎩
DDP : d<d
1
∩λ
i
(r) = 0,
NUDP: d
1
<d<d
2
∩λ
i
(r) = 0,
SUDP: d<d
3
∩λ
i
(r) = 1,
NC:
⎧
⎨
⎩
d>d
2
∩λ
i
(r) = 0,
d>d
3
∩λ
i
(r) = 1,
(7)
where ξ
i
represents the class of receiver locations and d
1
,
d
2
,andd
3
represent the distance break-point of DDP and
NUDP regions, the distance break-point of NUDP and NC
regions, and the distance break-point of SUDP and NC re-
gions, respectively. The sample break-points are determined
by extensive frequency measurements (sweeping frequency
of 3–8 GHz with a sampling frequency of 1 MHz) conducted
in the sample indoor environment [31]tobearound18m,
35 m, and 30 m, respectively. The measurement setup has a
sensitivity of
−80 dBm representing the detection threshold
[9, 32]. Altering the sensitivity of the measurement system,
that is, the detection threshold and dynamic range of the
010 203040 5060
X (m)
0
5
10
15
20
25
Y (m)
NC
NUDP
DDP
Tx
SUDP
DDP
NUDP
NC
SUDP
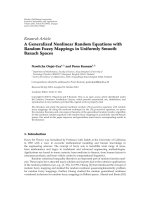
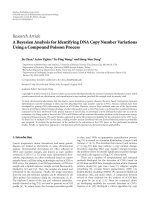
Figure 2: Indoor receiver classification for the same location of the
transmitter based on infrastructure-distance-measurement (IDM)
model.
system, as well as other parameters of the measurement will
cause modifications in determination of the break-point dis-
tances [28]. However, such modifications are not in the scope
of this article, and the reported break-point distances are de-
termined using the above measurement setup.
To verify the validity of the proposed model, that is, IDM
realization, we can compare it with RT simulation. Very close
agreement between RT simulation and IDM realization of
different categories is illustrated in Figure 2,whichdemon-
strates the validity of the proposed IDM realization. The
above model, however, represents the static classification of
the receiver locations in indoor environments.
3.2. Introduction to state probabilities
Having defined the four classes of receiver locations and
ranging errors, we can define the state probability of each
state which is the average staying time of the mobile client in
that state. Modeling the state probabilities enables us to pre-
dict the class of ranging errors that a mobile user observes
traveling in indoor environment. It also helps in Markov
chain initialization as it models the average probability of re-
siding in a certain state. For each class of receiver locations,
the state probability is defined as
P
z
= P
ξ
i
∈ z
=
ξ
i
∈z
dx dy
ξ
i
∈M
dx dy
,(8)
in which M represents the union set of receiver locations and
z
∈{DDP, NUDP, SUDP, NC} represents the desired state.
The state probabilities, in general, are not easy to find an-
alytically as they vary with the change of transmitter location
and shape and details of the building. However, statistics of
the state probabilities are easy to find and model by alter-
ing the location of the transmitter and modeling the result
M. Heidari and K. Pahlavan 5
of simulation. Using (7) to categorize the receiver locations
into DDP, NUDP, SUDP, and NC for the same indoor envi-
ronment described in Figure 2,wewereabletocomparethe
average SUDP state probability of the IDM realization and
wideband measurement previously conducted in the same
scenario. We observed that on average a random mobile
client would expect to be in SUDP condition with probability
of 8.9% according to IDM realization which is close to the re-
ported value of 7.4% obtained from wideband measurement
[9, 26].
Each state probability can be considered as a random
variable. Knowing the statistics of the state probability for
a certain state, we are able to define the cumulative distribu-
tion function (CDF) of the state probability. It follows that
F
P
SUDP
p
1
=
P{P
SUDP
<p
1
},(9)
which discloses the receiver locations in which its state prob-
ability is less than a certain value p
1
. Finally, the probability
distribution function (PDF) can be defined as f
P
SUDP
(p
1
) =
∂F
P
SUDP
(p
1
)/∂p
1
. It is worth mentioning that f
P
SUDP
can be
considered as a random variable modeling the distribution of
SUDP state probability, which itself is limited to the interval
[0, 1). Therefore, the outcome of such distribution should be
truncated to remain in [0, 1) so as to ensure that state proba-
bilities are within their limits.
4. DYNAMIC BEHAVIOR OF RANGING ERROR
A random mobile client in an indoor environment experi-
ences switching among different classes of ranging errors,
back and forth, as it keeps moving. Such spatial correla-
tion and change of class can easily be modeled with Markov
chains.
4.1. Ranging states of the Markov model
As the mobile client randomly travels in the building, as
shown in Figure 1, depending on the region of movement, it
experiences different classes of ranging errors. Using the four
classes of ranging errors observed in separate areas of an in-
door environment, we can construct a four-state first-degree
Markov model to represent the dynamic behavior of ranging
error observed by the mobile user. Random movement of the
mobile user results in change of its observed class of rang-
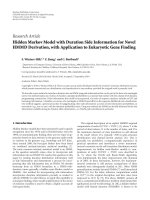
ing errors, with particular probabilities. The general Markov
model representation for indoor positioning is described in
Figure 3. Let the current receiver location, ξ
i
in (7), embed
the state of the mobile terminal ω
i
,whereω
i
is defined over
a discrete set Z consisting of four different receiver location
classes or states, Z
={DDP, NUDP, SUDP, NC}. The state of
the mobile client movement within a 2D space in an indoor
environment can be modeled with a Markov chain Ω
0:i
=
{
ω
0
, , ω
i
} which can be generated by ω
i
∼MC(π
(ω)
, P
(ω)
)
with initial state PDF π
(ω)
= p{ω
0
}. The initial state PDF,
π
(ω)
, can then be related to the state probabilities and the av-
erage transition probabilities
P
(ω)
= p
(ω)
i,j
.
Following the methodology described in [27, 33], transi-
tion probabilities are defined as the rate of switching between
Markov states or staying in the same state, accordingly, and
they can be represented as
P
(ω)
=
⎡
⎢
⎢
⎢
⎢
⎢
⎢
⎣
p
(ω)
11
p
(ω)
12
p
(ω)
13
p
(ω)
14
p
(ω)
21
p
(ω)
22
p
(ω)
23
p
(ω)
24
p
(ω)
31
p
(ω)
32
p
(ω)
33
p
(ω)
34
p
(ω)
41
p
(ω)
42
p
(ω)
43
p
(ω)
44
⎤
⎥
⎥
⎥
⎥
⎥
⎥
⎦
, (10)
where
p
(ω)
i,j
is defined as the average transition probability
from the state i to the state j,asillustratedinFigure 3. These
average transition probabilities can then be obtained using
the following equation:
p
(ω)
i,j
= p
ω
k
= j | ω
k−1
= i
. (11)
From Figure 3, it can be concluded that transition from
DDP state to NC state is only possible through one of the
UDP states; so the resulting transition probabilities are set to
zero, accordingly.
4.2. Average transition probabilities
Intuitively, the transition probability, that is, crossing rate be-
tween two states, is a function of the area of the states and
the length of the boundary between the two states. Previous
studies were mainly based on the statistics of such transi-
tions. However, in this section, we present the details of ob-
taining the transition probabilities by discretizing the contin-
uous problem, that is, forming a grid of receiver locations in
the regions. Assuming that at time t
= t
k
the mobile client is
located at one of the grid points, then at t
= t
k+1
the mobile
client travels to one of the adjacent grid points. Let Δ repre-
sent grid size and let T
= t
k+1
− t
k
represent the sampling
time. Thus Δ
= v ×T,wherev represents the velocity of the
mobile client. Furthermore, let α
c
represent the crossing rate
of the system which depends on the spatial pattern of move-
ments. In our discrete model for indoor movements, assum-
ing the walls are either horizontal or vertical, a mobile can
only move in four directions. Assuming absolute random-
ness in the movement of the mobile client results in crossing
rate probability of α
c
= 1/4 and staying in the same region
with probability of 1
− α
c
,asFigure 4 suggests. The average
probability of crossing can then be obtained as
p
12
=
α
c
×(l/Δ)+0×
S
1
/Δ
2
−l/Δ
S
1
/Δ
2
, (12)
where l represents the boundary length of the two regions
and S
1
represents the area of the first region. Simplifying (12)
results in
p
12
= α
c
×
l × Δ
S
1
= α
c
×
l × vT
S
1
. (13)
Generalizing the results of the previous two states, that is,
two-region random movement, to our Markov model with
6 EURASIP Journal on Advances in Signal Processing
p
44
Stay in NC
p
22
Stay in NUDP
p
24
p
12
p
21
p
23
p
34
p
42
p
43
SUDP
ε
SUDP
= GEV
(k
SUDP
, μ
SUDP
,
σ
SUDP
)
NC
NUDP
ε
NUDP
=
N (μ
NUDP
,
σ
NUDP
)
DDP
ε
DDP
=
N (0, σ
DDP
)
p
11
p
31
p
13
p
32
Stay in DDP Stay in SUDP
p
33
Figure 3: Markov model presented for dynamic behavior of the ranging error in indoor localization.
four states, we can obtain the transition probability matrix
as
P =
⎡
⎢
⎢
⎢
⎢
⎢
⎢
⎢
⎢
⎢
⎢
⎢
⎢
⎣
Q
1
α
c
l
12
×vT
S
1
α
c
l
13
×vT
S
1
α
c
l
14
×vT
S
1
α
c
l
21
×vT
S
2
Q
2
α
c
l
23
×vT
S
2
α
c
l
24
×vT
S
2
α
c
l
31
×vT
S
3
α
c
l
32
×vT
S
3
Q
3
α
c
l
34
×vT
S
3
α
c
l
41
×vT
S
4
α
c
l
42
×vT
S
4
α
c
l
43
×vT
S
4
Q
4
⎤
⎥
⎥
⎥
⎥
⎥
⎥
⎥
⎥
⎥
⎥
⎥
⎥
⎦
,
(14)
where Q
1
denotes 1 −α
c
((l
12
+ l
13
+ l
14
) ×vT/S
1
), Q
2
denotes
1
−α
c
((l
21
+l
23
+l
24
)×vT/S
2
), Q
3
denotes 1−α
c
((l
31
+l
32
+l
34
)×
vT/S
3
), Q
4
denotes 1−α
c
((l
41
+l
42
+l
43
)×vT/S
4
), and l
ij
= l
ji
represents the boundary length between ith and jth regions
and S
k
represents the area of the kth region. Combining α
c
and vT parameters, we can obtain
P =
⎡
⎢
⎢
⎢
⎢
⎢
⎢
⎢
⎢
⎢
⎢
⎢
⎢
⎣
W
1
β
l
12
S
1
β
l
13
S
1
β
l
14
S
1
β
l
12
S
2
W
2
β
l
23
S
2
β
l
24
S
2
β
l
13
S
3
β
l
23
S
3
W
3
β
l
34
S
3
β
l
14
S
4
β
l
24
S
4
β
l
34
S
4
W
4
⎤
⎥
⎥
⎥
⎥
⎥
⎥
⎥
⎥
⎥
⎥
⎥
⎥
⎦
, (15)
where W
1
denotes 1 −β((l
12
+ l
13
+ l
14
)/S
1
), W
2
denotes 1 −
β((l
12
+l
23
+l
24
)/S
2
), W
3
denotes 1−β((l
13
+l
23
+l
34
)/S
3
), W
4
denotes 1 −β((l
14
+ l
24
+ l
34
)/S
4
), and β = α
c
×vT represents
both the velocity of the mobile client and the probability of
S
2
Δ
S
1
Δ
Crossing with
probability of α
c
Figure 4: Crossing rate of a random mobile client from one Markov
state to another.
crossing among the regions as well as the sole parameter to
be determined. In the case of indoor positioning, the DDP
and NC regions are not connected directly, resulting in l
14
=
l
41
= 0, which confirms the absence of the link between DDP
and NC states in Figure 3.
4.3. Exponential modeling of average staying time
As discussed in [33], the Markov property reveals the follow-
ing in regard to the eigenvectors of
P:
ϕ
1
= 1,
ϕ
i
i
=1
< 1 =⇒ Pυ
i
= ϕ
i
υ
i
, (16)
M. Heidari and K. Pahlavan 7
where ϕ
i
represents the eigenvalues of P and υ
i
represents the
eigenvectors associated with ϕ
i
. For the presented Markov
model, υ
i
= [
e
1
e
2
e
3
e
4
]and
e
i
= 1, representing the
normalized eigenvector. We concentrate on the steady state
probabilities as the Markov chain settles into stationary be-
havior after the process has been running for a long time.
When this occurs, we have
Pυ
1
= υ
1
(17)
which represents the eigenvector associated with ϕ
1
= 1
and determines the expected average waiting time in each
state. Next, assuming homogeneous transition probabilities
in continuous time, that is, P[X(s + t)
= j | X(s) = i] =
P[X(t) = j | X(0) = i] = p
ij
(T
n
), we convert the dis-
crete Markov chain in (15)toanequivalentcontinuous-
time Markov chain to extract the staying time distributions
of each state. The memoryless distribution of the staying
time in a certain state can then only be described by an
exponential random variable p[T >t]
= e
−γ
i
t
[33]. Sim-
ilar to the methodology described in [33], γ
i
scanbede-
termined by solving the respective Chapman-Kolmogorov
equation and equating γ
i
to −1/θ
ii
,withθ being the solu-
tion of Chapman-Kolmogorov equation. The solution for the
Chapman-Kolmogorov equation for the steady state
P results
in
θ
=
⎡
⎢
⎢
⎢
⎢
⎢
⎢
⎢
⎢
⎢
⎢
⎢
⎢
⎣
R
1
β ×
l
12
S
1
β ×
l
13
S
1
β ×
l
14
S
1
β ×
l
12
S
2
R
2
β ×
l
23
S
2
β ×
l
24
S
2
β ×
l
13
S
3
β ×
l
23
S
3
R
3
β ×
l
34
S
3
β ×
l
14
S
4
β ×
l
24
S
4
β ×
l
34
S
4
R
4
⎤
⎥
⎥
⎥
⎥
⎥
⎥
⎥
⎥
⎥
⎥
⎥
⎥
⎦
, (18)
where R
1
denotes −β × (l
12
+ l
13
+ l
14
)/S
1
, R
2
denotes −β ×
(l
12
+ l
23
+ l
24
)/S
2
, R
3
denotes −β × (l
13
+ l
23
+ l
34
)/S
3
,and
R
4
denotes −β × (l
14
+ l
24
+ l
34
)/S
4
, which in the case of the
presented Markov model leads to
γ
1
γ
2
γ
3
γ
4
=
B
1
B
2
B
3
B
4
, (19)
where B
1
denotes S
1
/β(l
12
+l
13
+l
14
), B
2
denotes S
2
/β(l
12
+l
23
+
l
24
), B
3
denotes S
3
/β(l
13
+ l
23
+ l
34
), and B
4
denotes S
4
/β(l
14
+
l
24
+ l
34
).
Determining exponential parameters allows us to simu-
late the average waiting time in each state and compare them
with the results of the empirical data.
4.4. Multivariate distribution modeling of
the state probabilities
Intuitively, altering the location of the transmitter will
change the state probabilities; for example, a transmitter
location close to the obstructive metallic object will cause
larger set of SUDP receiver locations. The histogram of the
state probabilities can then be modeled by a multivariate dis-
tribution, as the state probabilities are not clearly indepen-
dent. In order to find the best distribution to model the state
probabilities, we altered the location of the transmitter in the
floor plan of the building under study and investigated the
histograms and probability plots of the state probabilities.
As it is shown in the following section, a practical choice for
the multivariate distribution is Gaussian distribution which
leads us to form a joint Gaussian distribution to model the
state probabilities of the main three states. The fourth state
can then be found deterministically as the sum of the state
probabilities should be equal to unity. Therefore, we can start
with a multivariate normal distribution to represent the state
probabilities:
f
Y
(y) = (2π)
−3/2
|Σ|
−1/2
exp
−
1
2
(y
−µ)
T
Σ
−1
(y −µ)
,
(20)
where y
=
P
DDP
P
NUDP
P
SUDP
represents the random
vector containing the average state probability values, Σ and
µ are the parameters of the joint distribution, and T repre-
sents the transpose of a vector. In order to extract the pa-
rameters of this multivariate normal distribution, we used
sample mean to approximate the mean as
µ =
1
n
n
k=1
P
z
k
, z ∈{DDP, NUDP, SUDP}, (21)
where P
z
k
represents the kth observed state probability of the
state z,andn represents the total number of observations.
The maximum likelihood estimator of the covariance matrix
can then be defined as
Σ =
1
n −1
n
k=1
P
z
k
−
µ
P
z
k
−
µ
T
, (22)
where
µ is the sample mean, P
z
k
=
P
DDP
k
P
NUDP
k
P
SUDP
k
represents the kth state probability observation, and n repre-
sents the total number of observations.
Now with the aid of Cholesky decomposition, we pro-
vide a method for reconstructing the state probabilities in a
typical indoor scenario. In communication realm, Cholesky
decomposition is used in synchronization and noise suppres-
sion [34, 35]. Similar to [36], in order to regenerate these
state probabilities, one may pursue the following procedure.
The first step is to decompose the covariance matrix using
Cholesky decomposition method:
AA
T
=
Σ, (23)
then we generate a vector of standard normal values Z,and
use the following equation:
y
=
µ + AZ, (24)
where
y
= [P
DDP
P
NUDP
P
SUDP
] represents the generated
values of state probabilities.
We refer to this method of extracting state probabilities as
multivariate normal distribution (MND) model throughout
this paper.
8 EURASIP Journal on Advances in Signal Processing
5. SIMULATION AND RESULTS
To completely model the dynamic behavior of ranging error
observed in indoor environment, the transition probabilities
of the Markov chain and statistics of ranging error for each
Markov state are required. Thus, we started the process by
categorizing the receiver locations according to (7). Once the
class of each receiver location and consequently the Markov
state associated with it were identified, different distributions
for statistics of ranging error observed in each class are intro-
duced and modeled. Consequently, by collecting the area of
each state and the boundary length between each two states,
the transition probabilities were acquired based on (15). Fi-
nally, we modeled the dynamic behavior of the ranging error
by running the Markov chain, and we compared the results
of analytical derivation obtained from Section 4 to RT simu-
lation of a dynamic scenario observed in the sample indoor
environment. Furthermore, altering the location of the trans-
mitter and gathering the observed values for state probabil-
ities of each state enabled us to model the statistics of state
probabilities and initialize the Markov chain.
For the purpose of the simulation, we considered the
third floor of AK Labs at WPI as the floor plan of the build-
ing under study which resembles typical indoor office envi-
ronment; yet it is a really harsh environment due to the ex-
istence of extensive blocks of metallic objects in the build-
ing. We formed a grid of receiver locations in the floor plan,
approximately 14000 receiver locations, and generated their
respective CIRs for different locations of the transmitter. In
order to simulate the real-time channel profile of the CIR,
a finite bandwidth raised-cosine filter can be used to extract
the channel profile. For the purpose of ToA-based localiza-
tion, it is shown that a minimum bandwidth of 200 MHz is
sufficient for effectively resolving the multipath components
and combating the multipath-induced error [4]. However,
we used a 5 GHz raised-cosine filter to obtain a more realistic
channel profile captured by an UWB measurement system.
Postprocessing peak detection algorithm is then used to es-
timate τ
FDP
and consequently form the error, as discussed in
Section 2.
5.1. Ranging error modeling for different
classes of receiver locations
Modeling the ranging error observed in different classes of
receiver locations in indoor localization is the major chal-
lenge in the analysis of an indoor positioning system. It is a
common belief that occurring ranging errors associated with
LoS state (and equivalently DDP state) can be simulated with
Gaussian distribution [18]. However, in NLoS conditions,
and equivalently in NUDP and SUDP states, different dis-
tributions consisting of Gaussian [18], exponential [14, 22],
log-normal [37, 38], and mixture of exponential and Gaus-
sian [19, 39] have been used for modeling the ranging error.
Comprehensive UWB measurement and modeling of rang-
ing errors in NLoS can be found in [40]whichreportsa
heavy-tail distribution for ranging errors observed in UDP
conditions. In this section, we provide precise distribution
for modeling the ranging error associated with each state.
−0.05 −0.03 −0.01 0.01 0.03 0.05
Ranging error (m)
0
0.1
0.2
0.3
0.4
0.5
0.6
0.7
0.8
0.9
1
Cumulative probability
CDF comparison of DDP ranging error and normal fit
DDP ranging error
Normal fit
(a) DDP
0.06 0.08 0.10.12 0.14 0.16 0.18
Ranging error (m)
0
0.1
0.2
0.3
0.4
0.5
0.6
0.7
0.8
0.9
1
Cumulative probability
CDF comparison of NUDP ranging error and normal fit
NUDP ranging error
Normal fit
(b) NUDP
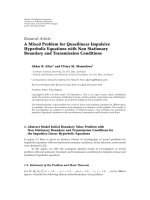
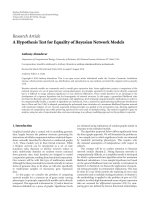
Figure 5: Distribution modeling of the ranging error with normal
distribution for (a) DDP class of receiver locations and (b) NUDP
class of receiver locations.
For each class of receiver locations, we provide the histogram
and, if necessary, the probability plot of the error for visual-
ization of the goodness of fit.
Figure 5(a) compares the CDF of the observed ranging
error for DDP class of receiver locations with its respective
normal distribution fit. In DDP class of receiver locations,
λ
i
= 0, and using (4)leadsusto
f
ε
DDP
(ε) = f
M
(ε) = N (μ
DDP
, σ
DDP
). (25)
Similarly, Figure 5(b) compares the CDF of NUDP rang-
ing error with its normal distribution fit. It can be noticed
that although the CDF of ranging errors is similar in case of
DDP and NUDP ranging errors, the NUDP ranging errors
M. Heidari and K. Pahlavan 9
Table 1: Parameters of normal distribution and ranging error of
DDP and NUDP classes.
Normal distribution
DDP ranging error
μ
DDP
σ
DDP
0.0135 0.0105
NUDP ranging error
μ
NUDP
σ
NUDP
0.1063 0.0239
Table 2: Passing rate of K −S and statistical value of χ
2
hypothesis
tests at 5% significance level, and ranging error for SUDP class.
Distribution SUDP
K
−Sχ
2
Akaike weight
Normal 78.71% 50.84% 0
Weibull 85.02% 74.91% 8.6
×10
−10
GEV 96.86% 85.31% 1
Log-normal 87.82% 67.11% 6.4
×10
−17
tend to be more positive. Therefore, the distribution of rang-
ing error can be represented as
f
ε
NUDP
(ε) = f
M+NUDP
(ε) = N (μ
NUDP
, σ
NUDP
), (26)
where μ
NUDP
>μ
DDP
.
Our explanation to such observation is the presence of
propagation delay and the larger separation of the antenna
pair, which allow multipath and loss of the DP to be more
effective. Ta ble 1 provides the statistics of ranging errors ob-
served in such classes of receiver locations.
In SUDP class of receiver locations, the ranging errors are
following a heavy-tail distribution which cannot be modeled
with a Gaussian distribution. It can be observed that in such
scenarios, the infrastructure of the indoor environment com-
monly obstructs the DP component and causes unexpected
larger ranging errors. As a result, the statistical characteristics
of the ranging error in SUDP class exhibit a heavy-tail phe-
nomenon in its distribution function. This heavy-tail phe-
nomenon has been reported and modeled in the literature.
As in [19, 39], the observed ranging error was modeled as a
combination of a Gaussian distribution and an exponential
distribution, and the work in [37, 38] modeled the ranging
error with a log-normal distribution.
Traditionally, log-normal, Weibull, and generalized ex-
treme value (GEV) distributions are used to model the phe-
nomenon with heavy tail. The GEV class of distributions,
with three degrees of freedom, is applied to model the ex-
treme events in hydrology, climatology, and finance [41].
Ta ble 2 summarizes the results of the K
−S test and χ
2
test
for SUDP class of different distributions. It can be observed
that from the distributions offered to model the SUDP rang-
ing error, normal distribution fails both K
−S and χ
2
hypoth-
esis tests, while the rest of distributions pass the hypothesis
tests.
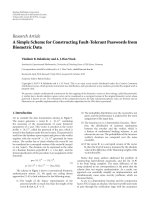
Figure 6(a) compares the PDF of the ranging error for
SUDP state with its respective normal, Weibull, GEV, and
log-normal fits. Figure 6(b) illustrates the probability plot
and the closeness of the fits for SUDP class. From Tab le 2 ,
Table 3: Parameters of GEV distribution and ranging error of
SUDP class.
GEV distribution
SUDP ranging error
μ
SUDP
σ
SUDP
k
SUDP
2.5218 1.2844 0.4198
it can be also observed that GEV distribution passing rate
is the highest amongst all distributions, which is expected
as GEV models the heavy-tail phenomenon with three de-
grees of freedom compared to two degrees of freedom of
log-normal and Weibull distributions. Similar observations
have been reported in [40] using UWB measurements con-
ducted in different indoor environments. Quantitatively, for
the selection of the best distribution, we refer to the Akaike
information criterion [42], represented in Tabl e 2 ,byform-
ing the log-likelihood function of the candidate distribution
and penalizing each distribution with its respective number
of parameters to be estimated. Following the methodology
describedin[42], the Akaike weights can be used to deter-
mine the best model which fits the empirical data. The higher
values of Akaike weight represent more plausible distribu-
tion, and the highest value can be associated with the best
model. The result of such experiment also confirms the re-
sult of probability plot and suggests that the best distribution
to model the ranging error associated with SUDP class is in
fact a GEV distribution, since all the other Akaike weights are
practically zero.
The GEV distribution is defined as
f (x
| k, μ, σ)
=
1
σ
exp
−
1+k
(x
−μ)
σ
−1/k
1+k
(x
−μ)
σ
−1−1/k
,
(27)
for 1 + k((x
− μ)/σ) > 0, where μ is defined as the location
parameter, σ is defined as the scale parameter, and k is the
shape parameter. The value of k defines the type of the GEV
distribution; k
= 0 is associated with type I, also known as
Gumbel, and k<0 is associated with type II, which is also
correspondent to Weibull. However, type III, associated with
k>0, which is known as Frechet type, best models the heavy
tail observed in ranging errors associated with SUDP class of
receiver locations. Parameters of the GEV distribution, mod-
eling the ranging error observed in SUDP class of receiver
locations, are reported in Ta ble 3.Evidentally,itcanbenoted
that the presented GEV distribution for ranging errors ob-
served in SUDP class of receiver locations belongs to the third
category with its respective k>0. Hence,
f
ε
SUDP
(ε) = f
M+NUDP+SUDP
(ε) = GEV
μ
SUDP
, σ
SUDP
, k
SUDP
,
(28)
where k
SUDP
> 0.
Next we relate the statistics of the ranging errors observed
in different classes of receiver locations to the parameters of
the cluster model defined in IEEE 802.15.3(see(2). It is im-
portant to notice that the small ranging error values reported
10 EURASIP Journal on Advances in Signal Processing
2 4 6 8 10 12 14 16 18 20
Ranging error (m)
0
0.05
0.1
0.15
0.2
0.25
0.3
0.35
0.4
Denisty
PDF comparison of SUDP ranging error
SUDP ranging error
Normal fit
We ib ul l fit
GEV fit
Log-normal fit
(a) Histogram
0 2 4 6 8101214161820
Ranging error (m)
0.0001
0.0005
0.001
0.005
0.01
0.05
0.1
0.25
0.5
0.75
0.9
0.95
0.99
0.995
0.999
0.9995
0.9999
Probability
Probability plot of the SUDP ranging error
SUDP ranging error
Normal fit
We ib ul l fit
GEV fit
Log-normal fit
(b) Probability plot
Figure 6: Statistical analysis of ranging error observed in SUDP class of receiver locations. (a) Histogram of ranging error and (b) probability
plot of ranging error versus different distributions. It can be concluded that GEV distribution best models the ranging error observed in such
class of receiver locations.
for DDP and NUDP classes enable the user to use the chan-
nelmodelsreportedinIEEEP802.15.3[10, 12, 15]forrang-
ing purposes, while larger ranging errors observed in SUDP
region prevent such model from being used for ranging pur-
poses.
5.2. Improvement over IEEE 802.15.3
recommended model
IEEE 802.15.3 is assumed, through (2), to be the basic dis-
crete model of the wireless channel in indoor environment.
From our observations, in DDP class, since the DP is eas-
ily detected, ranging error is at its minimum. Although it is
shown that DDP state multipath error exists [18], for UWB
systems the multipath error is in the order of few centimeters,
which is acceptable for cooperative localization and wireless
sensor networks. In NUDP class, we hypothesize that the first
cluster is detected. However, the power of DP is not within
the dynamic range of the receiver, which results in detecting
the second path (or any of the following paths after DP) as
the FDP. Therefore, the error should be approximated with
the ray arrival rate in the IEEE 802.15.3 model. It is reported
that the ray arrival rate is in the order of λ
= 2.1(1/nsec). By
detecting the following paths with the specified arrival rate,
an error of (1/λ
×10
−9
×c = 0.15) meters is expected, which
is in agreement with the average error observed in the NUDP
state and reported in Tab le 1 .
However, in the SUDP class, which is characterized by
extreme NLoS condition in IEEE 802.15.3, blockage of the
first cluster results in detecting a path from the next clus-
ter, and hence the receiver makes an unexpectedly large er-
ror. IEEE P802.15.3 model provides the cluster arrival rate of
Λ
= 0.0667(1/nsec); hence algorithm makes a ranging error
in the order of (1/Λ
× 10
−9
× c = 4.5) meters. The mean of
the GEV distribution is given by μ
− σ/k + σ/k × Γ(1 − k),
where Γ(x) represents the gamma function. Substituting the
reported parameters of SUDP ranging error yields an aver-
age of 4.31 meters, which on average is in agreement with the
assumption of loss of the first cluster. Based on this analysis,
we recommend that if IEEE 802.15.3 model is being used for
ToA-based ranging purposes in extreme NLoS conditions,
slight modifications are necessary for acquiring tangible esti-
mate of the ranging error observed in such conditions.
5.3. Markov model representation
The transition probabilities in Markov chain are analyti-
cally obtained using IDM realization, capturing the areas and
boundary lengths and consequently using (15). To validate
the analytical derivation of transition probabilities of Markov
chain, we consider a random walk process traveled by the mo-
bile user in the third floor scenario of the AK Labs at WPI, as
shown in Figure 1. In this random walk process, we calculate
the number of state transitions and compare them to the an-
alytical derivation in (15).
5.3.1. Parameters of the Markov chain
The generated 14000 CIRs for the different receiver locations
in the building were categorized into DDP, NUDP, SUDP,
and NC classes using (7). The random walk was designed in
a way to simulate a random mobile client traveling in indoor
environment. It is assumed that the mobile client travels on
the vertical or horizontal routes and continues its route un-
til next node, that is, door or hallway, and then it randomly
chooses the next node and travels towards it. This type of
M. Heidari and K. Pahlavan 11
movement results in crossing the borders of states whenever
mobile client is close to the boundary of two states, yielding
α
c
1. The separation of the movement at each time instant,
that is, 1 second, is 14.28 cm, resulting in vT
1/7. Further-
more, according to the IDM model, the parameters of the
floor plan are
l
12
= 17.07 (m), l
13
= 28.48 (m),
l
14
= 0(m), S
1
= 255.02 (m
2
),
l
21
= 17.07 (m), l
23
= 23.34 (m),
l
24
= 14.00 (m), S
2
= 217.51 (m
2
),
l
31
= 28.48 (m), l
32
= 23.34 (m),
l
34
= 16.70 (m), S
3
= 164.03 (m
2
),
l
41
= 0(m), l
42
= 14.00 (m),
l
43
= 16.70 (m), S
4
= 299.60 (m
2
),
(29)
which according to the analytical derivation of Section 4
forms a transition probability matrix of
P
=
⎡
⎢
⎢
⎢
⎢
⎣
0.9744 0.0095 0.0159 0
0.0112 0.9642 0.0153 0.0091
0.0248 0.0203 0.9403 0.0145
00.0066 0.0079 0.9853
⎤
⎥
⎥
⎥
⎥
⎦
. (30)
On the other hand, once the class of each receiver loca-
tion was identified, we generated 7000 CIRs associated with
the receiver locations of the random walk to empirically cal-
culate the transition probability matrix of the Markov model.
We repeated the steps for several different configurations of
random walk inside the building under study and averaged
the transition probabilities. The experiment yielded
P
=
⎡
⎢
⎢
⎢
⎢
⎣
0.9645 0.0085 0.027 0
0.0126 0.9501 0.0156 0.0217
0.0259 0.0179 0.9322 0.024
00.0108 0.0169 0.9723
⎤
⎥
⎥
⎥
⎥
⎦
, (31)
which, considering the fact that the type of movement im-
plies β
= α × vT 1/7, is very close to the analytical tran-
sition probability obtained from (15) and reported in (30).
The differences between the two matrices are mainly due to
the pattern of random walk, as it only considers moving along
hallwaysandinandoutofoffices. Note that
p
14
= p
41
= 0
in both matrices confirms the absence of the link between
DDP and NC classes. It is worth mentioning that altering the
parameters of the simulation such as η, α,andv results in
different transition probabilities.
For our second measure of validity of the Markov model,
we used state occupancy times. Finding the vector associated
with the exponential parameters of P, we can compare CDFs
of the width of staying times of different classes of receiver
locations. The corresponding waiting time vector is found to
be
υ
= [
39.19 27.98 16.75 68.31
], (32)
0 100 200 300 400 500 600 700 800
Width of staying in SUDP (s)
0
0.1
0.2
0.3
0.4
0.5
0.6
0.7
0.8
0.9
1
Cumulative probability
CDF comparison of width of staying in SUDP
RT simulation
Markov simulation
Exponential estimation
Figure 7: Comparison of width of staying in SUDP state for simu-
lation and modeling.
which yields the parameters of the exponential model of re-
siding in each state for DDP, NUDP, SUDP, and NC states,
respectively.
We simulated the exponential distributions and com-
pared them to the width of the staying times resulting from
RT simulation and width of staying times obtained from run-
ning the Markov chain. Figure 7 represents the CDF com-
parison of width of staying times in SUDP class of receiver
locations. It is worth mentioning that other Markov states
demonstrate similar close fits.
5.3.2. Ranging error statistics
As discussed in Section 4.2, empirical models using measure-
ment and RT have confirmed that ranging errors occurring
in DDP and NUDP states can be modeled with normal dis-
tribution whose moments are functions of the bandwidth of
the channel [18, 27]. However, in SUDP class of receiver loca-
tions, the distribution which fits the observed ranging error
is GEV. Tables 1 and 3 summarize the statistics of ranging er-
ror for different states of the presented Markov model for a
bandwidth of 5 GHz obtained from the analysis of CIRs of
the same 14000 receiver locations on the third floor of the
AK Labs.
Using the statistics of ranging error and the parameters
of the Markov model of Figure 3 provided by (15)enablesus
to simulate the dynamic behavior of ranging error observed
by the mobile user. In order to validate the effectiveness of
the Markov model, we initialized the Markov model with an
estimate of state probabilities obtained from MND model,
and ran the Markov process with the transition probabili-
ties reported in (30). According to the class of ranging er-
rors produced by Markov model, we simulated the ranging
error of each state by using parameters of Tables 1 and 3.
Figure 8 compares the CDF of total ranging error observed
12 EURASIP Journal on Advances in Signal Processing
−10 0 10 20 30 40 50
Ranging error (m)
0
0.1
0.2
0.3
0.4
0.5
0.6
0.7
0.8
0.9
1
Probability < abscissa
CDF comparison of total ranging error observed by
a mobile user in indoor environment
Experimental data
Markov simulation
Figure 8: Comparison of ranging error observed by a mobile user
with simulation.
by the mobile user traveling in indoor environment for em-
pirical data using simulation and analytical dynamic Markov
model. It is worth mentioning that comparisons of empirical
and simulated ranging errors observed in individual classes
also show close agreement.
5.4. Modeling and analysis of state probabilities
For the building under study, varying the location of the
transmitter and recording the state probabilities using IDM
realization yielded
µ = [
0.3662 0.4332 0.0747
],
Σ =
⎡
⎢
⎢
⎣
0.0081 −0.0015 0.004
−0.0015 0.0096 −0.0031
0.004
−0.0031 0.0018
⎤
⎥
⎥
⎦
.
(33)
Following the Cholesky decomposition method and re-
generating the state probabilities, we can approximate the pa-
rameters of the MND model and compare the MND model
with the result of simulation. Figure 9 illustrates the recon-
struction of the state probabilities with 100 iterations for the
main three states using MND model. The NC state can be
found deterministically using
P
NC
= 1 −P
DDP
−P
NUDP
−P
SUDP
. (34)
It can be observed that the MND model-generated state
probabilities closely follow IDM.
6. CONCLUSION
In this paper, we presented a novel application of Markov
chain for modeling the dynamic behavior of the ranging er-
ror in a typical indoor localization application which assists
00.10.20.30.40.50.60.70.8
probability
0
0.1
0.2
0.3
0.4
0.5
0.6
0.7
0.8
0.9
1
P (probability > abscissa)
Normal fit to state probabilities
DDP-simulation
NUDP-simulation
SUDP-simulation
NC-simulation
DDP-model
NUDP-model
SUDP-model
NC-model
Figure 9: Comparison of the CDF of the state probabilities for dif-
ferent states with their respective normal fit.
us in the design and performance evaluation of tracking ca-
pabilities of such systems. The parameters of the Markov
model and exponential waiting times were obtained from
analytical derivation based on real UWB measurement con-
ducted on the third floor of the AK Labs. The parameters of
distributions of ranging error observed in each Markov state
were extracted from empirical data obtained from 14000
channel impulse responses on the third floor of the AK Labs
at WPI. The results of simulation for the dynamic behavior of
ranging error using the Markov chain were shown to provide
close agreement with the results of empirical data.
ACKNOWLEDGMENTS
The material presented in this paper was partially prepared
during a joint project collaboration between Charles Stark
Draper Laboratory and CWINS at WPI. The authors would
like to thank Dr. Allen Levesque and Nayef A. Alsindi at WPI
for their constructive review and comments.
REFERENCES
[1] K. Pahlavan, X. Li, and J P. M
¨
akel
¨
a, “Indoor geolocation
science and technology,” IEEE Communications Magazine,
vol. 40, no. 2, pp. 112–118, 2002.
[2] A. H. Sayed, A. Tarighat, and N. Khajehnouri, “Network-based
wireless location: challenges faced in developing techniques
for accurate wireless location information,” IEEE Signal Pro-
cessing Magazine, vol. 22, no. 4, pp. 24–40, 2005.
[3] K. Pahlavan, P. Krishnamurthy, and J. Beneat, “Wideband
radio propagation modeling for indoor geolocation applica-
tions,” IEEE Communications Magazine,vol.36,no.4,pp.60–
65, 1998.
M. Heidari and K. Pahlavan 13
[4] K. Pahlavan, F. O. Akg
¨
ul, M. Heidari, A. Hatami, J. M. Elwell,
and R. D. Tingley, “Indoor geolocation in the absence of direct
path,” IEEE Wireless Communications, vol. 13, no. 6, pp. 50–58,
2006.
[5] A. Saleh and R. Valenzuela, “A statistical model for indoor
multipath propagation,” IEEE Journal on Selected Areas in
Communications, vol. 5, no. 2, pp. 128–137, 1987.
[6] T. S. Rappaport, S. Y. Seidel, and K. Takamizawa, “Statistical
channel impulse response models for factory and open plan
building radio communication system design,” IEEE Transac-
tions on Communications, vol. 39, no. 5, pp. 794–807, 1991.
[7] H. Hashemi, “The indoor radio propagation channel,” Pro-
ceedings of the IEEE, vol. 81, no. 7, pp. 943–968, 1993.
[8] H. Hashemi, “Impulse response modeling of indoor radio
propagation channels,” IEEE Journal on Selected Areas in Com-
munications, vol. 11, no. 7, pp. 967–978, 1993.
[9] B. Alavi, Distance measurement error modeling for time-of-
arrival based indoor geolocation, Ph.D. thesis, Worcester Poly-
technic Institute, Worcester, Mass, USA, 2006.
[10] A. F. Molisch, J. R. Foerster, and M. Pendergrass, “Channel
models for ultrawideband personal area networks,” IEEE Wire-
less Communications, vol. 10, no. 6, pp. 14–21, 2003.
[11] A. F. Molisch, D. Cassioli, C C Chong, et al., “A comprehen-
sive standardized model for ultrawideband propagation chan-
nels,” IEEE Transactions on Antennas and Propagation, vol. 54,
no. 11, pp. 3151–3166, 2006.
[12] D. Cassioli, M. Z. Win, and A. F. Molisch, “The ultra-wide
bandwidth indoor channel: from statistical model to simu-
lations,” IEEE Journal on Selected Areas in Communications,
vol. 20, no. 6, pp. 1247–1257, 2002.
[13] S. S. Ghassemzadeh, R. Jana, C. W. Rice, W. Turin, and V.
Tarokh, “Measurement and modeling of an ultra-wide band-
width indoor channel,” IEEE Transactions on Communications,
vol. 52, no. 10, pp. 1786–1796, 2004.
[14] S. S. Ghassemzadeh, L. J. Greenstein, T. Sveinsson, A. Kavcic,
and V. Tarokh, “UWB delay profile models for residential and
commercial indoor environments,” IEEE Transactions on Ve-
hicular Technolog y, vol. 54, no. 4, pp. 1235–1244, 2005.
[15] A. F. Molisch, “Ultrawideband propagation channels-theory,
measurement, and modeling,” IEEE Transactions on Vehicular
Technology, vol. 54, no. 5, pp. 1528–1545, 2005.
[16] C. Falsi, D. Dardari, L. Mucchi, and M. Z. Win, “Time of ar-
rival estimation for UWB localizers in realistic environments,”
EURASIP Journal on Applied Signal Processing, vol. 2006, Arti-
cle ID 32082, 13 pages, 2006.
[17] S. Gezici, Z. Tian, G. B. Giannakis, et al., “Localization via
ultra-wideband radios: a look at positioning aspects of future
sensor networks,” IEEE Signal Processing Magazine, vol. 22,
no. 4, pp. 70–84, 2005.
[18] B. Alavi and K. Pahlavan, “Modeling of the TOA-based dis-
tance measurement error using UWB indoor radio measure-
ments,” IEEE Communication Letter, vol. 10, no. 4, pp. 275–
277, 2006.
[19] B. Denis and N. Daniele, “NLOS ranging error mitigation in
a distributed positioning algorithm for indoor UWB Ad-hoc
Networks,” in IEEE International Workshop on Wireless Ad-Hoc
Networks (IWWAN ’05), pp. 356–360, London, UK, May-June
2005.
[20] J. L. Krolik and R. H. Anderson, “Maximum likelihood coor-
dinate registration for over-the-horizon radar,” IEEE Transac-
tions on Signal Processing, vol. 45, no. 4, pp. 945–959, 1997.
[21] A. M. Ladd, K. E. Berkis, A. P. Rudys, D. S. Wallach, and L. E.
Kavraki, “On the feasability of using wireless ethernet for in-
door localization,” IEEE Transactions on Robotics and Automa-
tion, vol. 20, no. 3, pp. 555–559, 2004.
[22] C. Morelli, M. Nicoli, V. Rampa, and U. Spagnolini, “Hidden
Markov models for radio localization in mixed LOS/NLOS
conditions,”
IEEE Transactions on Signal Processing, vol. 55,
no. 4, pp. 1525–1542, 2007.
[23] G. Yang, K. Pahlavan, and T. J. Holt, “Sector antenna and DFE
modems for high speed indoor radio communications,” IEEE
Transactions on Vehicular Technology, vol. 43, no. 4, pp. 925–
933, 1994.
[24] A. Falsafi, K. Pahlavan, and G. Yang, “Transmission techniques
for radio LAN’s—a comparative performance evaluation us-
ing ray tracing,” IEEE Journal on Selected Areas in Communi-
cations, vol. 14, no. 3, pp. 477–491, 1996.
[25] K. Pahlavan and A. H. Levesque, Wireless Information Net-
works, John Wiley & Sons, New York, NY, USA, 2nd edition,
2005.
[26] M. Heidari and K. Pahlavan, “A new statistical model for the
behavior of ranging errors in TOA-based indoor localization,”
in IEEE Wireless Communications and Networking Conference
(WCNC ’07), Las Vegas, Nev, USA, November 2007.
[27] M. Heidari and K. Pahlavan, “A model for dynamic behavior
of ranging errors in TOA-based indoor geolocation systems,”
in Proceedibgs of the 64th IEEE Vehicular Technology Conference
(VTC ’06), pp. 1–5, Montreal, QC, Canada, September 2006.
[28] I. Guvenc, C C. Chong, and F. Watanabe, “Joint TOA esti-
mation and localization technique for UWB sensor network
applications,” in Proceedings of the 65th IEEE Vehicular Tech-
nology Conference (VTC ’07), pp. 1574–1578, Dublin, Ireland,
April 2007.
[29] I. Guvenc and Z. Sahinoglu, “Threshold selection for UWB
TOA estimation based on kurtosis analysis,” IEEE Communi-
cations Letters, vol. 9, no. 12, pp. 1025–1027, 2005.
[30] J. Karedal, S. Wyne, P. Almers, F. Tufvesson, and A. F. Molisch,
“A measurement-based statistical model for industrial ultra-
wideband channels,” IEEE Transactions on Wireless Communi-
cations, vol. 6, no. 8, pp. 3028–3037, 2007.
[31] B. Alavi and K. Pahlavan, “Analysis of undetected direct path
in time of arrival based UWB indoor geolocation,” in Proceed-
ings of the 62nd IEEE Vehicular Technology Conference (VTC
’05), vol. 4, pp. 2627–2631, Dallas, Tex, USA, September 2005.
[32] N. Alsindi, X. Li, and K. Pahlavan, “Performance of TOA esti-
mation algorithms in different indoor multipath conditions,”
in Proceedings of IEEE Wireless Communications and Network-
ing Conference (WCNC ’04), vol. 1, pp. 495–500, Atlanta, Ga,
USA, March 2004.
[33] A. Leon-Garcia, Probablity and Random Processes for Electrical
Engineering, Addison Wesley, Boston, Mass, USA, 2nd edition,
1994.
[34] H. V. Poor and X. Wang, “Code-aided interference suppression
for DS/CDMA communications. Part II: parallel blind adap-
tive implementations,” IEEE Transactions on Communications,
vol. 45, no. 9, pp. 1112–1122, 1997.
[35] S. E. Bensley and B. Aazhang, “Maximum likelihood synchro-
nization of a single user for code-divistion multiple access
communication systems,” IEEE Transactions of Communica-
tions, vol. 46, no. 3, pp. 392–399, 1998.
[36] A. H. Sayed, Fundamentals of Adaptive Filtering, John Wiley ’
Sons, New York, NY, USA, 1st edition, 2003.
14 EURASIP Journal on Advances in Signal Processing
[37] Y H. Jo, J Y. Lee, D H. Ha, and S H. Kang, “Accuracy en-
hancement for UWB indoor positioning using ray tracing,”
in IEEE/ION Position, Location, And Navigation Symposium,
vol. 2006, pp. 565–568, San Diego, Calif, USA, April 2006.
[38] N. A. Alsindi, B. Alavi, and K. Pahlavan, “Spatial character-
istics of UWB TOA-based ranging in indoor multipath envi-
ronments,” in IEEE International Symposium on Personal In-
door and Mobile Radio Communications (PIMRC ’07),Athens,
Greece, September 2007.
[39] B. Alavi and K. Pahlavan, “Modeling of the distance error
for indoor geolocation,” in IEEE Wireless Communications and
Networking Conference (WCNC ’03), vol. 1, pp. 668–672, New
Orleans, La, USA, March 2003.
[40] N. A. Alsindi, B. Alavi, and K. Pahlavan, “Measurement and
modeling of UWB TOA-based ranging in indoor multipath
environments,” 2007, to appear in IEEE Transactions on Ve-
hicular Technolog y.
[41] S. Markose and A. Alentorn, “The generalized extreme value
(GEV) distribution, implied tail index and option pricing,”
Economics Discussion Papers 594, Department of Economics,
University of Essex, Essex, UK, April 2005, ec
.org/p/esx/essedp/594.html.
[42] K. P. Burnham and D. R. Anderson, Model Selection and Mul-
timodel Inference: A Practical Information-Theoretic Approach,
Springer, New York, NY, USA, 2nd edition, 2002.