Báo cáo hóa học: " Theory of Raman Scattering by Phonons in Germanium Nanostructures" pot
Bạn đang xem bản rút gọn của tài liệu. Xem và tải ngay bản đầy đủ của tài liệu tại đây (499.07 KB, 5 trang )
NANO EXPRESS
Theory of Raman Scattering by Phonons in Germanium
Nanostructures
Pedro Alfaro-Caldero
´
n Æ Miguel Cruz-Irisson Æ
Chumin Wang-Chen
Received: 24 September 2007 / Accepted: 5 December 2007 / Published online: 21 December 2007
Ó to the authors 2007
Abstract Within the linear response theory, a local bond-
polarization model based on the displacement–displace-
ment Green’s function and the Born potential including
central and non-central interatomic forces is used to
investigate the Raman response and the phonon band
structure of Ge nanostructures. In particular, a supercell
model is employed, in which along the [001] direction
empty-column pores and nanowires are constructed pre-
serving the crystalline Ge atomic structure. An advantage
of this model is the interconnection between Ge nano-
crystals in porous Ge and then, all the phonon states are
delocalized. The results of both porous Ge and nanowires
show a shift of the highest-energy Raman peak toward
lower frequencies with respect to the Raman response of
bulk crystalline Ge. This fact could be related to the con-
finement of phonons and is in good agreement with the
experimental data. Finally, a detailed discussion of the
dynamical matrix is given in the appendix section.
Keywords Raman scattering Á Phonons Á
Germanium nanostructures
Introduction
In comparison with silicon (Si) and III–V compounds,
germanium (Ge) has a larger dielectric constant and then is
particularly suitable for photonic crystal applications. Also,
one can incorporate Ge islands into Si-based solar cells for
more efficient light absorption. In general, the presence of
many arrays of quantum dots with lower bandgap than that
of the p–i–n solar cell structure in which they are embed-
ded can lead to an enhancement of the quantum efficiency
[1]. Recently, porous Ge (p-Ge) [2–4] and Ge nanowires
(GeNW) [5, 6] have been successfully produced and
Raman scattering is used to study the phonon behavior in
these materials. Although there are many reports about
porous Si and Si nanowires, only few investigations have
been carried out on Ge nanostructures. However, GeNW
hold some special interest in comparison to Si ones,
because Ge has, for example, a higher electron and hole
mobility than Si, which would be advantageous for high-
performance transistors with nanoscale gate lengths.
The reduction of crystallite sizes to nanometer scale can
drastically modify the electronic, phononic, and photonic
behaviors in semiconductors. Raman scattering, being
sensitive to the crystal potential fluctuations and local
atomic arrangement, is an excellent probe to study the
nanocrystallite effects. Moreover, Raman spectroscopy is
an accurate and non-destructive technique to investigate
the elementary excitations as well as the details of micro-
structures. For example, the line position and shape of
Raman spectra may give useful information of crystallinity,
amorphicity, and dimensions of nanoscale Ge.
In this article, we report a theoretical study of the Raman
response in Ge nanostructures by means of a local polari-
zation model of bonds, in which the displacement–
displacement Green’s function, the Born potential
P. Alfaro-Caldero
´
n Á M. Cruz-Irisson (&)
Instituto Polite
´
cnico Nacional, ESIME-Culhuacan,
Av. Santa Ana 1000, Mexico 04430, DF, Mexico
e-mail:
C. Wang-Chen
Instituto de Investigaciones en Materiales,
Universidad Nacional Auto
´
noma de Me
´
xico,
Apartado Postal 70-360, Mexico 04510, DF, Mexico
123
Nanoscale Res Lett (2008) 3:55–59
DOI 10.1007/s11671-007-9114-0
including central and non-central forces, and a supercell
model are used. This model has the advantage of being
simple and providing a direct relationship between the
microscopic structure and the Raman response.
Modeling Raman Scattering
Raman scattering analysis is a very powerful tool for
studying the composition, bonding, and microstructure of a
solid. However, the elementary excitation processes
involved are complicated to describe theoretically. In
general, the Raman response depends on the local polari-
zation of bonds due to the atomic motions. Considering the
model of the polarizability tensor developed by Alben
et al. [7], in which the local bond polarizabilities [a (j)] are
supposed to be linear with the atomic displacements u
l
(j),
i.e., c
l
(j) = qa(j)/qu
l
(j) alternates only in sign from site to
site in a single crystal with diamond structure, the Raman
response [R(x)] at zero temperature could be expressed
within the linear response theory as [8, 9].
R xðÞ/x Im
X
l; l
0
X
i; j
À1ðÞ
iÀj
G
l; l
0
i; j; xðÞ; ð1Þ
where l, l
0
= x, y,orz, i and j are the index of atoms, and
G
l, l
0
(i, j, x) is the displacement–displacement Green’s
function determined by the Dyson equation as
ðMx
2
I ÀUÞ GðxÞ¼I; ð2Þ
where M is the atomic mass of Ge, I stands for the identity
matrix, and U is the dynamical matrix, whose elements are
given by
U
ll
0
i; jðÞ¼
o
2
V
ij
ou
l
iðÞou
l
0
jðÞ
: ð3Þ
Within the Born model, the interaction potential (V
ij
)
between nearest-neighbor atoms i and j can be written as
[10].
V
ij
¼
a Àb
2
u iðÞÀu jðÞ½Á
^
n
ij
ÈÉ
2
þ
b
2
u iðÞÀu jðÞ½
2
; ð4Þ
where u(i) is the displacement of atom i with respect to its
equilibrium position, a and b are, respectively, central and
non-central restoring force constants. The unitary vector
^
n
ij
indicates the bond direction between atoms i and j. The
dynamical matrix within the Born model is described in
details in Appendix A.
Results
In order to determine the parameters of the Born model for
Ge, we have performed a calculation of the phonon band
structure for crystalline Ge (c-Ge) using a = 0.957 N cm
-1
and b = 0.244 N cm
-1
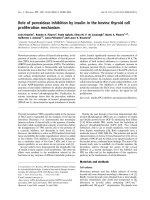
, and the results are shown in Fig. 1a.
Notice that the optical phonon bands are reasonably repro-
duced in comparison with the experimental data [11], since
these optical phonon modes are responsible for the Raman
scattering. It is worth mentioning that these parameter values
are very close to those used in a generalized Born model for
c-Ge [12]. The Raman response of c-Ge obtained from Eq. 1
is shown in Fig. 1b. Observe that the Raman peak is located
at x
0
= 300.16 cm
-1
[13, 14], which corresponds to the
highest-frequency of optical modes with phonon wave vec-
tor q = 0, since the q of the visible light is much smaller than
the first Brillouin zone and then the momentum conservation
law only allows the participation of vibrational modes
around the C point.
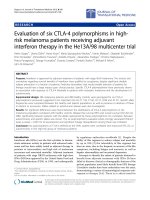
The p-Ge is modeled by means of the supercell tech-
nique, in which columns of Ge atoms are removed along
the [001] direction [15]. In Fig. 2, the highest-frequency
Raman shift (x
R
) is plotted as a function of the porosity for
square pores, increasing the size of supercells and main-
taining the thickness of two atomic layers in the skeleton.
The porosity is defined as the ratio of the removed Ge-atom
number over the original number of atoms in the supercell.
In Fig. 2, we have removed 18, 50, 98, 162, 242, and 338
atoms from supercells of 32, 70, 128, 200, 288, and 392
atoms, respectively. Observe that the results of x
R
are
close to 270 cm
-1
, instead of 300.16 cm
-1
for c-Ge, due to
the phonon confinement originated by extra nodes in the
wavefunctions at the boundaries of pores. However, this
confinement is only partial since the phonons still have
extended wave functions, and the Raman shifts in Fig. 2
are mainly determined by the degree of this partial
confinement. The inset of Fig. 2 illustrates the highest-
frequency Raman peak and the corresponding p-Ge struc-
ture with a porosity of 56.25%.
0
50
100
150
200
250
300
350
L Γ X
Energy (cm
-1
)
(a)
(b)
Raman Shift (cm
-1
)
Intensity (Arb. units)
Fig. 1 (a) Calculated phonon dispersion relations (solid line) com-
pared with experimental data (open circle). (b) Raman response of
c-Ge obtained from a primitive unitary cell, as illustrated in the inset
56 Nanoscale Res Lett (2008) 3:55–59
123
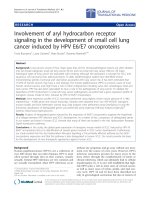
Another way to produce pores consists in removing
different number of atoms from a fix large supercell. In this
work, we start from a c-Ge supercell of 648 atoms formed
by joining 81 eight-atom cubic supercells in the x–y plane.
Columnar pores with rhombic cross-section are produced
by removing 4, 9, 25, 49, 81, 121, 169, 225, and 289 atoms,
as schematically illustrated in the upper inset of Fig. 3 for a
pore of 121 atoms. The results of x
R
are shown in Fig. 3 as
a function of porosity. In the lower inset of Fig. 3,we
present the variation of x
R
with respect to its crystalline
Raman peak x
0
, i.e., Dx : x
0
- x
R
, as a function of the
inverse of partial confinement distance between pore
boundaries (d) in a log–log plot. Observe that for the high-
porosity regime (small d) the slope tends to two, similar to
the electronic case [16].
For modeling GeNW, we start from a cubic supercell
with eight Ge atoms, and take the periodic boundary con-
dition along z-direction and free boundary conditions in x
and y directions. For GeNW with larger cross-sections, Ge
atomic layers are added in x and y directions to obtain
GeNW with different shapes of cross-section. We have
performed the calculation of the Raman response for
GeNW, whose supercells containing from 8 to 648 Ge
atoms. In Fig. 4, x
R
is plotted as a function of the length
(L) of cross-sections with square (open squares), rhombic
(open rhombus), and octagonal (open circles) forms. These
results are compared with experimental data (solid square)
obtained from Ref. [14], observing a good tendency
agreement. The inset shows Dx : x
0
- x
R
as a function
of 1/L. Observe that Dx $L
Àm
with m is 1.4–2.0 when
L ? 0. This result is in agreement with the effective mass
theory, i.e., 2L is the longest wavelength in x and y
directions accessible for a GeNW of width L, and then the
highest-phonon frequency of the system can be approxi-
mately determined by evaluating the frequency of optical
mode at p/L.
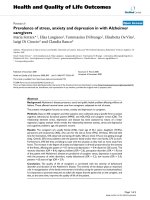
In Fig. 5, the calculated Raman response spectrum of a
GeNW with L = 2.11 nm is compared with the experi-
mental one [5]. The theoretical results include an
imaginary part of energy g = 13 cm
-1
, in order to take
into account the thermal and size distribution effects, and a
weight function proportional to exp(-|x - x
R
|/8). The
inclusion of this weight function is to preserve basic ideas
of the momentum selection rule, since in principle only
50 60 70 80 90
270
271
272
270 280 290 300
Raman Shift (cm
-1
)
Porosity (%)
Intensity (Arb. units)
Raman Shift (cm
-1
)
Fig. 2 Variation of Raman peaks as a function of porosity for the
square-pore case. Inset: The main Raman peak for p-Ge with a
porosity of 56.25%, which corresponds to a supercell of 32 Ge atoms,
removing 18 of them
299.0
299.2
299.4
299.6
299.8
300.0
300.2
0.2
0.1
1
Raman Shift (cm
-1
)
Porosity (%)
∆ω (cm
-1
)
1/d (nm
-1
)
0 101520253035404550
5
0.3
Fig. 3 The Raman shift as a function of the porosity for a fixed
supercell of 648 atoms. Inset: Dx = x
0
- x
R
versus the inverse of
partial confinement distance (d), which is illustrated in the upper inset
0
10 20
270
280
290
300
1
1
10
Raman Shift (cm
-1
)
L (nm)
∆ω (cm
-1
)
1/L (nm
-1
)
Fig. 4 For Ge nanowires, x
R
is plotted versus the length (L) of cross-
sections with square (open squares), rhombic (open rhombus), and
octagonal (open circles) form, in comparison to experimental data
(solid square) obtained from Ref. [14]. Inset: Dx = x
0
- x
R
as a
function of 1/L is shown in a log–log plot
Nanoscale Res Lett (2008) 3:55–59 57
123
C-point or infinite-wavelength optical modes are active
during the Raman scattering and for a GeNW there are only
finite-wavelength modes in x and y directions. In other
words, if the Raman selection rule is visualized as a
d-function at C-point, it should be broadened for finite-size
systems due to the Heisenberg uncertainty principle, i.e.,
optical modes with a longer wavelength should have a
larger participation in the Raman response.
Conclusions
We have presented a microscopic theory to model the
Raman scattering in Ge nanostructures. This theory has
the advantage of providing a direct relationship between
the microscopic structures and the measurable physical
quantities. For p-Ge, contrary to the crystallite approach,
the supercell model emphasizes the interconnection of the
system, which could be relevant for long-range correlated
phenomena, such as the Raman scattering. The results
show a clear phonon confinement effect on the values of
x
R
, and the variation Dx is in agreement with the effective
mass theory. In particular, the Raman response of GeNW is
in accordance with experimental data. Regarding to the
broadening of Raman peaks, an imaginary part of energy
g = 13.0 cm
-1
was chosen to include inhomogenous
diameters of GeNW, the influence of mechanical stress, as
well as laser heating effects [5, 14]. The obtained averaged
width L = 2.11 nm is smaller than D = 12.0 nm estimated
in Ref. [5]. This difference could be due to a possible
amorphous oxide layer surrounding the surface of GeNW.
This study can be extended to other nanostructured semi-
conductors such as nanotubes.
Acknowledgments This work was partially supported by projects
58938 from CONACyT, 2007045 from SIP-IPN, IN100305 and
IN114008 from PAPIIT-UNAM. The supercomputing facilities of
DGSCA-UNAM are fully acknowledged.
Appendix A
For tetrahedral structures, the positions of four nearest-
neighbor atoms around a central atom located at (0,0,0) are
R
~
1
¼ 1; 1; 1ðÞa=4, R
~
2
¼À1; À1; 1ðÞa=4, R
~
3
¼À1; 1; À1ðÞ
a=4, and R
~
4
¼ 1; À1; À1ðÞa=4, where a = 5.65 A
˚
.
From Eq. 3 in ‘‘Modeling Raman Scattering’’, the
interaction potential between central atom 0 and atom 1 is
V
0; 1
¼
a Àb
2
uð0ÞÀuð1Þ½Á
^
r
0; 1
ÈÉ
2
þ
b
2
uð0ÞÀuð1Þ½
2
ðA:1Þ
where
^
r
0; 1
¼
1
ffiffi
3
p
1; 1; 1ðÞand then, the element xx of the
first interaction matrix is given by
/
xx
ð0; 1Þ¼
o
2
V
0; 1
ou
x
ð0Þ ou
x
ð1Þ
¼À
1
3
a þ2bðÞ: ðA:2Þ
In a similar way, one can obtain other elements of the
matrix. Therefore, the four interaction matrices /
i
,
bounding the central atom to its nearest-neighbor atom i,
can be written as
/
1
/ð0; 1Þ¼À
1
3
a þ2baÀbaÀ b
a Àbaþ 2baÀ b
a ÀbaÀ baþ 2b
0
@
1
A
;
ðA:3Þ
200 220 240 260 280 300 320 340 360
Intensity (Arb. units)
Raman Shift (cm
-1
)
Fig. 5 Raman response of a GeNW with L = 2.11 nm (solid line)
compared with experimental data (open circles) from Ref. [5]
Fig. A1 The positions of four tetrahedral nearest neighbors around a
central atom
58 Nanoscale Res Lett (2008) 3:55–59
123
/
2
/ð0; 2Þ¼À
1
3
a þ2baÀbbÀ a
a Àbaþ 2bbÀ a
b ÀabÀ aaþ 2b
0
@
1
A
;
ðA:4Þ
/
3
/ð0; 3Þ¼À
1
3
a þ2bbÀaaÀ b
b Àaaþ 2bbÀ a
a ÀbbÀ aaþ 2b
0
@
1
A
;
ðA:5Þ
and
/
4
/ð0; 4Þ¼À
1
3
a þ2bbÀabÀ a
b Àaaþ 2baÀ b
b ÀaaÀ baþ 2b
0
@
1
A
:
ðA:6Þ
These four interaction matrices /
1
, /
2
, /
3
, and /
4
are
indicated in the inset of Fig. 1b. Due to the tetrahedral
symmetry it is easy to prove that
/
s
¼ /
1
þ /
2
þ /
3
þ /
4
¼À
4
3
a ÀbðÞI: ðA:7Þ
where I is the identity matrix.
Within the supercell model, the equilibrium positions
of atoms i and j can be, respectively, written as l
~
þ b
~
and l
0
~
þ b
0
~
, being l
~
, l
0
~
the coordinates of unit cell and b
~
,
b
0
~
the positions inside the cell. For an eight-atom
supercell, the Fourier transform of U can be written as
D
ll
0
ðb
~
b
0
~
jq
~
Þ¼
X
l;l
0
U
ll
0
ðl
~
b
~
;l
0
~
b
0
~
Þe
iq
~
Áðl
~
Àl
0
~
Þ
¼
/
s
0 F
4
/
4
F
2
/
2
F
3
/
3
0 F
1
/
1
0
0 /
s
F
1
/
1
F
3
/
3
F
2
/
2
0 F
4
/
4
0
F
Ã
4
/
4
F
Ã
1
/
1
/
s
00F
Ã
2
/
2
0 F
Ã
3
/
3
F
Ã
2
/
2
F
Ã
3
/
3
0 /
s
0 F
Ã
4
/
4
0 F
Ã
1
/
1
F
Ã
3
/
3
F
Ã
2
/
2
00/
s
F
Ã
1
/
1
0 F
Ã
4
/
4
00F
2
/
2
F
4
/
4
F
1
/
1
/
s
F
3
/
3
0
F
Ã
1
/
1
F
Ã
4
/
4
000F
Ã
3
/
3
/
s
F
Ã
2
/
2
00F
3
/
3
F
1
/
1
F
4
/
4
0 F
2
/
2
/
s
0
B
B
B
B
B
B
B
B
B
B
B
B
B
@
1
C
C
C
C
C
C
C
C
C
C
C
C
C
A
;
ðA:8Þ
where the changes of phase related to the phonon wave
vector (q
~
) are given by F
1
¼e
iq~ÁR
~
1
, F
2
¼e
iq~ÁR
~
2
, F
3
¼e
iq~ÁR
~
3
,
and F
4
¼e
iq
~
ÁR
~
4
. Hence, Eq. 2 can be rewritten as
Mx
2
I ÀDðq
~
Þ
ÂÃ
G x; q
~
ðÞ¼I: ðA:9Þ
It is worth to mention that Eq. (A.9) has an associate
eigenvalue equation, which leads to the phonon band
structure shown in Fig. 1a. Furthermore, the dimension of
matrixes involved in Eq. (A.9)is3N, N being the number
of atoms in the supercell.
References
1. J. Konle, H. Presting, H. Kibbel, Physica E 16, 596 (2003)
2. C. Fang, H. Fo
¨
ll, J. Carstensen, J. Electroanal. Chem. 589, 258
(2006)
3. D. Sun, A.E. Riley, A.J. Cadby, E.K. Richman, S.D. Korlann,
S.H. Tolbert, Nature 441, 1126 (2006)
4. G.S. Armatas, M.G. Kanatzidis, Nature 441, 1122 (2006)
5. R. Jalilian, G.U. Sumanasekera, H. Chandrasekharan,
M.K. Sunkara, Phys. Rev. B 74, 155421 (2006)
6. C. Fang, H. Fo
¨
ll, J. Carstensen, Nano Lett. 6, 1578 (2006)
7. R. Alben, D. Weaire, J.E. Smith, M.H. Brodsky, Phys. Rev. B 11,
2275 (1975)
8. R.J. Elliott, J.A. Krumhansl, P.L. Leath, Rev. Mod. Phys. 46, 465
(1974)
9. C. Wang, R.A. Barrio, Phys. Rev. Lett. 61, 191 (1988)
10. G.P. Srivastava, The Physics of Phonons (Bristol, Adam Hilger,
1990)
11. G. Nilsson, G. Nelin, Phys. Rev. B 3, 364 (1971)
12. G. Bose, B.B. Tripathi, H.C. Gupta, J. Phys. Chem. Solids 34,
1867 (1973)
13. E. Finlayson, A. Amezcua-Correa, P.J.A. Sazio, N.F. Baril,
J.V. Badding, Appl. Phys. Lett. 90, 132110 (2007)
14. X. Wang, A. Shakouri, B. Yu, X. Sun, M. Meyyappan, J. Appl.
Phys. 102, 014304 (2007)
15. P. Alfaro, M. Cruz, C. Wang, IEEE Trans. Nanotech 5, 466
(2006)
16. M. Cruz, C. Wang, M.R. Beltra
´
n, J. Tagu
¨
en
˜
a-Martı
´
nez, Phys.
Rev. B 53, 3827 (1996)
Nanoscale Res Lett (2008) 3:55–59 59
123