Báo cáo nghiên cứu khoa học " Development of an Improved Capability in support of National Bio-security for the Surveillance and Control of Foot & Mouth Disease in Cattle and Pigs - Milestone 6 " ppt
Bạn đang xem bản rút gọn của tài liệu. Xem và tải ngay bản đầy đủ của tài liệu tại đây (250.7 KB, 44 trang )
1
Ministry of Agriculture & Rural Development
CARD Project Technical Report
Development of an Improved Capability in support of
National Bio-security for the Surveillance and Control of
Foot & Mouth Disease in Cattle and Pigs
Milestone 6
Epidemiological and sero-surveillance programs operational
By
Debbie Eagles & Chris Morrissy
1
Table of Contents
1. Institute Information ___________________________________________________ 1
2. Project Abstract_________________________________________________________ 3
3. Executive Summary ____________________________________________________ 3
4. Introduction & Background _____________________________________________ 4
5. Epidemiological and Sero-surveillance programs ____________________________ 4
5.1 Implementation Highlights ________________________________________________ 4
5.2 Capacity Building _______________________________________________________ 36
5.3 Publicity_______________________________________________________________ 36
6. Implementation & Sustainability Issues ___________________________________ 37
6.1 Issues and Constraints ___________________________________________________ 37
6.2 Options________________________________________________________________ 37
6.3 Sustainability___________________________________________________________ 37
7. Next Critical Steps ____________________________________________________ 38
8. Conclusion __________________________________________________________ 39
1
1. Institute Information
Project Name
Vietnamese Institution
Regional Animal Health Centre, Ho
Chi Minh City (RAHO - 6 ), South
Vietnam.
Vietnamese Project Team Leader
Dr. Dong Manh Hoa
Australian Organisation
Australian Animal Health Laboratory
(AAHL), PMB 24, Geelong, 3213,
Australia
Australian Personnel
Mr Chris Morrissy
Date commenced
01/06/2005
Completion date (original)
01/06/2008
Completion date (revised)
Reporting period
Contact Officer(s)
In Australia: Team Leader
Name:
Mr Chris Morrissy
Telephone:
+61 3 5227 5000
Position:
Diagnostic Virologist
Supervisor Mammalian Virology
Fax:
+61 3 5227 5555
Organisation
Australian Animal Health
Laboratory (AAHL), PMB 24,
Geelong, 3213,
Australia
Email:
In Australia: Administrative contact
Name:
Mr Chris Morrissy
Telephone:
+61 3 5227 5000
Position:
Patents Contracts Officer
Fax:
+61 3 5227 5555
Organisation
Australian Animal Health
Laboratory (AAHL), PMB
24, Geelong, 3213,
Australia
Email:
In Vietnam
Name:
Dr. Dong Manh Hoa
Telephone:
+ 84 8 8568220
Position:
Director
Fax:
+ 84 8 8569050
Organisation
Regional Animal Health Centre,
Ho Chi Minh City (RAHO - 6 ),
South Vietnam.
Email:
2
2. Project Abstract
The project’s purpose was twofold - to develop capacity for FMD (and other disease)
surveillance and diagnosis at both a laboratory and field level, and to investigate the
serotypes of FMDV circulating in Vietnam and the reason for vaccine failures. Regional
laboratories were set up with the reagents and methods to allow a diagnostic capability for
FMDV diagnosis and serology. Control strategies for understanding of FMD epidemiology
have been implemented through veterinary and laboratory training workshops. The project
has highlighted the importance of having a laboratory network to identify what is happening
in the field and how to prevent and control disease outbreaks. The pilot zones were
established in provinces near the borders of Vietnam to study serotypes circulating in
Vietnam and to determine their origin. The number and quality of samples increased with
each round of the project giving more data on the FMD situation in Vietnam. Virus isolation
and molecular studies can now be carried out on FMD samples from the field and molecular
epidemiological studies of the FMDV isolates in these provinces has provided insights into
the effectiveness of border control and origin of circulating FMDV. Improved diagnostic
capacity for FMD allows for the early detection and identification of disease enabling better
control of disease and helps reduce loss of livestock and therefore increases productivity.
3. Executive Summary
The CARD FMD project was ambitious in that it had 2 very broad and diverse aims. The first
objective was capacity building – at the laboratory, epidemiological and field levels. The
second major aim was to investigate possible causes of vaccination failure by evaluating
isolates of circulating strains and sero-surveillance data.
The project was very successful at achieving its objective in relation to capacity building. As
documented in the final report, the four collaborating Vietnamese laboratories improved their
FMD diagnostic capacity and have been able to apply their new skills to disease
investigations and surveillance projects.
In addition, there have been important and measurable improvements in both epidemiological
and field areas. When this project began there was no epidemiology department at any of the
laboratories. There is now a fully functional epidemiology department, with 3 full-time staff,
at RAHO – 6. This group has been instrumental in supporting this and other international
projects and has provided advice and training to field and provincial veterinarians. They have
also been crucial to investigation of disease outbreaks such as HPAI and PRRS, particularly
in southern Vietnam.
Through implementation of this project one of the lessons learnt has been the importance of
complete and accurate field information. Whereas the laboratories were already accustomed
to recording results, the recording of information such as vaccination and infection data in
the field was not commonplace. Data collection and management has improved dramatically
throughout the project. The only downside of this is that data quantity and quality for the
initial rounds is difficult to analyze for the purpose of investigation of vaccine failure. In
addition to this the accuracy of some of the data is questionable, as is discussed throughout
this report.
3
With the laboratory and epidemiological capacity now available in the collaborating
laboratories, particularly HCMC, there is now the potential for a smaller, more focused study
on vaccination failure. This would be best limited to a smaller number of provinces in
southern Vietnam, with a study protocol aimed specifically at investigating vaccination
effectiveness.
4. Introduction & Background
Serum samples and information were initially to be collected from 10 provinces – An Giang,
Binh Phuoc, Dong Thap, Kien Giang, Kom Tum, Lang Son, Long An, Quang Nam, Quang
Ninh and Tay Ninh. No samples were ever collected from Lang Son. Samples were also only
collected intermittently from the other northern province in the project, Quang Ninh. The
central provinces of Kom Tum and Quang Nam provided samples for all but the 3
rd
round.
In the southern provinces samples were not available from Long An in the final round and
An Giang did not provide pig samples in round 1, 5 or 6. The epidemiological support and
interest at RAHO - 6 is almost certainly a contributing factor to the better provision of
samples from the southern provinces. A combination of fewer specialized staff in the
northern provinces and laboratories and the required allocation of resources to outbreak
response is likely to have reduced their ability to collect samples. NCVD did not have a
epidemiology section.
In 2005, the field data collection and the use of forms was not well developed. As a result,
for most provinces the only information collected was species, sampling location
(district/commune/village) and in some instances vaccination information, sampling date and
animal age.
In 2006 the data collection form was further developed and standardised with the following
fields – district, commune, village, species, age, sex, sampling date, vaccination date, vaccine
name/manufacturer/serotypes, last date of infection, last serotype of infection and field
sample number. This form improved data collection dramatically although not all fields were
completed in every round for each province.
5. Epidemiological and Sero-surveillance programs
5.1 Implementation Highlights
Analysis by Province
The analysis for the information in each province is divided into cattle and pigs. For each
species there are tabular results and a graph followed by a description of the results for each
round. The graph only displays information for rounds and serotypes for which animals have
been vaccinated ≤ 6 months prior to sampling.
4
An Giang
Cattle
Year
(Round)
Vaccination %
3ABC
+
% O
ELISA
+
% A
ELISA
+
%
Asia
1 +
Previous
Infection date in
province
(species,
serotype)
Comment
Type Vaccination-
sampling
interval
August 2005
(pigs, O)
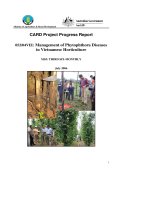
2008 (6) O,A 2mths 36 89 100 51 August 2005
(pigs, O)
2008 (5) O,A 5mths 10 10 22 9 August 2005
(pigs, O)
2007 (4) O,A 1mth 21 61 58 0 August 2005
(pigs, O)
2007 (3) O,A 6-7mth 37 66 47 31 August 2005
(pigs, O)
Higher proportion
Asia 1 +ves
amongst 3ABC+
group
2006
(2)
O,A 6mth 38 19 56 34 August 2005
(pigs, O)
Proportions across
the 3ABC-
/3ABC+ similar
2005
(1)
O,A Unknown 76 63 70 56 August 2005
(pigs, O)
Unknown history
of infection
0
10
20
30
40
50
60
70
80
90
100
Percentage
123456
Round
Percent cattle O/A positive when vaccinated for that serotype
O
A
2005 (Round 1)
Without vaccination or infection information available no judgment can be made on
vaccination response. 75% cattle were NSP ELISA positive, and more than half of these are
positive for all 3 serotypes. This suggests that these cattle have been vaccinated with either a
5
bivalent or trivalent vaccine, given that infection with more than one serotype simultaneously
is rare. Further testing of the sera is necessary to determine the serotypes present, ie titration
of the sera to a endpoint against each sera type.
There was a reported outbreak of serotype O infection in pigs in 2005.
2006 (Round 2)
All cattle were vaccinated for serotypes O/A, 6months prior to sampling. The greatest
serological response was to serotype A at 50%. It is likely that there was a problem with the
sensitivity of the O ELISA for this batch of samples, as it would be unlikely for animals to
have been vaccinated for serotype A and not serotype O. It is almost certain that some
animals were also vaccinated for Asia 1, given the serological response to this serotype,
absence of outbreak history and the negative 3ABC result in the majority of those that were
Asia 1 positive.
2007 (Round 3)
Vaccination was 6 months prior to sampling with O/A vaccine. Despite lack of infection
history, 37% were 3ABC ELISA positive. In general the serological response to serotype O
was better than in the previous round which may be more indicative of changes to the assay
as opposed to differences in vaccine response.
Close to a third of cattle were also positive on the Asia 1 ELISA and of these 2/3 were also
3ABC positive. This is suggestive of both unrecorded vaccination and/or unreported
infection (which may be related to animal movement).
2007 (Round 4)
Vaccination occurred one month prior to sampling with an approximately 60% response rate
to both serotype O and A (bivalent vaccine administered). A smaller % were positive on the
3ABC ELISA in this round than in round 3.
2008 (Round 5)
The serological response to the O/A vaccine is very poor, regardless of the 5 month interval
between vaccination and sampling. Following the protocol listed below in Appendix 1
(Investigating Vaccination Failure Checklist) may assist in determining the reasons for
vaccine failure. Records suggest that the same vaccine was used in each round.
2008 (Round 6)
There was an excellent serological response to vaccine in this round, in which the
vaccination-sampling interval was 1 month. Over 50% of cattle also seroconverted to Asia 1
despite no history of recent vaccination for this serotype. Half of these were also 3ABC
positive, despite no infection history in the sampled animals or the province (see below).
6
Conclusions
The % of cattle 3ABC was > 1/3 in 4 of the 6 rounds. In the absence of outbreak history or
isolates from this province since 2005 this suggests that:
There has been movement (transboundary or between provinces) of infected (diseased
or carrier) animals
There have been unreported or undetected (due to mild clinical signs) infections in
the surveyed communes.
There is a large number of animals previously exposed to FMD or carriers that remain
– at least intermittently – NSP ELISA positive.
Some variation in the results between years may also be due to the inclusion of 4 communes
(An Phu, Tinh Bien, An Nong and Nhon Hung) which were variably sampled in the different
rounds.
Vaccination response was only – in the final around - above the required herd protected level
of 80%.
Pigs
Year Vaccination %
3ABC
+
% O
ELISA
+
% A
ELISA
+
%
Asia
1 +
Previous Infection
date in province
(species,
serotype)
Comment
Type Vaccination-
sampling
interval
2008
(6)
No samples
2008
(5)
No samples
2007
(4)
O 1mth 0 5 0 0 August 2005
(pigs, O)
2007
(3)
O 6mths 0 5 0 0 August 2005
(pigs, O)
2006
(2)
O 6 mths 0 0 0 0 August 2005
(pigs, O)
2005
(1)
No samples
7
0
10
20
30
40
50
60
70
80
90
100
Percent
234
Round
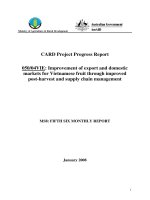
Percent pigs O/A positive when vaccinated for that serotype
O
Samples were collected from vaccinated pigs in 2006 and both rounds of 2007. The highest
serological response for serotype O was 5% despite the fact that on one occasion vaccination
was administered just one month prior to sampling. In rounds 2 and 3 all sampled piglets
were >6 months. In the remaining rounds some piglets were as young as 2.5 months, so
could not have been vaccinated on the date recorded.
Binh Phuoc
Cattle
Year Vaccination %
3ABC
+
% O
ELISA
+
% A
ELISA
+
%
Asia
1 +
Previous
Infection date in
province
(species,
serotype)
Comment
Type Vaccination-
sampling
interval
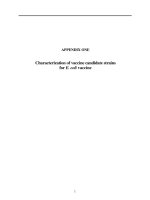
2008 (6) O,A,Asia1 1mth 24 94 93 93 2006 (Cattle,
pig; O)
Last infection
Aug 05
2008 (5) O,A,Asia1 5 mths 28 34 51 18 2006 (Cattle,
pig; O)
½ that have
been infected
are Asia +
2007 (4) O, A 1 mth 14 89 88 38 2006 (Cattle,
pig; O)
2007 (3) O,A 5-6mths 9 41 81 55 2006 (Cattle,
pig; O)
2006 (2) O,A,Asia1 9 mths 11 50 35 35 2006 (Cattle,
pig; O)
Previous
infection
(O/A?)
2005 (1) O, A 4 mths 10 20 5 24 April, Aug, Oct
2005 (Cattle,
O/A; pigs, O)
8
0
10
20
30
40
50
60
70
80
90
100
Percentage
13456
Round
Percent of cattle O/A/Asia1 positive when vaccinated for that
serotype
O
A
Asia1
2005 (Round 1)
There is little field information available for this year, as the forms for information collection
had not been developed. Cattle were vaccinated 6 months prior to the sampling date with
O/A vaccine, which is just at the extent of the expected vaccination protective period. The
vaccination response rate in this year was very poor (20% positive for serotype O and 5%
positive for serotype A), however it is difficult to pass judgment on first year results from
either field or laboratory perspective.
2006 (Round 2)
In this year the recorded information shows that vaccination was with a serotype A vaccine
called Trivale. However discussions at sub-DAH confirm that, as the vaccine name would
suggest, this is more likely a trivalent vaccine. The manufacturer is unknown. The
vaccination date was 9 months prior to sampling date, so it is not surprising that the
seropositives were relatively low at 50%, 35% and 35% for serotypes O, A and Asia 1
respectively.
2007 (Round 3)
In this year records suggest that all cattle were vaccinated with serotypes O/A vaccine. Sub-
DAH staff again suggested that cattle may have been vaccinated for Asia1. This would fit the
ELISA results, with 41%, 81% and 55% positive for O, A and Asia1 serotypes respectively.
The vaccine was administered 5 months prior to sampling, which may contribute to the
variation in % positive for each serotype.
9
2007 (Round 4)
In this year cattle were vaccinated with serotype O/A vaccine one month prior to sampling.
The seropositivity for both these serotypes was around 90% suggesting excellent vaccination
response. 38% of cattle were also positive to serotype Asia1 (see round 3). A relatively small
% of animals were 3ABC positive.
2008 (Round 5)
In this year cattle were vaccinated with a trivalent vaccine. The seropositives were 34%, 51%
and 18% again for O, A, and Asia 1 serotypes respectively. The vaccine was administered 5
months prior to sampling, which may partly account for the lower seropositivity than seen in
rounds 4 and 6. However, this time interval is still within the expected protective period of
the vaccine. Staff at Sub-DAH suggest that of the cattle presented for vaccination
approximately 70% are re-presented for sampling, the remaining 30% may be different
animals. Although all cattle in the district should have been vaccinated at the same time,
some of the animals presented for sampling may be new to the province and possibly
unvaccinated.
One quarter of cattle sampled were positive for 3ABC ELISA suggesting previous infection.
Most of these were positive for all 3 serotypes, and as vaccination in this year was also for all
3 serotypes it is not possible to determine the serotype of infection. Titration of positive
samples may have assisted, in there was clearly a 4-fold difference in titrations between one
serotype and the remaining 2 serotypes.
2008 (Round 6)
There was an excellent response to the O/A/Asia 1 vaccine (Aftopor) used in this round with
90% or more seropositivity for all serotypes. As per the first round in 2008, one quarter of
the cattle were also 3 ABC positive, indicating previous infection.
Conclusions (cattle):
Vaccination response rates for cattle in Binh Phouc were generally very good and, with the
exception of round 5, improved throughout the project. As expected, the proportion of
vaccinated animals seropositive was much higher in those sampled 1 month after
vaccination, as opposed to those vaccinated 5 months previously. However, this is a concern
as vaccination is meant to be protective for 6 months.
Trans-boundary movement and movement of animal between provinces may also have
contributed to some of the variation in results, particularly if these animals have previously
been infected, and not recently vaccinated. Interestingly, there was a spike in % positive on
3ABC ELISA in the 5
th
round despite no history of vaccination since 2006. This is the same
round in which there was poor vaccination response, suggesting a possible influx of
unvaccinated, previously infected animals to the district.
10
Pigs
Year Vaccination %
3ABC
+
% O
ELISA
+
% A
ELISA
+
%
Asia
1 +
Previous Infection
date in province
(species, serotype)
Comment
Type Vaccination-
sampling
interval
2008
(6)
O 1mth 0 0 0 0 2006 (Cattle, pig;
O)
Most piglets
2-3 mths
2008
(5)
None None 14 0 0 0 2006 (Cattle, pig;
O)
2007
(4)
O 1mth 0 0 0 0 2006 (Cattle, pig;
O)
Age
unknown
2007
(3)
O 1mth 0 0 0 0 2006 (Cattle, pig;
O)
Age
unknown
2006
(2)
None None 0 17.5 0 0 2006 (Cattle, pig;
O)
2005
(1)
None None 0 0 0 0 April, Aug, Oct
2005 (Cattle, O/A;
pigs, O)
2005 (Round 1)
There is no vaccination record for pigs in this year and no positives on any of the ELISAs.
2006 (Round 2)
There is no history of vaccination in pigs in 2006, although a small % were serotype O
positive but 3ABC negative suggesting previous vaccination, not infection.
2007 (Round 3)
The records for the pigs suggest that all were vaccinated with a serotype O vaccine.
However, there are no pigs positive on the O ELISA. Discussions with Sub-DAH have
revealed that is very uncommon for the same pig to be presented for both vaccination and
sampling – that commonly sows and boars are vaccinated, but piglets were presented for
sampling. This would explain the non-existent vaccine response. Ages for the sampled
piglets were not recorded in this year to confirm this theory. The O ELISA is also known to
have lower sensitivity in pigs than in cattle.
11
2007 (Round 4)
As for round 3, the results in pigs do not match the vaccination history with no seropositive
pigs despite serotype O vaccination 1 month prior to sampling. There may be a number of
reasons for this, including specifics of the ELISA assay, sampling after only one vaccine
(rather than the initial two required for complete vaccine response) or the vaccinating and
sampling of 2 different groups of pigs. Again age records have not been kept for these pigs.
2008 (Round 5)
Pigs were not vaccinated for this round as there was not sufficient vaccine available.
2008 (Round 6)
As with other rounds the results for pigs do not correlate with vaccination history. Further
investigation and vaccine trials would be required to determine if the apparent vaccination
failure. This also highlights the need to be absolutely certain that those piglets presented for
sampling were definitely vaccinated in this round also. As piglets presented for sampling in
this round were only 2-3 months old they are likely to have only had one vaccine, if any.
Conclusions (pigs)
In pigs field and laboratory information did not concur. Further investigations and trials
would be necessary to determine the issues but it is likely a major contributing factor is the
presentation of different pigs for vaccination and sampling, or sampling after just one
vaccination.
12
Dong Thap
Cattle
Year Vaccination %
3ABC
+
% O
ELISA
+
% A
ELISA
+
%
Asia 1
+
Previous
Infection date
in province
(species,
serotype)
Comment
Type Vaccination-
sampling
interval
2008 (6) O,A
O, A, Asia
1
1-3mth
4mth
24
20
61
60
70
90
5
10
September
2008 (pig, O)
2008 (5) Unknown
None
1mth
None
10
26
80
68
90
57
60
25
2007 (4) O,A,Asia1
None
1-3mth 25
39
44
52
51
63
29
34
January 2007
(pig, O)
2007 (3) O,A,Asia 1
O,A,Asia1
O,A
6mth
2-3mth
3mth
59
67
80
48
87
85
31
88
95
17
67
75
4 of the O/A
have history
of infection
2004 (O)
2006 (2) O
O
O
O,A,Asia1
O,A,Asia1
None
None
<6mths + I (O)
<6mths
>6mths
1mth + I (O)
1mth
+ I
100
0
17
0
0
4
38
100
25
30
44
75
46
62
100
38
67
44
25
42
55
57
25
67
44
75
40
38
2006 (pig, O)
2005 (1) None 40 43 23 24 June-August
2005 (pig, O)
January 2004
(pig, O)
0
10
20
30
40
50
60
70
80
Percentage
123456
Round
Percent cattle positive when vaccinated for serotype
O
A
Asia1
13
2005 (Round 1)
There was no vaccination history for this round. 40% show indication of previous infection.
Outbreaks of FMD in pigs were reported in 2004 and 2005 but no infection in cattle is
recorded.
2006 (Round 2)
The large variation in vaccination history and the resultant small group size for each category
make this information difficult to analyse. In general, the vaccine response appears to be
reasonable.
2007 (Round 3)
In this round cattle were vaccinated with trivalent vaccine 2, 3 or 6 months prior to sampling
or O/A vaccine 3 months prior to sampling. The graph below compares the % cattle with
antibodies to all 3 serotypes (and 3ABC) based on vaccination-sampling interval for those
vaccinated with trivalent vaccines. This clearly shows the drop over time of protective
antibodies.
A large proportion of cattle reportedly only vaccinated with a bivalent vaccine were also
positive on the Asia 1 assay.
0
20
40
60
80
100
%
3ABC O A Asia 1
Elisa type
% Cattle positive by O/A/Asia 1 Elisa in relation to
vaccination-sampling interval
6mths
2-3mths
2007 (Round 4)
About ½ the cattle in this round were vaccinated with a trivalent vaccine, and there is no
record of vaccination for the remaining cattle. Interestingly the % positive for each of the 3
LP ELISAs was greater in the unvaccinated group as opposed to the vaccinated. Overall the
vaccine response in the vaccinated group was poor, given the short vaccination-sampling
interval (1-3 months).
14
2008 (Round 5)
In this round the vaccine type was unknown but likely to be either bivalent or trivalent, given
the high seropositivity on all 3 ELISAs (80%, 90% and 60% for O, A and Asia 1
respectively).
2008 (Round 6)
Most of the cattle were vaccinated with bivalent (O/A) vaccine in this round, 1-3 months
prior to sampling. There were also 9 cows that reportedly received trivalent vaccine, yet there
was a very low proportion of cattle seropositive on the Asia1 ELISA from this group,
suggesting that they perhaps received a bivalent vaccine also. It is possible that the O ELISA
has a lower sensitivity than the A ELISA, as evidenced by the lower % positives when
vaccinated against both serotypes.
Conclusions
Dong Thap provided excellent vaccination history – it appears that vaccination history was
recorded separately for each animal sampled as opposed to a generic vaccination history for
all animals. Despite this, vaccine responses were still variable but best in the final round.
Dong Thap experienced a number of outbreaks of FMD (both O & A serotype) during the
project period and this, along with their commitment to data collection, would make this
province ideal for any further studies.
Pigs
Year Vaccination %
3ABC
+
% O
ELISA
+
% A
ELISA
+
%
Asia 1
+
Previous Infection
date in province
(species, serotype)
Comment
Type Vaccination-
sampling
interval
2008 (6) O 1mth 2 8 7 5 September 2008
(pig, O)
2008 (5) None NA 0 0 4 0
2007 (4) O
None
1-2 mths
NA
0
0
42
66
0
0
0
0
January 2007 (pig,
O)
2007 (3) O 5mths 0 12.5 0 0
2006 (2) O
O
None
<6mths
>6mths
NA
0
0
0
0
0
0
0
0
0
0
0
0
2006 (pig, O)
2005 (1) None None 0 0 0 0 June-August 2005
(pig, O) January
2004 (pig, O)
15
0
20
40
60
80
100
Percent
23456
Round
Percent pigs elisa positive when vaccinated for serotype
O
The highest proportion of pigs positive to serotype O in this province was in round 4. In this
round three pigs, aged just 1-1.5months, had not been vaccinated but 2 out of the 3 were
positive on the O ELISA, presumably due to maternal antibodies. The remaining piglets
were aged from 2-5 months. As opposed to most other provinces, the dates of vaccination
appear to correlate with the age of the piglets ie. older piglets have an earlier vaccination date
that younger ones. It is possible that the better records are a result of an outbreak of FMD in
pigs in the province in that year, which would increase willingness of farmers to present
piglets for vaccination and sampling and enhanced awareness and enthusiasm on the part of
veterinarians.
16
Kien Giang
Cattle
Year Vaccination %
3ABC
+
% O
ELISA
+
% A
ELISA
+
% Asia
1 +
Previous
Infection
date in
province
(species,
serotype)
Comment
Type Vaccination-
sampling
interval
2008
(6)
O,A 1mth 24 51 96 2 2006 (Cattle,
O)
2008
(5)
O,A 5mth 29 50 90 13 2006 (Cattle,
O)
2007
(4)
O,A 1mth 31 82 64 43 2006 (Cattle,
O)
2007
(3)
O,A 5mths 30 27 25 19 2006 (Cattle,
O)
2006
(2)
O,A Unknown 25 53 51 40 2006 (Cattle,
O)
2005
(1)
O,A Unknown 57 60 11 8
0
10
20
30
40
50
60
70
80
90
100
Percentage
3456
Round
Percent of cattle Elisa positive when vaccinated for serotype
O
A
17
2005 (Round 1)
In this round the vaccination and infection history is unknown. There are no known recorded
outbreaks in this province from this or preceding years but there is a very high proportion of
seropositives for the 3ABC ELISA. Of those cattle that are 3ABC ELISA positive 81% are
also O ELISA positive. (Of the 3ABC negative group only 33% are O ELISA positive),
suggesting a possible previous (recent) infection with that serotype.
2006 (Round 2)
Although vaccination is known to have been with O/A vaccine in this round the date of
vaccination is unknown. If vaccination occurred within the 6 month protective period the %
positives are very low, sitting just above 50% for both vaccinated serotypes.
2007 (Round 3)
Vaccination occurred 5 months prior to sampling, which is within the protective period of the
vaccination, the response rate on ELISAs is very poor. All cattle were vaccinated with O/A
vaccine yet there was only around ¼ seropositives on each of these ELISAs.
2007 (Round 4)
In this round the % seropositives is relatively good, as would be expected for a vaccination-
sampling period of 1 month. However it is still of some concern that if all cattle were
definitely vaccinated with O/A vaccine that 1 month post vaccination only 64% were positive
for serotype A. There are two main possibilities for this – that there is an antigen “mismatch”
between the vaccine and the ELISA, or that some animals have been vaccinated with a
serotype O vaccine only.
2008 (Round 5)
All cattle were vaccinated 5 months prior to sampling with O/A vaccine. In both this and
round 6 there is a significantly lower proportion seropositive on the O ELISA than the A
ELISA. It would be extremely unlikely for cattle to be vaccinated for serotype A only, so this
suggests a problem with the sensitivity of the O ELISA assay. In addition to this the
proportion of ELISA A+ is greater amongst the 3ABC +ve group than the 3ABC –ve group,
which suggest there may also be some animals previously infected with this serotype.
2008 (Round 6)
In this round the vaccine is the same as for round 5 but with a vaccination-sampling interval
of 1 month. The proportions positive to the O and A serotypes are not dissimilar to round 5.
Proportions of O and A ELISA positives are both roughly the same between infected and
uninfected groups.
Conclusions
Vaccine response to serotype A improved each round. In contrast serotype O vaccine
response declined from round 4 to rounds 5 and 6. As vaccination with serotype A alone is
not common, this is suggestive of an issue with the sensitivity of the O ELISA.
18
Pigs
Year Vaccination %
3ABC
+
% O
ELISA
+
% A
ELISA
+
% Asia
1 +
Previous
Infection
date in
province
(species,
serotype)
Comment
Type Vaccination-
sampling
interval
2008
(6)
(Aftopor) 1mth 1 35 11 1 2006
(Cattle, O)
2008
(5)
O 5mths 28 31 13 0 2006
(Cattle, O)
2007
(4)
O Various 0 13 0 0 2006
(Cattle, O)
2007
(3)
O 5mths 0 0 0 0 2006
(Cattle, O)
2006
(2)
O Unknown 0 12 0 0 2006
(Cattle, O)
2005
(1)
O Unknown 0 0 0 0
0
5
10
15
20
25
30
35
Percentage
3456
Round
Percent pigs elisa positive when vaccinated for serotype
O
19
In Kien Giang pigs were vaccinated in each round, with the sampling-vaccination interval of
either 1 or 5 months, or in some cases unknown. The percentage seropositives for the O
ELISA varied from 0% (when vaccination date 5 months previous, or unknown) to 35%
when the vaccine was administered 1 month prior to sampling. In all rounds were ages were
recorded pigs were greater than 4 months of age.
Kom Tum
Cattle
Year Vaccination %
3ABC
+
% O
ELISA
+
% A
ELISA
+
%
Asia 1
+
Previous Infection
date in province
(species, serotype)
Comment
Type Vaccination-
sampling
interval
2008 (6) O,A 2mth 14 15 10 0 None
2008 (5) O,A 5mth 5 8 36 0 None
2007 (4) O,A,Asia1 2mth 37 43 61 40 None
2007 (3) None No results.
Samples
unsuitable.
2006 (2) O,A,Asia1 7mth 0 60 10 23 None
2005 (1) O,A,Asia1 Unknown 0 31 4 12 None
0
10
20
30
40
50
60
70
Percentage
456
Round
Percent of cattle Elisa positive when vaccinated for serotype
O
A
Asia1
20
2005 (Round 1)
Again, vaccination date and infection history are unknown for this round. A large
vaccination-sampling interval may explain the variation in proportion seropositive against
each vaccinated serotype.
2006 (Round 2)
The 7 month vaccination-sampling interval may partly explain the variation in seropositives
between O, A and Asia1 serotypes for which these animals were vaccinated. However, it is
also possible that some animals were vaccinated with O vaccine only (due to the significantly
higher % of positives on this ELISA). No animals had history of infection or reacted on the
3ABC ELISA.
2007 (Round 3)
No samples collected or tested in this round.
2007 (Round 4)
Given the short period between vaccination and sampling the % seropositives for each of the
3 vaccinated serotypes is very low. In this round, as compared to others, there was a very
high proportion of animals positive on the 3ABC ELISA. These animals did not have a
history of infection and there were no recorded outbreaks in the province. As such, the high
number of animals NSP ELISA positive may be due to any one or combination of the
following:
Movement of infected animals (from other provinces or countries)
Unreported/undetected (mild clinical signs) infection
Large number of carriers that remain (at least intermittently) NSP ELISA
positive
Interestingly the same communes and villages were used in rounds 2 (no samples collected in
round 3) and round 5. Most of the 3ABC positive animals were from one commune (Dak
Nong), only one animal was 3ABC positive from the other commune (Bo Y). Samples from
this round were taken late (ie. January 2008) and the samples in round 5 were taken in April
2008. With just 3 months between sampling, it would be expected that if the same animals
were tested the proportion of those positive to 3ABC ELISA would be higher than the 5%
seen in round 5. Titrating the positive samples for 3ABC and for each of the LP ELISAs in
this round may have helped determine the serotype responsible for infection. This may give
some indication of the source of infection (if there were reported outbreaks in nearby
provinces/countries) however questioning of farmers may also be required.
2008 (Both rounds 5 and 6)
In both these rounds cattle were vaccinated for serotypes O and A. In round 5 this was 5
months prior to sampling and in round 6 it was 2 months prior to sampling. The vaccine
response rate is extremely poor for all serotypes in both rounds. This is suggestive of major
vaccine failure or, contrary to the recorded information, no vaccination.
21
Pigs
Year Vaccination %
3ABC
+
% O
ELISA
+
% A
ELISA
+
%
Asia 1
+
Previous
Infection
date in
province
(species,
serotype)
Comment
Type Vaccination-
sampling
interval
2008 (6) O 2mths 0 3 0 0 None
2008 (5) None NA 8 0 0 0 None
2007 (4) O 2 mths 0 48 0 0 None
2007 (3) None No samples
2006 (2) None NA 0 0 0 0 None
2005 (1) O Unknown 0 0 0 0 None
0
20
40
60
80
100
Percent
46
Round
Percent pigs elisa positive when vaccinated for serotype
O
In Kom Tum pigs were vaccinated in rounds 1, 4 and 6. The only year in which there was a
serological response to the vaccine was 2007, in which pigs were vaccinated 2 months prior
to the sampling date. There are no ages available for these pigs, but 48% were positive on the
O ELISA.
22
Long An
Cattle
Year Vaccination %
3ABC
+
% O
ELISA
+
% A
ELISA
+
%
Asia 1
+
Previous
Infection date
in province
(species,
serotype)
Comment
Type Vaccination-
sampling
interval
2008
(6)
No samples.
2008
(5)
O,A,Asia1 3mths 7 48 83 61
2007
(4)
O,A 1mth 0 0 0 0
2007
(3)
Unknown 28 45 55 70 2007 (pig, O)
2006
(2)
O,A,Asia1
O
1mth
2mths
25
23
58
42
50
32
48
23
2006 (pig, O)
2005
(1)
Unknown 48 50 28 22 2005 (pig,
cattle; O)
0
10
20
30
40
50
60
70
80
90
Percentage
245
Round
Percent of cattle Elisa vaccinated when vaccinated for
serotype
O
A
Asia1
23
2005 (Round 1)
No vaccination or infection history for these cattle is available, but there was an outbreak of
serotype O in cattle and pigs in 2005 in Long An. This is consistent with the 3ABC ELISA
and O ELISA results suggesting that close to 50% of cattle had previously been infected. A
higher proportion of 3ABC positive cattle were O ELISA positive than those that had not
previously been infected.
2006 (Round 2)
In this round, approximately ½ the cattle were administered a trivalent vaccine and ½ the
monovalent (O) vaccine. Given the short period between vaccination and sampling the
vaccine response rates were very poor ie. in almost all cases less than 50%. The slightly
higher number of seropositives to the O ELISA in both groups is likely due to previous
infection (with around ¼ cattle 3ABC positive and of these all are serotype O positive). It is
likely that some of the cattle recorded as having just O vaccine have been administered
trivalent vaccine due to the seropositive percentages of 32 and 22% respectively for A and
Asia 1. Of these none were 3ABC positive.
2007 (Round 3)
Both vaccine and outbreak information is missing in this round, making interpretation of the
results difficult. It can be surmised from the results that at least some animals have been
recently vaccinated with a trivalent vaccine.
2007 (Round 4)
Vaccination was with O/A vaccine 1 month prior to sampling but no animals were positive
on any ELISA. This should have been further investigated immediately at both the laboratory
and field level. Given the range of P.I. values for each of the ELISAs, and the fact that it was
all assays (thus unlikely to be a specific antigen problem), then in the absence of operator
error the field information is likely to be incorrect or there may have been a problem with the
batch of vaccine (including poor storage or transport).
2008 (Round 5)
Vaccine response rates are highly variable between serotypes. This is difficult to explain
when a trivalent vaccine was administered to all cattle 3 months prior to sampling. In
addition, it is the A ELISA which has the higher proportion of positives – and this is less
likely than O to be used on its own. The proportion of 3ABC positives is also very low.
2008 (Round 6)
No samples.
Conclusions
The overall vaccine response in cattle in this province was poor. Long An would potentially
prove to be a good province for further investigations of vaccine failure.