122PART TWO Trading System$20.70 is a good idea, because this level doesn’t show good support. docx
Bạn đang xem bản rút gọn của tài liệu. Xem và tải ngay bản đầy đủ của tài liệu tại đây (1.11 MB, 27 trang )
$20.70 is a good idea, because this level doesn’t show good support. It
cannot serve as a reliable indication of weakness if this level is broken.
Essentially, it all comes to the dilemma of, “Do I let the stock hit the trail-
ing stop and give up a significant portion of the current paper profit? Or
do I take the profit now and kill the chance for a bigger move?”
That’s where we use a confidence level, placing it at $20.75. If this
level is broken on the downside, we change our original plan. While our
trailing stop is still in place, our exit strategy is now to sell our shares on
the first worthy bounce. If the confidence level is broken, we don’t expect
the stock to go to new highs anymore, and any bounce between the price
range $20.90–$21 is to be used to exit our remaining shares.
122
PART TWO Trading System
CHAPTER 12
Trading Setups
In this chapter, we discuss setups that we apply in our everyday trading.
They will look familiar to an experienced trader although there is a cer-
tain spin on classic setups. For instance, the well-known cup-and-handle
formation is tweaked somewhat for intraday trading. Also, such a com-
monly known setup as the ascending (descending) triangle has a certain
twist that we describe.
Most of our setups with the exception of capitulation and euphoria
are trend-continuation formations. Capitulation and euphoria are the only
trend-reversal setups in our arsenal. But, as you know from the previous
discussion, there are many ways to trade the same setup. If a trade fails as
a trend continuation, it could be faded for a trend reversal. This approach
is in keeping with what we discuss about the role of setups. Although they
do not predict the direction itself, they show the signs of direction, and if
the signs tell us that upward movement has failed, then a short could be
justified. Breaking of the stop level indicates failure. Breaking of the stop
level before the setup is triggered invalidates the setup. This way we can
define a stop level as a level for fading the setup. This is also known as
trading of pattern failure and can be one’s trading style.
Also, as you know from early chapters, every setup can be played
with a different degree of aggressiveness. So, as you see the description
of the setup with a recommendation to buy on the breakout (regular
entry), you can apply to this all the possibilities we discuss earlier: buy-
ing before confirmation or buying after the breakout and test of new
support.
123
Copyright © 2004 by GST Captial Group, LLC. Click here for terms of use.
JUMP-BASE–EXPLOSION (JBE) SETUP
The jump-base–explosion setup can be described as consolidation near
the high after initial upward movement. The idea of this setup is that an
initial upward movement (the J phase) shows the direction of major inter-
est. Then a stock meets resistance and consolidates under this level (the B
phase). If the stock is strong enough to stay close to the resistance level
without sharp retracement, it means that the path of least resistance is still
upward and that the stock is likely to continue in the same direction as
soon as it digests the distribution. We prefer the range of the consolida-
tion to be narrow, usually not more than 25 cents. The first stage of the
setup (Jump) should be not less than 1.5 times, but preferably 2 times, the
size of the range (Base). With a range of 25 cents we get ideally 50 cents
or more of the initial movement.
This setup has several variations. They differ by the formation
within the consolidation range.
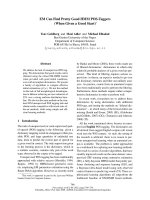
1. Flatline at the High. Entry should be taken as the flatline makes a new
high. The stop is placed under the nearest support, or, if the initial run-up
has no pullbacks to indicate where support is, the stop is defined by risk
tolerance. (See Figure 12.1.)
2. Consolidation after a Shallow Pullback. Volume should decrease on
the consolidation phase. The buy signal is a break of the upper limit of the
range (U). The stop is placed under the lower limit of the range (L). (See
Figure 12.2.)
3. Narrow Range Near the High. Volume should dry up on pullbacks and
increase on upward pushes. Buy and stop triggers are similar to setup 2.
(See Figure 12.3.)
4. Ascending Triangle. The ascending triangle is similar to setups 2 and 3,
with a somewhat stronger indication of successful breakout. This setup is sim-
ilar to the classic ascending triangle, with the only distinction being that we
want this formation to occur within the consolidation range. (See Figure 12.4.)
DROP-BASE–IMPLOSION (DBI) SETUP
The drop-base–implosion setup mirrors the JBE on the downside for a short play.
Everything that was valid for the JBE setup is valid for the DBI as well. It has
the same formations and the same rules for entry and stop placement. An ascend-
ing triangle is going to reverse to a descending one, of course. (See Figure 12.5.)
124
PART TWO Trading System
125
FIGURE 12.1
Flatline at the high.
126
FIGURE 12.2
Consolidation after a shallow pullback.
127
FIGURE 12.3
Narrow range near the high.
128
FIGURE 12.4
Ascending triangle.
129
FIGURE 12.5
Drop-base–implosion setup.
OPEN-HIGH– AND OPEN-LOW–BREAK SETUPS
Open-high– and open-low–break setups are breaks of the range that are
played similarly to JBE and DBI setups. The only difference is that these
are setups for the beginning of the trading day, so they usually don’t have
initial movement. The idea is to define the most likely direction of the
price movement by the direction of the break of the opening range.
For these setups we want the stock to move within the range, not
more than 25 cents. These are setups for the first 15–20 minutes of the
trading day.
If the stock breaks the high of the range, we go long with the stop at
the low of the range. If the stock breaks the low of the range, we go short
with a stop at the high of the range. Since the opening is often quite
volatile, this setup is frequently used for scalps unless the market shows a
strong trend. Scalpers look for a 1:1 or 2:1 ratio of reward to risk. Holders
scale out into a 2:1 reward/risk ratio and look for a trend. (See Figures
12.6 and 12.7.)
CUP-AND-HANDLE SETUP
The cup and handle is also a breakout setup and is very common for
longer time frames. It works best on a day’s high, although it can be
applied in the middle of the daily range as well.
In Figure 12.8, points 1 and 3 are the cup edges at the day’s high.
Point 2 is the cup bottom. The volume should dry up close to point 2 and
pick up close to points 1 and 3. The cup should continue for a minimum
of 30 minutes. But more than 30 minutes is desirable. In our experience,
the optimal time for a cup forming is 1 hour or more.
Point 4 is the bottom of the handle, and volume should dry up here.
The handle should not have retracement deeper than 50 percent of cup
depth. The volume should pick up at point 5. The handle should continue
no longer than 30 percent of the time of cup formation, 25 percent is desir-
able. The stop is placed below the handle bottom. The entry point can be
taken aggressively or conservatively as described earlier.
CAPITULATION
Capitulation is a reversal setup. It’s that fast, sharp decline with vertical
movement and volume-pace pickup that are necessary components
because they suggest panic.
Capitulation is one of the riskiest setups. It requires fast reactions
and well-developed scalping skills because it sometimes provides just a
130
PART TWO Trading System
131
FIGURE 12.6
Open-high–break setup.
132
FIGURE 12.7
Open-low–break setup.
133
FIGURE 12.8
Cup-and-handle setup.
134
FIGURE 12.9
Capitulation.
small, quick bounce. It could be treated as a scalp or as a hold for the
recovery, depending on market conditions. A stop is placed under the
level that the stock has bounced from as discussed in previous chapters.
Keep in mind that this setup is more conceptual than others. It
doesn’t have an exact indication of how big the vertical drop should be to
provide the best chances for a profitable entry. In practical examples cited
in Part Three, you will see that this setup contains a much bigger “art” ele-
ment compared to others. (See Figure 12.9.)
We do not describe euphoria as a separate setup here. It’s an exact
mirror of capitulation. The main reason for not including it in our list of
setups is that we avoid shorting strong stocks altogether until we see clear
reversal. Shorting strong stocks can be even more dangerous than buying
capitulation. In Chapter 13 and in practical examples, we discuss the signs
of trend reversal that we use for shorting the upward move exhaustion.
TRADER’S ACTION
Following is an algorithm of the action traders should take when a signal
is generated:
1. Define the setup by comparing a stock chart to the charts of setups.
2. Evaluate the risk by volume and the look of Level 2. If you see low vol-
ume, a big spread, thin levels, small sizes shown by market participants,
and/or a wide gap between levels, you know this is a high-risk stock.
Skip the trade altogether or lower your share size. Be prepared to limit
your expectations to scalp.
3. Define the trigger point and stop level as the setup suggests.
4. Evaluate the stop from the perspective of your risk tolerance. If the stop
exceeds the size of the loss dictated by your risk management, lower
your share size or skip the trade altogether.
5. Define the conditions that work in favor of the setup and the conditions
that invalidate it.
If the stock breaks the stop level before triggering, then the setup
is invalidated.
If the stock moves in sync with the Nasdaq-100 (NDX), you need
the NDX directional support for the setup to achieve a higher
probability of working.
If the stock moves with no relation to the NDX, you need the NDX
to be in favor or neutral to the direction of the setup. Do not take
the trade if the NDX moves sharply against your setup direction.
CHAPTER 12 Trading Setups
135
6. Define the conditions of fading the setup. If the stock breaks the stop
level before triggering and you get the NDX working against the
setup, then fading is a reasonable trade.
7. Define your approach to the trade in terms of aggressiveness depend-
ing on market mood. Be aggressive in a trending market and conser-
vative in a choppy market. Pick your method of entry as the setups
suggest.
8. As your entry is triggered, initiate the trade without hesitation.
9. Monitor your trade as it develops. Don’t let the movements within the
range confuse or rattle you. Your trade is stopped out only when the
stop is hit. The stop was placed there for a reason. Don’t change your
mind in the middle of action—most likely it’s your emotions talking.
10. As the stock moves in your favor, wait for a clear exit signal to close
the trade in full, or partial it out. According to tape-reading principles,
slow movement with steady volume indicates a stage where you con-
tinue to hold your position. Vertical spikes with sharp volume
increases indicate an area and time interval to exit, either fully or par-
tially. Be willing to exit in full in a choppy market by taking the scalp.
Ride your position in a trending market, protecting the profit by par-
tialling out and trailing the stop.
136
PART TWO Trading System
CHAPTER 13
Trading Market Ranges and Miscellaneous Points
In this chapter we review some points and cases that “surround” our trad-
ing system, so to speak. By this we refer to situations that are not central
to our system but that occur too often to be ignored. Also, we discuss
those situations that present a particular danger.
As you have seen from the previous discussion, our trading system
is trend-oriented. However, the market is not always trending. Despite the
fact that trends are relatively easy to find in the small time frames in which
we trade, now and then we run into a ranging market. You need recipes
for this market condition.
TRADING RANGES
There are three types of ranges we would like to discuss. Those are regu-
lar, narrow, and expanding. Each requires a different approach and pre-
sents a different challenge. We have to add that as for trend traders, a
ranging market is very tough for us, and we tend to decrease our trading
activity when we run into range days.
Regular Range
A regular range is wide enough to allow traders to profit from the movement
within the range. Unlike a trending environment, this range requires that
traders buy low and sell high. The major challenge is to tell the range from
the trend early enough. If traders fail to identify the ranging market, they are
destined to lose on false breakout attempts. Usually, if we see the market
test the low and high twice and hold, we go into range-trading mode.
137
Copyright © 2004 by GST Captial Group, LLC. Click here for terms of use.
When you are trading the range, you need to buy at the first sign of
strength as the market bounces from the low, or short at the first sign of
weakness as the high is holding. Stop placement is self-explanatory, just
outside of range bounds (see Figure 13.1). The exit point in this case is
just below the upper limit of the range.
If you see the volume rising on upward movement and decreasing in
the downward stage, you might want to try to let your profits run. In order
to give your profits room if the market breaks the range, you can scale out
of your position by selling half your shares at this point. A trailing stop
for another half should be placed just below midrange. In Figure 13.2, a
stop would be placed at $19.40–$19.45.
The idea behind this is based on the assumption that if a stock is
going to break out of the range, it should bounce off $19.50 in most cases.
If it’s going under the midrange, then most likely the stock will remain
range-bound. If a stock is breaking out of the range, then your new stop
level should be $19.80–$19.90, just under new support, which forms at
$20—former resistance, as discussed in Chapter 12. In this scenario a new
set of rules comes into play. Now it would be a trend trade, and the exit
should be made as discussed in Chapter 12.
138
PART TWO Trading System
FIGURE 13.1
Regular range.
CHAPTER 13 Trading Market Ranges and Miscellaneous Points
139
Narrow Range
Trading in a narrow-range market is very difficult. Unless you are just
scalping small movements, all you can do is to wait for the breakout of the
range. The time in which a market is locked in narrow limits can and
should be used for preparing for the break, which means identifying can-
didates you will consider trading when the break finally occurs.
The problem with a narrow range is that you can’t trade within it
because as soon as the stock (index) bounces from the low, it’s already
almost near the high limit of the range, and you have no room for a prof-
itable entry and exit. Attempting to buy at the bottom of the range or short
the top is too risky since you have no clear indication that range is not get-
ting broken, and, even if your entry is correct, the reward is too small and
doesn’t justify the risk.
So, the only thing we are left with is the attempt to play the break out
of the range. In order to place odds in our favor, we need to select the stock
that will break with high enough probability, or, at least, one that won’t go
all the way back to the opposite end of the range if the break fails.
FIGURE 13.2
Trading within the range.
We need to play the stock that is stronger than the broad market for
a long trade or weaker than the market for a short trade. The idea of this
search is quite simple, yet many traders make many losing trades during
narrow market conditions because they try to bet on a break without prop-
erly selecting the candidates.
For a long trade, the stock needs to hang near the high while the mar-
ket pulls back to the lower limit of the range. If we get such a stock, then
we have a very good chance for it to break its upper limit as the market
merely bounces from its lower limit. This situation is shown in Figure
13.3, in which the stock chart is combined with the NDX chart.
As our long candidate breaks the upper limit, we enter it long, mak-
ing sure that the market is holding the lower limit of the range and bounc-
ing off it. Now, if the market goes to the upper limit of its range, our stock
is likely to go with it and often may be even stronger because it’s being
identified by many traders as a strong one worth trading in an unsure mar-
ket. If the bounce fails and the market breaks down, our risk on this stock
is minimal, because its relative strength won’t allow it in most cases to go
down as fast as the broader market, and our stop will be as usual. If we
140
PART TWO Trading System
FIGURE 13.3
Trading a breakout from a narrow range.
were to buy the stock that goes up and down in the range with the market,
we would practically bet on market direction. In the first case we use the
market as an indicator. This is a major difference. The first case is gam-
bling; the second is going with the odds using the relative strength of a
particular stock as an indication of its being a likely candidate.
Also keep in mind that this approach is useful as a backup plan in
trending markets. As the market is going up, you are playing breakouts
and effectively are going with trend. But you need to have a couple of can-
didates on the back burner for short play in case the market reverses. In-
stead of guessing which strong stocks will reverse with the broader market,
you are shorting those that were weak before and didn’t break down
because of the overall market strength. As soon as the market weakens, this
support disappears and the breakdown comes. A similar approach can be
used for finding candidates for a long play during a downtrending market,
where you would buy the breakout on market reversal from the lows.
Expanding Range
The expanding range is the worst market we’ve ever encountered. It is
always costing us stop after stop. This is the market that makes new highs,
just above the upper limit of the range, then drops all the way back to the
low, breaks it, and, instead of continuing to the downside, it bounces all
the way back up, repeating the cycle. See Figure 13.4 for an example.
CHAPTER 13 Trading Market Ranges and Miscellaneous Points
141
FIGURE 13.4
Expanding range.
A widening range with no continuation on any side makes it very
hard to read the movement. Here is what happens when a trader tries to
play this kind of market. As level A is getting broken, trend traders go
short. Instead of a continuation, the market bounces, stopping them out.
At the same time, the breakdown doesn’t allow going long for a range
trade. As level B is touched, traders don’t go short because of the break-
out, but attempting to go long won’t work either. A spike over the break-
out level is too small to allow any room for profit, and the market drops
back effectively, stopping the traders out. This vicious cycle repeats at
levels C, E, and D. This kind of action is very hard to recognize in time.
In theory, you can reverse your position as the market bounces and breaks
your stop level. In reality, this is much easier said than done. You can’t
recognize this kind of action on a first or second failed break, and you
don’t know which of the failures is going to be the last one.
MISCELLANEOUS POINTS
We would now like to go over some miscellaneous points—those fine dis-
tinctions that allow us to correct our action, those factors that should be
taken into consideration in a particular situation. These points serve as a
means of finessing our system and allow us to adapt. When your system
tells you, “If you see A, then do B,” these fine distinctions tell you,
“Unless you see C.” With experience traders can collect plenty of these
points that help them hone their systems, and make them more adjustable,
more flexible, and more “personal.”
In setups with consolidation, the time factor is important. Too short a
consolidation usually leads to a fast, short-lived vertical spike which
often signals reversal. At the same time, too long a consolidation has a
greater chance to fail. It’s hard to define the optimal time of consolida-
tion, since it is different for active and dull markets. A careful observer
can develop an intuitive feeling of “too short” and “too long.”
When a stock makes several consecutive consolidations and breakouts,
each next step of the ladder should be shorter than the previous one.
Ideally the length of each next step is between 50 percent and 75 per-
cent of the length of the previous step. If this ratio is less than 50 per-
cent, the trend is accelerating and is likely to approach its end. If it’s
bigger than 75 percent, the breakout is more likely to fail.
As a rule we consider the second attempt of a break (test of resistance
or support) to be more likely to fail, and the third attempt to be more
likely to succeed.
142
PART TWO Trading System
In a double-top scenario we look to enter a short position when the
price drops below the bottom located between two tops. The stop is
placed above the top. We do not short the second top itself.
In a double-bottom scenario we look to enter a long position when the
price rises above the top located between two lows. The stop is placed
below the low. We do not buy the second bottom itself.
When a stock goes through consolidation and you intend to play the
break of the consolidation range, avoid entry of the trigger if a stock
spikes sharply right into the trigger level. This scenario tends to pro-
duce traps rather than valid breakouts. The ideal case is to go slowly
approaching the trigger level and orderly break.
When you select your candidate for a breakout by the narrow-range
method discussed earlier in this chapter, make sure it’s not a stock that
by its nature moves in the opposite direction of the market. Sometimes
certain sectors act like this; gold stock in the fall of 2002 is an exam-
ple. If you fail to take this into consideration, you would most likely
buy for such a stock breakout when the market is bouncing, although
this is the time for this stock to retreat.
When you are looking for an uptrend reversal after a strong move, you
want to see a stock losing the latest support it has formed on its way up.
Avoid shorting euphoria itself since it can easily turn out to be a shal-
low pullback or new consolidation. Rather you want to see a stock
pulling back to the support level, bouncing on the decreasing volume
without making a new high, retreating back to the support, and break-
ing it. This break is a trigger for a short entry.
A similar approach can be used for the reversal of a downtrend.
When you are trading a stock that follows NDX movements, superim-
pose its chart onto that of the NDX to find out how much in sync they
are. The best trading candidates are those that move with a slight lag
because this allows using the NDX as the leading indicator.
The process of finding the leading indicator can consist of two steps,
including the sector index. It makes the selection of trading candidates
and timing of entries and exits more fine-tuned, although somewhat
more cumbersome. Some of the most popular are the Semiconductor
index (SOX) and the Biotechnology index (BTK).
CHAPTER 13 Trading Market Ranges and Miscellaneous Points
143
This page intentionally left blank.
PART THREE
Practical Examples
In Part Three, we provide a number of practical examples, which are
trades taken from the actual experiences of both authors and dissected to
illustrate the decision-making process.
In those cases in which the trade was explained to and traded by our
students, you will see comments such as “I would” rather than “I did.”
The trades that are presented here were made over a number of
years, so you will see fractions on some of them and decimals on others.
We decided to leave each trade as it was so as not to distort perception.
This demonstrates that no matter what changes are being made in tech-
nology, the core of the market remains the same, and the principles based
on human reactions remain intact. Different time frames are used in the
charts, from 1 minute and higher, to show that traders within any time
frame can apply the principles.
You will see that many of the trades were based not only on pure tape
reading but also in combination with simple technical analysis. We do not
intend to go into depth in those studies. There are plenty of great books
written on the subject. Rather our task is to show how you can add tape
reading to your favorite indicators in order to deepen your understanding.
In the description of the trades, you will see many references to the
psychological issues discussed in Part One. Also, there are some repeti-
tions in applying different tape-reading principles. The authors did this
deliberately because we want this part to be a way of “putting it all
together” for both the technical and the psychological side of trading. We
want each trade to be as finished and as self-contained a review as possi-
ble, to show the entire process of a trader’s thinking as events develop in
real time. The repetition of major points that shape up each trade is
intended to reinforce the correct approach to any trading situation.
145
Copyright © 2004 by GST Captial Group, LLC. Click here for terms of use.
EXAMPLE 1
Accumulation and Distribution
We have already discussed distribution/accumulation principles, which
are important because these two principles are often applied by the smart
money long before the public catches onto this kind of movement. For
example, on this day, Portal Software (PRSF) had news concerning a con-
tract with AOL. (See Figure EX1.) Forgive me for not remembering
exactly what the news was. I’m a trader, not an investor, so I’m unaware
of exactly what it was. The week prior to this day, PRSF was strong—
solid uptrends, no really nasty pullbacks, and so forth. These are normally
signs of accumulation from some defined level. Whether this accumula-
tion occurs in anticipation of something or whether it derives from inside
knowledge or whatever doesn’t really matter. It is how the accumulation
behaves that we traders watch for. Buying is slow, stable, not many sharp
146
PART THREE Practical Examples
FIGURE EX1
Accumulation and distribution. (
RealTick graphics are used with permission of Townsend Analytics, Ltd.
)