Báo cáo hóa học: " An Organic Metal/Silver Nanoparticle Finish on Copper for Efficient Passivation and Solderability Preservation" pptx
Bạn đang xem bản rút gọn của tài liệu. Xem và tải ngay bản đầy đủ của tài liệu tại đây (405.7 KB, 6 trang )
NANO EXPRESS
An Organic Metal/Silver Nanoparticle Finish on Copper
for Efficient Passivation and Solderability Preservation
Bernhard Wessling Æ Marco Thun Æ Carmen Arribas-Sanchez Æ
Sussane Gleeson Æ Joerg Posdorfer Æ Melanie Rischka Æ Bjoern Zeysing
Received: 28 July 2007 / Accepted: 10 August 2007 /Published online: 29 August 2007
Ó to the authors 2007
Abstract For the first time, a complex formed by poly-
aniline (in its organic metal form) and silver has been
deposited on copper in nanoparticulate form. When
depositing on Cu pads of printed circuit boards it efficiently
protects against oxidation and preserves its solderability.
The deposited layer has a thickness of only nominally
50 nm, containing the Organic Metal (conductive poly-
mer), polyaniline, and silver. With [90% (by volume),
polyaniline (PAni) is the major component of the deposited
layer, Ag is present equivalent to a 4 nm thickness. The
Pani–Ag complex is deposited on Cu in form of about
100 nm small particles. Morphology, electrochemical
characteristics, anti-oxidation and solderability results are
reported.
Keywords Conductive polymer Á Organic metal Á
Nanoparticle Á Cu passivation Á Printed circuit board
soldering
Introduction
Polyaniline is known as a conductive polymer and object of
intensive studies for many years [1–4]. Especially the
possibility of forming nanofibres from PAni has motivated
many researchers [5, 6]. The fact that PAni primarily exists
in form of about 10 nm small nanoparticles [7] is less well
known and has not inspired too much additional research
work outside our labs. The same holds for the possibility to
improve the electronic transport properties of PAni by
dispersion, which allows (under appropriate conditions)
PAni to cross the insulator-to-metal transition and become
a true metal (however, a nanometal with both metallic and
tunnelling contributions to the electron transport) [8].
The strong effect of PAni in the prevention of Cu oxi-
dation has been published by us many years ago [9] and is
in commercial use since almost 10 years in a process for
finishing printed circuit boards and providing solderability
after storage and thermal ageing. Here, a PAni
1
-water
dispersion is used as the Cu surface preparation ‘‘predip’’
prior to an electroless Sn deposition [10]. In the meantime
this process is well established and widely used in the
printed circuit board industry as one of the alternative
finishes which are required for the lead-free electronics
manufacturing (lead-free soldering during the assembly of
PCBs with the necessary electronics components). In this
process (ORMECON CSN) the PAni predip is applied
forming an about 80 nm thin adsorbed layer which results
in the formation of selectively Cu(+1) and a passivation of
Cu, in addition, it takes part as a catalyst to provide elec-
trons for Sn(2+) which is subsequently deposited onto the
Cu.
It was the object of our research for 10 years to provide
a solderable surface finish for PCBs which would mainly
contain the organic nanometal PAni. However, it took until
3 years ago that we became able to combine the two nec-
essary functions into such a Cu surface finish, the oxidation
prevention and the solderability preservation without the
need of a final micrometer thick metal layer on top of it
[11]. However, with this technology, it was not possible to
B. Wessling (&) Á M. Thun Á C. Arribas-Sanchez Á S. Gleeson Á
J. Posdorfer Á M. Rischka Á B. Zeysing
Ormecon GmbH, Ferdinand-Harten-Str. 7, Ammersbek 22949,
Germany
e-mail:
1
The polyaniline used in this process is doped with p-toluene
sulfonic acid.
123
Nanoscale Res Lett (2007) 2:455–460
DOI 10.1007/s11671-007-9086-0
prevent discoloration of the preserved pads, and the ther-
mal ageing performance did not reach the level of the
already established metallic finishes. Therefore, this pro-
cess was not successfully introduced into the market.
Surprisingly, it was possible to generate a totally dif-
ferent morphology and performance when adding a minor
amount of Ag (in form of AgNO
3
) to the aqueous disper-
sion og the Organic Metal. In the following, the
characteristics of this new dispersion and the resulting
nanolayer will be described.
Experimental
Organic Metal/Silver Dispersion
Synthesis and Dispersion of Polyaniline
Polyaniline powder has been synthesized by oxidative
polymerization of aniline in the presence of p-toluene
sulfonic acid as dopant as described in [12]. The resulting
green polymer powder has a conductivity of 5 S/cm mea-
sured as a pressed pellet (10 t pressure at room temperature
for 5 min).
The subsequent dispersion of the polyaniline was per-
formed according to the process described in reference
[13].
Preparation of Organic Metal/Silver Dispersion
First, a polyaniline dispersion in water was created fol-
lowing reference [13]. The dispersion has a particle size of
55 nm (measured by Laser Doppler technique) and shows a
conductivity of 180 S/cm when deposited as a homoge-
neous layer on a glass substrate. Dispersing and surface-
active agents to improve soldering and AgNO
3
(150 mg/L)
are added to the dispersion. After thorough mixing the
dispersion is ready to use.
Providing a Solderable Surface Finish for PCBs
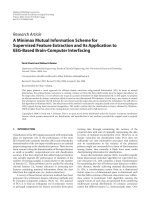
The process of providing a solderable surface finish for
PCBs using the organic metal/silver nanoparticle finish (as
shown in Fig. 1) is a procedure starting with an acid
cleaning, followed by a microetch pretreatment step and
then by the deposition of the active organic metal/silver
layer, ending with rinsing and drying of the PCB. The OM/
Ag dispersion deposition is made at 35 °C for 90 s.
In the first step the PCB is pretreated by a dispersion
containing polyaniline (1). In the following step the board
is cleaned using an acidic solution (2), followed by two
rinsing steps (3 & 4) in water. An acidic solution is used as
a conditioner (5). In the most important step the organic
metal/silver nanolayer is deposited on the PCB using the
aqueous dispersion of polyaniline containing a silver salt
(6). After that the PCB is rinsed twice in water (7 & 8) and
dried (9).
Electrochemical Thickness Determination
With a galvanostatic coulometric measurement (GCM) a
metallic coating is removed from its metallic or non-
metallic substrate by using an electrolyte and applying an
electric current (according to DIN EN ISO 2177 and
ASTM B504). The current is controlled (frequently held
constant) and the potential becomes the dependant vari-
able, which is determined as a function of time.
The constant current i applied to the electrode causes the
metallic coating Me
A
to be oxidized at a constant rate to
the product Me
A
n+
(n = number of electrons reduced). The
potential of the electrode moves to values characteristic of
the couple Me
A
/Me
A
n+
. After the complete oxidation of the
coating Me
A
the potential at the electrode will rapidly
change towards more positive values until a second oxi-
dation process can start at the new interface Me
B
(intermetallic phase or second metal).
The relationship of the oxidized mass is quantitative
according to Faradays law (1):
Fig. 1 Scheme of process for
providing a solderable surface
finish for PCBs
456 Nanoscale Res Lett (2007) 2:455–460
123
m = i  t  M/n  F ð1Þ
with i = applied constant current, t = transition time, M =
molecular weight, n = number of electrons, F = Faraday
constant.
Equation 1 does not hold if secondary reactions occur
and the current is not exclusively used for oxidation of
Me
A
or the reduction of oxides.
The electrochemical cell consists of a working electrode
with a 0.25 cm
2
area, designed specifically for the evalu-
ation of layer thickness, a platinum wire counter electrode
and a reference electrode (Ag/AgCl in 3 mol KCl). The test
electrolyte is filled into a 50 mL glass body with three
14.5/23 standard tapers and the electrodes are mounted
with taper joints. The electrolyte used was a water-based
solution of potassium thiocyanate. The electrolyte was not
deaerated.
As shown in Fig. 2 at the indicated potential regions the
following reactions occurred:
E\ À0:2V: Cu þ SCN
À
[ CuSCN þe
À
E ¼À0:05 V : Ag þ4 SCN
À
[ ½AgðSCNÞ
4
3À
þ e
À
E [ 0:10 V : CuSCN þSCN
À
[ CuSCN
2
þ e
À
The finish of the copper surface in dependenace on
the immersion time in organic metal/silver nanoparticle
finish is displayed in Fig. 3. The potentials indicate
that the amount of free copper surface decreases
slowly at the beginning of the process, having the
highest rate between 40 and 60 s immersion time and
after 60 s the rest of the free copper surface is coated
slowly. After about 90 s there is no free copper
detectable.
Morphology Investigation by SEM
Figure 4 shows a scanning electron microscopy (SEM)
image of copper pad of a PCB after treatment with the
organic metal/silver nanoparticle finish. The SEM investi-
gations were performed by the institute nanoAnalytics
GmbH in Muenster, Germany. The measurements were
done using a field emission SEM from LEO, type 1530 VP
with appropriate test panels on which the Pani–Ag complex
had been deposited under standard conditions. The
microscope is calibrated regularly using a standard certified
by the PTB (Physikalisch Technische Bundesanstalt in
Braunschweig, Germany: standard #5282-PTB-04).
XPS Investigations
The X-ray photoelectron spectroscopy (XPS) investiga-
tions were performed by the institute nanoAnalytics GmbH
in Muenster, Germany. The measurements were done using
an ESCALAB 250 from Thermo VG Scientific with
Fig. 2 Potential–time-curves for Cu, Ag coated on Cu by immersion
and OM U nanofinish coated on Cu by immersion determined in a
galvanostatic coulometric measurement
Fig. 3 Potential–time-curves for a copper surface being coated by
organic metal/silver nanofinish for different immersion times
Fig. 4 SEM image of a PCB after treatment with the organic metal/
silver nanoparticle finish
Nanoscale Res Lett (2007) 2:455–460 457
123
appropriate test panels on which the Pani–Ag complex had
been deposited under standard conditions. The information
depth is about 5–10 nm, the detection limit differs from
element to element but is around 0.1 At%. Monochromatic
Al Ka X-rays were used (15 kV, 150 W) and the spectra
were measured using a pass energy of 80 eV for survey
spectra and 30 eV for core level spectra. If necessary
charge compensation was done using a Flood Gun
(e- energy * 6 eV/0.05 mA current).
Quantitative information about the surface composition
was calculated from survey spectra using the standard
Scofield sensitivity factors [14]. The error can be estimated
to be typically *10%; statistic errors of single measure-
ments were calculated using the method of Harrison and
Hazell (SIA, 18, 1992, p. 368–376).
Figures 5 and 6 show depth profiles of copper and silver
on the treated copper surfaces before and after reflow. At
the surface the silver to copper ratio changes during the
reflow process (the ratio became smaller), but from a depth
of about 2 nm on no change in the ratio could be detected
after the reflow process.
The ratio of metallic to oxidized copper on the surface
of the fresh sample and the sample after reflow are shown
in Figs. 7 and 8. This ratio did not change in the reflow
process.
Kelvin Potential
The surface potentials of copper, oxidized copper, silver on
copper after immersion and organic metal/silver nanopar-
ticle finish on copper after immersion were determined
using a scanning kelvin probe (SKP, UBM Messtechnik
GmbH). The volta-potential measured with a kelvin sensor
is suitable for non-contact measurements of surface
potentials [15, 16]. The measured object, the working
electrode, and the reference electrode of the Kelvin probe
form, due to the small gap between them, a capacitor. The
amplitude of the potential developed between them shows
the degree of surface activity. A periodic variation in
separation by means of an actuator built into the sensor
changes the capacitance of the set-up. The resulting signal
is converted to a measurement signal by means of a lock-in
amplifier [17]. The volta-potential difference is directly
determined by the surface potential [18].
Fig. 5 Freshly prepared surface
Fig. 6 Surface after 1 reflow step
Fig. 7 Ratio of metallic to oxidized copper in the fresh sample
(surface)
Fig. 8 Ratio of metallic to oxidized copper after 1 reflow step
458 Nanoscale Res Lett (2007) 2:455–460
123
As vibrating reference electrode a tungsten wire with a
tip diameter of 80 lm was used. The tip was positioned
about 25 lm above the specimen, the vibration amplitude
was ±10 lm and the vibration frequency of the needle was
1.75 kHz. As the measurements were performed in labo-
ratory atmosphere, gold was used as reliable reference
material.
Figure 9 shows a copper surface treated with organic
metal/silver nanoparticle finish in the fresh stage after
finishing.
The Kelvin potentials of different treated and untreated
copper surfaces are summarized in Table 1.
Thermal Ageing and Solderability Determination
The thermal aging and solderability determination were
carried out by Ormecon in Ammersbek, Germany.
Thermal Aging
The thermal aging was performed to simulate soldering and
storage conditions. To simulate soldering conditions test
panels on which the Pani–Ag complex had been deposited
under standard conditions were aged up to 4 times in the
reflow oven RO 300 FC N2 from Essemtec, Swizerland.
A lead free soldering profile was chosen with a peak
temperature *250 ° C. To simulate storage conditions
other test panels were aged 4 h at 155 °C in the IR hot air
oven Techno HA-06 from Athelec.
Solderability Determination
The solderability measurements were preformed using the
wetting balance Meniscograph ST60 from Metronelec with
appropriate test panels on which the Pani–Ag complex had
been deposited under standard conditions. The solderability
of the panels was determined as wetting angle under lead
free soldering conditions. The solder Sn
95.5
Ag
3.8
Cu
0.7
(260 °C) from Ecoloy and fluxer 959 T from Kester were
used. The measurement data is converted to wetting angle
using the software from Metronelec according to the
standard NF-A-89 400P.
The performance of copper surfaces treated with organic
metal/silver nanoparticle finish and established metallic
surface finishes is compared before and after reflow in
Table 2.
Interpretation of Results and Summary
Surprisingly and in contrast to the formerly developed
dispersion ‘‘OMN 7100’’ (which forms a coherent thin
layer on the Cu surface), the same dispersion only con-
taining a minor amount of Ag is forming a nanoparticulate
discontinuous layer. The particles are around 100 nm small
Fig. 9 Copper surface treated with organic metal/silver nanoparticle
finish
Table 1 Kelvin potentials of different surfaces
Surface Kelvin potential [mV]
Cu (pure, unoxidized) 70
Cu oxides 150–180
Cu treated with organic metal/silver
nanoparticle finish (50 nm layer)
320–340
Cu treated with immersion silver
(500 nm layer)
400
Table 2 Wetting angles before and after reflow process for different
surfaces
Process Reflow
cycles
Wetting
angle [°]
Wetting angle after
ageing at 155 °C
for 4 h [°]
Established metallic
surface finishes
015 20
125 30
230 35
345 50
460 70
Organic metal/silver
nanoparticle finish
0 15–20 25–30
1 20–25 25–30
2 25–30 25–30
3 20–30 30–35
4 30–35 30–40
Nanoscale Res Lett (2007) 2:455–460 459
123
and exclusively located on the phase boundaries of the Cu
crystallites.
Assuming a density of 1.3 g/cm
3
(as in Polyaniline) and
a transfer of 2 electrons per 4 aniline monomer units, the
electrochemical measurements lead to a nominal average
thickness of the Polyaniline-Ag layer of around 50 nm.
XPS measurements show that the Silver within these
50 nm only has a nominal average thickness of about 4 nm.
EDX studies have not shown that Ag is present in form
of any detectable aggregates. It seems in contrast that it is
evenly distributed within or around the Organic Metal
particles. The electrochemical investigation (Fig. 2) shows
that not only the morphology is totally different from the
layer which is formed using the same polyaniline disper-
sion without Ag ions, but also a new form of complex has
formed. The potential at which this complex is oxidized is
significantly different from Ag on Cu and also from
polyaniline alone.
This is also confirmed by the Kelvin probe measure-
ments which show the surface potential (Fig 9 and
Table 1).
The XPS shows a very small amount of the Cu surface
atoms to be in oxidized stage even after thermal ageing
under ambient atmosphere (Fig. 7 and 8), only around
20–25%, and ageing does not change the degree of oxi-
dation. Also, during ageing, the Ag does not migrate into
the Cu (Fig. 5 and 6).
For the practical industrial application in PCB assembly,
this surface finish seems to be exceptional. It does not show
any discoloration during reflow, and the wetting behaviour
(according to wetting balance studies) is superior to any
metallic surface finish (Table 2). First practical tests in
PCN manufacturing and in assembly facilities have con-
firmed this. Figure 10 shows a printed circuit board before
treatment, directly after the surface finish with organic
metal/silver nanoparticle finish and the surface after treat-
ment and aging.
Summary
A nanoparticulate complex between the organic metal
polyaniline and Ag has been described for the first time.
A new type of nano size surface finish for metals (here: Cu)
can be deposited using a dispersion of this complex.
Although it does not form a continuous nanolayer, it
completely and effectively shields the Cu and prevents it
from being oxidized. Its ageing resistance and wetting
(soldering) performance is excellent and superior to
established metallic finishes.
References
1. A.G. MacDiarmid, Angew. Chem. 113, 2649 (2001)
2. A.A. Syed, M.K. Dinesan, Talanta 38(8), 815 (1991)
3. P.M. Beadle, Y.F. Nicolau, E. Banka, P. Rannou, D. Djurado,
Synth. Metal. 95, 29 (1998)
4. A.J. Heeger, Synth. Metal. 57, 3471 (1993)
5. J. Huang, S. Virji, B.H. Weiller, R.B. Kaner, J. Am. Chem. Soc.
125, 314 (2003)
6. J. Huang, R.B. Kaner, J. Am. Chem. Soc. 126, 851 (2004)
7. B. Wessling, in Handbook of Conducting Polymers ed. by
T. Skotheim, R.L. Elsenbaumer, J.R. Reynolds (Dekker, New
York, 1998)
8. R. Pelster G. Nimtz B. Wessling, Phys. Rev. B 49, 12718 (1994)
9. B. Wessling, Adv. Mater 6(3), 226 (1994)
10. www.ormecon.de (ORMECON CSN, technical information)
11. N. Arendt, C. Arribas, J. Posdorfer, M. Thun, B. Wessling,
OnBoard Technology. 12 (April 2006)
12. B. Wessling, H. Volk, S. Bla
¨
ttner, WO 89/02155
13. B. Wessling, PCT/EP2005/000595
14. J.H. Scofield, J. Electron Spectros. Related Phenomena 8, 129
(1976)
15. M Stratmann, H. Streckel, R. Feser, Corros. Sci. 32, 467 (1991)
16. M. Stratmann R. Feser A. Leng, farbe und lacke 100(2), 93
(1994)
17. Information brochure of UBM Messtechnik GmbH, Ettlingen
(1996)
18. M. Stratmann, M. Wolpers, H. Streckel, R. Feser, Ber. Buns-
enges. Phys. Chem. 95, 1365 (1991)
Fig. 10 PCB before surface finish, after surface finish and after
surface finish and aging
460 Nanoscale Res Lett (2007) 2:455–460
123