Báo cáo hóa học: " Chemical Synthesis of PEDOT–Au Nanocomposite" pptx
Bạn đang xem bản rút gọn của tài liệu. Xem và tải ngay bản đầy đủ của tài liệu tại đây (357.69 KB, 4 trang )
NANO PERSPECTIVES
Chemical Synthesis of PEDOT–Au Nanocomposite
S. Vinod Selvaganesh Æ J. Mathiyarasu Æ
K. L. N. Phani Æ V. Yegnaraman
Received: 15 August 2007 / Accepted: 5 October 2007 / Published online: 25 October 2007
Ó to the authors 2007
Abstract In this work, gold-incorporated polyethylen-
edioxythiophene nanocomposite material has been
synthesized chemically, employing reverse emulsion
polymerization method. Infrared and Raman spectroscopic
studies revealed that the polymerization of ethylenedi-
oxythiophene leads to the formation of polymer
polyethylenedioxythiophene incorporating gold nanoparti-
cles. Scanning electron microscope studies showed the
formation of polymer nanorods of 50–100 nm diameter and
the X-ray diffraction analysis clearly indicates the presence
of gold nanoparticles of 50 nm in size.
Keywords Composites Á Chemical synthesis Á
X-ray diffraction Á Infrared spectroscopy Á
Raman spectroscopy
Introduction
Conducting polymer (CP) and metal nanoparticle com-
posites or the so-called nanocomposites have received
much attention recently due to their potential applications
in electrocatalysis, chemical sensors, electrochemical
capacitors, and protective coatings against corrosion [1–2].
Various methods for the preparation of these composites
have been described, including electrochemical deposition
of nanoparticles onto electrodes previously coated with a
CP, photochemical preparation, reduction of metal salts
dissolved in a polymer matrix, polymerization of the CP
around nanoparticles and mixing of nanoparticles into a
polymer matrix. Of the major CPs, polyethylenedioxythi-
ophene (PEDOT) has proven interesting particularly due to
its optical transparency in its conducting state, high sta-
bility, moderate band gap and low redox potential. Further,
it can be polymerized from both organic and aqueous
solutions and at both positive and negative potentials,
unlike most thiophene derivatives. As PEDOT can be
polymerized from aqueous solutions, it could be used in
biosensor applications as well.
Au incorporated PEDOT nanomaterials are reported in
literature [3–7] employing several techniques, and in this
work, we take advantage of the surfactant chemistry to
prepare both PEDOT polymer and Au in the nanoform,
which ultimately form nanocomposite materials. The
present work involves synthesis of PEDOT and Au-
incorporated PEDOT nanomaterials through surfactant
chemistry and their characterization using Fourier Trans-
form Infrared (FTIR), FT-Raman, Scanning Electron
Microscope (SEM) and X-ray diffraction (XRD)
techniques.
Materials and Methods
Synthesis of PEDOT and Gold-incorporated
Nanoparticles
PEDOT nanoparticles were prepared by reverse cylindrical
micelle-mediated interfacial polymerization, according to
the method reported elsewhere [8]. Typically, 4.75 g
(19.12 mmol) of sodium bis(2-ethylhexyl)sulfosuccinate
(AOT) was dissolved in 70 mL of n-hexane, and subse-
quently 0.36 mL of aqueous FeCl
3
solution (10.0 mmol)
was introduced in the AOT/hexane reverse cylindrical
S. V. Selvaganesh Á J. Mathiyarasu (&) Á
K. L. N. Phani Á V. Yegnaraman
Electrodics and Electrocatalysis Division, Central
Electrochemical Research Institute, Karaikudi 630 006, India
e-mail:
123
Nanoscale Res Lett (2007) 2:546–549
DOI 10.1007/s11671-007-9100-6
micelle phase was a yellow viscous solution. Then, 0.25 g
of ethylenedioxythiophene (EDOT) solution was added to
this solution mixture. After the addition of EDOT mono-
mer there was a slow colour transition from yellow to
black, indicating polymerization of the monomer. The
polymerization of the EDOT monomer was allowed to
proceed for 6 h at 20 °C. Au-incorporated PEDOT nano-
particles were prepared by adding tetrachloroauric acid of
(0.25 g) as an oxidant instead of FeCl
3
solution in the
AOT/hexane solvent mixture. The resultant polymeric
substance was washed with acetonitrile/methanol mixture
in order to remove AOT and the residual reagents.
XRD measurements were carried out on a Philips Pan-
analytical X-ray diffractometer using Cu K
a
radiation
(k = 0.15406 nm). The identification of the phases was
made by referring to the Joint Committee on Powder dif-
fraction Standards International Center for Diffraction Data
(JCPDS-ICDD) database. In order to estimate the particle
size Scherrer’s equation was used. For this purpose, the
(220) peak of the Au fcc structure around 2h = 64.78° was
selected.
SEM measurements were made using Hitachi SEM
(Field emission type), model S 4700 with an acceleration
voltage of 10 kV. The approximate film composition ( ± 2
at.%) was analysed with an energy-dispersive fluorescence
X-ray analysis (XRF-EDX) (Horiba X-ray analytical
microscope XGT-2700).
FT-IR spectra were recorded using FT-IR spectrometer
(Thermo Nicolet Model 670) equipped with a DTGS
detector. All spectra were collected for 256 interferograms
at a resolution of 4 cm
–1
. For Raman spectroscopic mea-
surements, a Thermo-Electron FT-Raman module (InGaAs
detector and Nd:YVO
4
laser operating at 1064 nm) cou-
pled with a Nexus 670 model FT-IR spectrometer (DTGS
detector) was used.
Results and Discussion
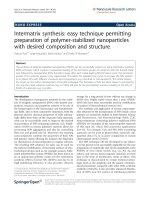
Figure 1 shows the XRD pattern of PEDOT and Au-
incorporated PEDOT nanoparticles, prepared by the
reverse microemulsion method. As expected for PEDOT,
the pattern does not yield any characteristic peaks except
the low angle peak at *25° indicating the amorphous
nature of the polymeric material. The PEDOT–Au nano-
composite shows the diffraction features appearing at 2
theta as 38.20°, 44.41°, 64.54°, 77.50° and 81.68° that
correspond to the (111), (200), (220), (311), and (222)
planes of the standard cubic phase of Au, respectively. As
can be seen, the XRD peaks of the nanocrystallites are
considerably broadened compared to those of the bulk gold
because of the small size of these crystallites. The average
particle size of nanoparticles was estimated based on
Scherrer correlation of particle diameter (D) with peak
width (As, full width at half maximum, k = 0.154 nm) for
Bragg diffraction from ideal single domain crystallites
L = 0.9 k K
a1
/B
(2h)
cos h
max
. The average size of the Au
particles calculated from the width of the diffraction peak
according to the Scherrer equation is *50 nm.
Figure 2 shows the FT-IR spectrum of the PEDOT film
together with the monomer spectrum. It is clear that the
strong band ascribed to the C–H bending mode at 890 cm
–1
disappears in the polymer spectrum in comparison with
that of the monomer, demonstrating the formation of
20 30 40 50 60 70 80 90
222
311
220
200
111
PEDOT-Au
Intensity
2θ
PEDOT
Fig. 1 XRD pattern of nanoparticles of PEDOT and Au–PEDOT
nanocomposite
4000 3500 3000 2500 2000 1500 1000 500
0
30
EDOT Monomer
Wavenumber, cm
-1
0
30
60
PEDOT
Transmittance, %
0
30
60
PEDOT-Au
Fig. 2 FT-IR spectrum of EDOT monomer, PEDOT and Au–PEDOT
nanocomposite
Nanoscale Res Lett (2007) 2:546–549 547
123
PEDOT chains with a,a
0
-coupling. Vibrations at 1,518,
1,483 and 1,339 cm
–1
are attributed to the stretching modes
of C=C and C–C in the thiophene ring. The vibration
modes of the C–S bond in the thiophene ring can be seen at
978, 842 and 691 cm
–1
. The bands at 1,213 and 1,093 cm
–1
are assigned to the stretching modes of the ethylenedioxy
group, and the band around 920 cm
–1
is due to the ethyl-
enedioxy ring deformation mode.
The absorption peak at 1,722 cm
–1
is usually associated
with the doped state of PEDOT. In the case of Au-incor-
porated polymer matrix, the intensity increases due to the
doping of Au
nano
within the polymer matrix.
Figure 3 shows the Raman spectrum of PEDOT along
with the monomer EDOT. In the monomer spectrum, six
strong bands dominate the spectrum at 1,487, 1,424, 1,185,
891, 834, and 766 cm
–1
. In the Raman spectrum of PE-
DOT, one strong peak at 1,424 cm
–1
and a few weaker
bands are observed. Also, the other peaks observed in the
Raman spectrum of PEDOT are at 1,550 (Quinoid
structure), 1,529 (C
a
0
=C
b
0
stretching), 1,424 (C
a
=C
b
stretching), 1,152 (C
a
–C
a
0
stretching), 986 (C
b
–C
alkyl
stretching), 851 (C–H bending of 2,3,5-trisubstituted thio-
phene due to a,a
0
polymerization) and 704 cm
–1
(C
a
–S–C
a
0
ring deformation). Similar peak patterns were observed for
Au-incorporated PEDOT, which indicates that upon
incorporation of Au the polymer structure is not affected.
Figure 4 shows the SEM images of the PEDOT nano-
form and the Au-incorporated polymer matrix. In general,
the morphology of the polymer material shows that the
PEDOT nanoparticles formed are uniform in size. The
image of the Au-incorporated sample clearly shows dis-
crete areas of high contrast, suggesting the presence of Au.
The morphology of the resulting nanocomposites is 50–
100 nm in size with incorporated Au nanoclusters. A closer
view of the nanoclusters (inset) shows that it comprises of
numerous nanoparticles, thus joined to form an aggregate.
The formation of gold was also confirmed by EDAX
measurements. The oxygen–sulphur of PEDOT and Au
nanoparticle ratio is given in Table 1.
From the EDAX measurements, the PEDOT nanopar-
ticle accounts for the presence of oxygen and sulphur
within the polymer matrix of 2:1 ratio. Whereas in the case
of Au-incorporated polymer matrix, in addition to the
3500 3000 2500 2000 1500 1000 500
0
3
6
9
Raman Shift, cm
-1
0
0
3
6
Raman Intensity
3
6
Fig. 3 FT-Raman spectrum of EDOT monomer, PEDOT and Au–
PEDOT nanocomposite
Fig. 4 SEM images of PEDOT nano form and Au-incorporated PEDOT nanocomposite
Table 1 EDAX analysis of the PEDOT and Au-incorporated
PEDOT nanocompiste
Element Net counts ZAF wt% Atom % Formula
O 357 4.562 33.33 58.47 O
S 1,648 1.429 16.98 14.87 S
Element Net counts ZAF wt% Atom % Formula
O 222 5.405 11.12 43.39 O
S 1,293 2.565 10.81 21.04 S
Au 2,363 1.182 61.45 19.47 Au
548 Nanoscale Res Lett (2007) 2:546–549
123
oxygen and sulphur peaks it shows the Au peaks which
amount to 20 atom wt% in the polymer matrix.
Hence, the above spectral and the surface information
indicate that EDOT is polymerized in a linear fashion. The
Au nanoparticles are incorporated within the polymer
backbone through possible Au–sulphur (thiophene) inter-
actions. The structure of the nanocomposites can be
depicted as shown in Scheme 1.
Conclusions
In this work, PEDOT nanoparticles and Au-incorporated
PEDOT nanocomposite materials were prepared by reverse
cylindrical micellar-mediated interfacial polymerization
technique. FT-IR studies clearly reveal the formation of
PEDOT upon chemical oxidation of EDOT monomer and
the incorporation of gold within the PEDOT matrix. Raman
spectral studies revealed that no change occurred in the
PEDOT structure upon incorporation of gold. XRD pattern
of PEDOT nanoparticle showed the amorphous nature of
the material. The diffraction features of the Au-incorpo-
rated PEDOT shows standard cubic phase of Au. The
broadening of XRD peaks of the nanocrystallites suggests
the formation of nanocrystallites and the average size of the
gold particles is calculated to be 50 nm. SEM studies of the
PEDOT nanoparticle showed that the PEDOT nanoparti-
cles are uniform in size. Discrete areas of high contrast in
SEM correspond to gold nanocrystallites of 50–100 nm
size.
These nanocomposites when electrochemically prepared
using organic media, showed very different morphologies
and surface characteristics that enabled their use as selec-
tive electrodes in electroanalysis. We are currently
pursuing these aspects in the context of sensor applications
and will be reported separately.
References
1. M.D. Imisides, R. John, G.G. Wallace, Chemtech 26, 19 (1996)
2. R. Gangopadhyay, A. De, Chem. Mater. 12, 608 (2000)
3. M. Lee, B.W. Kim, J.D. Nam, Y. Lee, Y. Son, S.J. Seo, Mol.
Crystallogr. Liq. Crystallogr. 407, 1 (2003)
4. X. Li, Y. Li, Y. Tan, C. Yang, Y. Li, J. Phys. Chem. B 108, 5192
(2004)
5. S. Senthil Kumar, C. Siva Kumar, J. Mathiyarasu, K.L.N. Phani,
Langmuir 23, 3401 (2007)
6. B.Y. Kim, M.S. Cho, Y.S. Kim, Y. Son, Y. Lee, Synth. Met. 153,
149 (2005)
7. R. Pacios, R. Marcilla, C. Pozo-Gonzalo, J.A. Pomposo,
H. Grande, J. Aizpurua, D. Mecerreyes, J. Nanosci. Nanotechnol.
7, 2938 (2007)
8. J. Jang, M. Chang, H. Yoon, Adv. Mater. 17, 1616 (2005)
n
Au
Au
Au
Au
Au
Au
S
OO
OO
S
OO
S
S
OO
S
OO
OO
S
+
Scheme 1 Illustration showing Au nanoparticles incorporated within
the polymer backbone
Nanoscale Res Lett (2007) 2:546–549 549
123