Báo cáo hóa học: " Excitonic Transitions and Off-resonant Optical Limiting in CdS Quantum Dots Stabilized in a Synthetic Glue Matrix" pptx
Bạn đang xem bản rút gọn của tài liệu. Xem và tải ngay bản đầy đủ của tài liệu tại đây (330.93 KB, 8 trang )
NANO EXPRESS
Excitonic Transitions and Off-resonant Optical Limiting in CdS
Quantum Dots Stabilized in a Synthetic Glue Matrix
Pushpa Ann Kurian Æ C. Vijayan Æ K. Sathiyamoorthy Æ
C. S. Suchand Sandeep Æ Reji Philip
Received: 1 August 2007 / Accepted: 5 October 2007 / Published online: 25 October 2007
Ó to the authors 2007
Abstract Stable films containing CdS quantum dots of
mean size 3.4 nm embedded in a solid host matrix are
prepared using a room temperature chemical route of
synthesis. CdS/synthetic glue nanocomposites are charac-
terized using high resolution transmission electron
microscopy, infrared spectroscopy, differential scanning
calorimetry and thermogravimetric analysis. Significant
blue shift from the bulk absorption edge is observed in
optical absorption as well as photoacoustic spectra indi-
cating strong quantum confinement. The exciton transitions
are better resolved in photoacoustic spectroscopy com-
pared to optical absorption spectroscopy. We assign the
first four bands observed in photoacoustic spectroscopy to
1s
e
–1s
h
,1p
e
–1p
h
,1d
e
–1d
h
and 2p
e
–2p
h
transitions using a
non interacting particle model. Nonlinear absorption stud-
ies are done using z-scan technique with nanosecond pulses
in the off resonant regime. The origin of optical limiting is
predominantly two photon absorption mechanism.
Keywords Exciton Á Nanomaterials Á Optical limiting Á
Nonlinearity Á Photoacoustics
Introduction
Semiconductor nanocrystals have been receiving consid-
erable attention over the past several years as model
systems exhibiting quantum confinement effects and hence
as potential candidate materials for device applications
such as optical limiting and optical switching [1–6].
Optical limiting has been reported for semiconductor
doped glasses [1, 2] and semiconductor nanoparticle solu-
tions [4, 5]. An area of recent focus has been the
development of simple and efficient methods of synthesis
for obtaining these materials in a stable and device-friendly
form in large quantities where synthesis of nanocrystals in
a polymer host plays an important role [7, 8]. Nanocrystals
embedded in solid polymer films have the advantages of
transparency and high optical, thermal, and chemical sta-
bility apart from low cost, reproducibility and ease of
preparation. The composite films retain the optical prop-
erties of the nanocrystals while providing a convenient
matrix and remain stable for considerably longer durations
compared to those dispersed in solutions.
Cadmium sulphide is a direct bandgap II–VI semicon-
ductor material with a bulk band gap of 2.38 eV and
exciton Bohr radius of 3 nm. Bulk CdS is known to be a
very good nonlinear optical material [9]. Semiconductor
nanocrystals of size comparable to bulk exciton radius are
known to exhibit excitonic features arising from discreti-
zation of the band edge due to strong quantum confinement
[10, 11]. The excitonic features in the absorption and
luminescence spectra show significant blue shift with
decreasing particle size, making the optical properties size
dependent [12].
Knowledge of the electronic transitions is essential in
understanding the linear and nonlinear optical properties of
these materials. The spectroscopic techniques used for the
investigation of energy levels are mostly optical absorp-
tion, photoluminescence and Raman spectroscopy [13–16],
which have provided considerable insight into the excitonic
transitions. Another form of spectroscopy that could be
used effectively to gather better resolved spectral
P. A. Kurian Á C. Vijayan (&) Á K. Sathiyamoorthy
Indian Institute of Technology Madras, Chennai 600036, India
e-mail:
C. S. Suchand Sandeep Á R. Philip
Raman Research Institute, Bangalore 560080, India
123
Nanoscale Res Lett (2007) 2:561–568
DOI 10.1007/s11671-007-9099-8
information is photoacoustic spectroscopy (PAS), particu-
larly in the case of samples such as polymer-stabilized CdS
nanocrystals where nonradiative transitions dominate and
luminescence gets quenched. This technique is used in the
present work for probing the electronic transitions in CdS
quantum dots and correlating the observed data with the
theoretical transitions obtained from a noninteracting
particle model.
Optical nonlinearties have been studied using different
experimental techniques like degenerate four wave mixing
(DFWM), z-scan technique, optical interferometry and
nonlinear absorption. Reports are available on large non-
linearities observed in CdS nanocrystals using DFWM and
pump probe experiments [17–21] and also on the relaxation
dynamics of these materials using femtosecond time
resolved pump probe and photoluminescence studies [22,
23]. Recently He et al. [24] studied two photon absorption
and Kerr nonlinearity of CdS nanocrystals synthesized by
ion exchange method in Nafion film using pump probe and
optical Kerr effect techniques with 350 fs pulses at 800 nm.
The z-scan technique can give information regarding both
nonlinear refraction and nonlinear absorption. Most of the
work done on the nonlinear optical properties of semicon-
ductor nanocrystals are on semiconductor doped glasses.
One major limitation of semiconductor doped glasses is the
photodarkening effect. A few reports are there on the non-
linear optical properties of semiconductor nanocrystals
suspended in solutions. The volume fraction of nanocrystals
in solutions is usually small resulting in weak nonlinear
response. Thus, polymer-embedded nanomaterials appear
to be better candidate materials for the study of nonlinear
optical response.
Nonlinear refraction has been studied in CdS nano-
crystals incorporated in polydiacetylene [25] and
polystyrene [26] using nanosecond pulses in the near res-
onant regime. It is well known that resonant nonlinearity is
large but has a slow response with large linear absorption.
On the other hand, off resonant nonlinearity has ultrafast
response. Semiconductor nanocrystals with large nonlin-
earity are also known to be attractive candidate materials
for optical limiting. Optical limiters are devices which have
constant transmittance at low input fluences and a decrease
in transmittance at high fluences. These devices are used to
protect optical sensors and eyes from laser induced
damage.
We have synthesized a nanocomposite material incor-
porating strongly confined CdS nanocrystals of average
size 3.4 nm stabilized in a synthetic glue matrix. The
samples are free standing films with good optical quality
and photostability. The excitonic transitions are studied
using optical and photoacoustic spectroscopy and the
results are correlated with a non interacting particle model.
PAS studies show that the energy corresponding to the first
excitonic transition is E
g
= 2.69 eV. Further, we have also
investigated strong absorptive nonlinearity excited by
nanosecond laser pulses in the off resonant regime
ðE
g
[ "hx [ E
g
=2Þ at 532 nm. The observed optical lim-
iting behavior is discussed on the basis of two photon
absorption process.
Experimental Section
The method of synthesis used for the present work is based
on a chemical route for preparing PbS nanocomposite films
reported by us recently [27]. The precursors used are
cadmium acetate and sodium sulphide of analytic grade.
A commercially available, transparent, water soluble
poly(vinyl acetate) (PVAc) glue purchased from Crown
Chemicals Chennai, India is used as the host matrix to
prepare the nanocomposite. The samples are prepared by
processing equimolar quantities of sodium sulphide and
cadmium acetate in the glue medium, stirring continuously.
The solution was poured into petridishes and air dried to
obtain stable optical quality films. The concentrations of
cadmium acetate used are 0.5, 1, 2 and 3 mM in 50 ml
aqueous solution of the glue. The four samples corre-
sponding to these four different concentrations are
designated as C1, C2, C3 and C4 respectively. The con-
centration of sodium sulphide used in each case is such that
an equimolar ratio of Cd
2+
:S
2–
is obtained in all cases. The
composite films are found to be very stable and they retain
their physical properties for long periods of time. The
thickness of the films used in the present study is 126 lm.
The morphological characterization is done using a Jeol
3010 high resolution transmission electron microscope
with an accelerating voltage of 300 kV. The IR spectrum is
recorded with a Perkin Elmer Spectrum One Fourier
transform infrared (FTIR) spectrophotometer to obtain
information about the surface of the nanocrystal.
Thermogravimetric analysis are performed using a
Perkin Elmer Pyris 6 thermogravimetric analyzer (TGA).
Thermal decompositions are recorded between 30 °C and
900 °C. The heating rate is 10 °C min
–1
. The differential
scanning calorimetry (DSC) studies are done with a
NETZSCZ DSC (200 Phox). The experiments are per-
formed under a nitrogen atmosphere. The heating rate is
10 °C min
–1
.
Optical absorption spectra are recorded on a Jasco
V-570 spectrometer in the wavelength region 300 nm–
600 nm in which the host matrix is transparent. The
photoacoustic spectroscopic studies are done by the gas
microphone technique [28]. The spectrum is recorded using
an automated home-built photoacoustic spectrometer.
A xenon arc lamp of 500 W is used as the excitation
source. The light beam is passed through a monochromator
562 Nanoscale Res Lett (2007) 2:561–568
123
(Jobin Yvon), modulated using a mechanical chopper
(SR540, Stanford research systems) and focused to an
airtight photoacoustic (PA) cell. The modulation frequency
is 10 Hz. The PA cell consists of an aluminium cylinder
with an option for inserting a microphone in its periphery.
The periodically chopped beam is allowed to fall on the
sample kept inside the PA cell through the transparent cell
window. The nonradiative transitions within the sample
heat up the boundary layer of air in contact with the
sample. The periodic heating effect causes the layer to
function as a vibrating piston. This results in periodic
pressure fluctuations inside the cell which are detected by
the sensitive microphone (G.R.A.S). The amplitude and
phase angle of the PA signal are finally detected by a lock
in amplifier (SR830, Stanford research systems) whose
reference channel is connected from the chopper. The
spectral measurements are carried out at room temperature
in the wavelength range of 360–600 nm in steps of 2 nm.
The PA spectrum is corrected for variations in source
intensity as a function of wavelength using carbon black
absorber for normalization. The nonlinear absorption
studies are done by the z-scan technique [29] using 7 ns
pulses from a Nd-YAG laser emitting at the second har-
monic wavelength of 532 nm. The spatial intensity profile
of the laser is found to be near Gaussian by beam profile
measurements using the knife edge method. An automated
open aperture z-scan set up is used to measure intensity
dependent transmission. The laser beam is focused using a
lens of focal length 185 mm and the transmittance is
measured using a pyroelectric energy probe as a function of
sample position z by translating the sample along the beam
axis (z-axis). The sample sees a different fluence at each
position of z. The small fluctuations in the pulse energy are
accounted for by using a reference energy probe. The
pulse-to-pulse energy stability is found to be approximately
5%. Depending on the absorption mechanism involved, we
get a Lorentzian or inverted Lorentzian with its maximum
or minimum at the focal point, z = 0 where the fluence is a
maximum.
Results and Discussion
Embedding nanocrystallites in stable, transparent solid
matrices is important from the point of view of the nature
of cluster-host interaction whereas it also renders the
sample in a convenient form for potential applications. The
search for convenient and economic procedures of syn-
thesis to achieve this has hence been of frontier interest.
Most of the earlier methods for the synthesis of embedded
II–VI nanocrystals were in glass matrix and involved
procedures such as high temperature melting and annealing
and the resulting size distribution of the clusters was rather
broad. On the other hand, the main advantage of synthesis
of nanocrystals in polymer matrices is the low temperature
procedure, at not more than 200 °C. The motivation for the
present work is to explore a much simpler and economic
procedure of embedding nanocrystals in a stable and
transparent matrix. The method we adopted here for the
synthesis of CdS nanocrystals based on the chemical
replacement reaction between Cd
2+
ions and S
2–
ions in a
synthetic glue matrix is a room temperature synthesis.
Within a few seconds of addition of sodium sulphide into
the aqueous solution of glue matrix containing cadmium
acetate salt, CdS nanocrystals are formed.
The CdS-synthetic glue composites have wide process-
ing flexibility enabling us to make coatings of nanometer
thickness, fibres and films depending on the requirement.
Major challenge in the nanoparticle synthesis is to produce
small size stable nanoparticles (to prevent agglomeration)
with reproducibility. Synthetic glue matrix is found to be
an excellent matrix overcoming these difficulties with an
efficient dispersion of nanoparticles.
Characterization by HRTEM, TEM, FTIR, DSC
and TGA
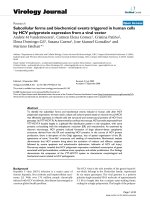
Figure 1 shows the HRTEM picture of a single CdS
nanocrystal embedded in the matrix (sample C4). The
crystallographic planes can be seen clearly in the region
corresponding to the nanocrystal. The micrograph shows
that the quasi spherical CdS nanocrystals are homoge-
nously dispersed and well separated in the host matrix. Size
distribution of the nanocrystals is found to be 3–5.7 nm
with majority of the nanocrystals in the 3 nm size range.
The mean size of 3.4 nm is determined by evaluating 290
particles.
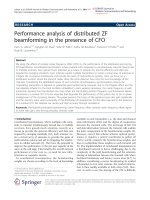
The role of polymer molecules on the surface physics of
the nanocrystals is probed by the technique of FTIR
spectroscopy. The FTIR spectrum of the host matrix is
shown in Fig. 2a. The prominent peaks observed at
1735 cm
–1
(m
C=O
), 1095 cm
–1
, 1263 cm
–1
(m
C–O
) and
1376 cm
–1
(d
CH3
) confirm the presence of poly(vinyl ace-
tate) (PVAc). The spectrum is similar to the standard IR
spectrum of PVAc. (Sprouse collection of IR, card no.187–
189). The peak at 1711 cm
–1
in the FTIR spectrum of the
CdS embedded glue (sample C4) (Fig. 2b) corresponds to
the C=O stretching frequency whereas in the host glue
matrix the C=O stretching frequency is at 1735 cm
–1
.This
decrease in stretching frequency can be attributed to
interaction of metal ion with the C=O group. When cad-
mium acetate is added to the aqueous solution of glue, Cd
2+
ions are homogeneously dispersed in the matrix. The –C=O
groups present in the polymer side chain interact with the
Cd
2+
ions and stabilize it. On the addition of aqueous
Nanoscale Res Lett (2007) 2:561–568 563
123
solution of Na
2
S, Cd
2+
ions in the host matrix react with
S
2–
forming CdS. The CdS nanocrystals thus formed are
surrounded by the polymer chains, preventing further dif-
fusion of CdS nanocrystals and thus controlling the growth
process at room temperature.
Differential scanning calorimetry (DSC) experiments
(figures not shown) indicate that the glass transition tem-
perature (T
g
= 52.9 °C) remains the same for the host glue
matrix and the CdS nanocrystals embedded host matrix.
This shows that the physical properties of the polymer are
retained even after the in-situ formation of CdS nano-
crystals. Figure 3 shows the thermograms of synthetic glue
host matrix and CdS/glue nanocomposite (sample C4)
obtained under air atmosphere. The onset temperature
(corresponding to a loss of 10 mass%) is found to be the
same, 270 °C, for both the host matrix as well as CdS-
incorporated host matrix. A more accurate measure of the
thermal stability of a material is T
o
, the temperature cor-
responding to the maximum weight loss rate (dm/dT)
max
in
the first decomposition reaction. This temperature is found
to be 314 °C for both the host matrix and the CdS/glue
nanocomposite, indicating that the presence of CdS nano-
crystals does not affect the thermal stability of the host
matrix.
Optical Absorption and Photoacoustic Spectra
Figure 4 shows the optical absorption spectra (OAS) of
CdS nanocrystals in glue matrix of samples C1, C2, C3 and
C4. The host matrix shows no absorption in the wavelength
range under consideration. Second derivative of the optical
absorption spectrum indicates that the absorption onset is at
2.64 eV. The spectrum shows a considerable blueshift from
the bulk absorption onset of 2.38 eV.
The optical absorption spectra of semiconductor nano-
crystals are known to show a blueshifted absorption onset
with features due to exciton absorption, as observed in the
present work, from which it is difficult to get detailed
information about the exciton transitions. On the other
hand, a more direct measurement of the spectral features of
the absorbed energy can be obtained from PAS which
enables to observe better resolved bands. This is because
large optical density and scattering from the sample tend to
make the signal to noise ratio poor in the case of the optical
absorption experiment where it is the intensity of the
Fig. 1 HRTEM image showing well dispersed CdS nanocrystals in
synthetic glue matrix
Fig. 2 FTIR spectrum of (a) PVAc glue matrix (b) CdS/Glue nanocomposite
564 Nanoscale Res Lett (2007) 2:561–568
123
transmitted beam that is measured. However, these factors
do not cause any problem to the photoacoustic response of
the sample. Hence we measured the photoacoustic response
of the samples in a home made PA spectrometer.
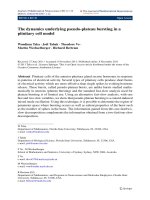
Figure 5a shows the photoacoustic spectra of CdS
nanocrystals in host matrix. The photoacoustic spectrum
(PAS) of the host matrix is featureless in the wavelength
range under consideration. Figure 5b shows PAS of sample
C4. The spectrum shows a multipeak structure. The spec-
trum is analysed using a curve fitting program assuming
Gaussian line shape. The analysis yields four peaks at
2.69 eV (denoted as E1 band), 2.81 eV (E2 band), 2.96 eV
(E3 band) and 3.21 eV (E4 band). The full width at half
maximum (FWHM) of first excitonic transition obtained
from PAS is 0.14 eV, in good agreement with that of the
first excitonic transition obtained from optical absorption
spectroscopy.
The mean diameter of the nanocrystals in the present
study is 3.4 nm, corresponding to the regime of strong
confinement, where Coulomb interaction effects can be
neglected [11]. So we use a non interacting particle model
(NIP) [10, 30] to assign the four bands obtained from
photoacoustic spectroscopy. NIP is based on effective mass
approximation (EMA) model where Coulomb interaction
of the electron-hole pair is neglected. Therefore the exciton
Hamiltonian can be written as
H ¼À
h
2
8p
2
m
e
r
2
e
À
h
2
8p
2
m
h
r
2
h
þ V
e
ðr
e
ÞþV
h
ðr
h
Þð1Þ
where the first two terms on the R.H.S are the kinetic
energies of the electron and hole respectively, V
e
and V
h
are the potentials experienced by the electron and hole
respectively due to the barrier and m
e
and m
h
are the
effective masses respectively. The confinement potential
may be defined as
V
i
ðr
i
Þ¼0 for r
i
\ R
¼1for r
i
[ R (i = e; h)
where R is the radius of the spherical nanocrystal.
In this model, hole and electron energy levels in the
nanocrystal can be expressed as
E
h
n;l
¼
À"h
2
n
2
n;l
2m
h
R
2
ð2Þ
and
E
e
n;l
¼ E
g
þ
"h
2
n
2
n;l
2m
e
R
2
ð3Þ
where n
n,1
is the nth zero of the spherical Bessel function.
Optical transitions will occur at energies
"hx ¼ E
g
þ E
e
n;l
À E
h
n;l
¼ E
g
þ
h
2
8p
2
m
r
n
2
n;l
R
2
"#
ð4Þ
where m
r
is the reduced effective mass of the electron-hole
pair,
1
m
r
¼
1
m
e
þ
1
m
h
ð5Þ
Theoretical models such as EMA and tight binding (TB)
model tend to overestimate the exciton transition energies
in nanocrystals of smaller diameter compared to the
transition energies obtained from the experimental results
[31–33]. At the same time, both theory and experiment
agree well in the case of nanocrystals of larger diameters.
In the case of smaller nanocrystals the disagreement
between theory and experiment may be due to using bulk
Fig. 3 TGA curves for glue matrix (solid line) and CdS/Glue
nanocomposite (dashed line)
Fig. 4 Optical absorption spectra of CdS/Glue nanocomposite films
of different concentrations
Nanoscale Res Lett (2007) 2:561–568 565
123
material parameters such as effective mass and bandgap as
numerical inputs to the theory. The main advantage of this
method of analysis, used in the present work and proposed
for the first time by Nandakumar et al [13], is that it
eliminates the use of bulk parameters in the calculation.
Including Coloumb interaction into the calculations would
make the analysis more complete, though it has not been
taken up as part of the present work in view of the strong
confinement.
Nandakumar et al. have used photoacoustic spectros-
copy to analyze the electronic transitions in CdS
nanocrystals and presented [12, 34] a comparison between
the experimental and theoretical determination of transition
energies in which the bulk material parameters such as
effective masses and bulk bandgap E
g
are eliminated. We
have followed this procedure to assign the four bands
observed in PAS. Using NIP model for spherical quantum
dots, the first few transitions are calculated and labeled as
T1, T2 etc. as shown in Table 1. In this analysis, the dif-
ference between electron and hole energies corresponding
to the transitions 1s
e
–1s
h
,1p
e
–1p
h
,1d
e
–1d
h
etc. (Table 1)
eliminates the bulk bandgap E
g
. The differences in transi-
tions are calculated in Table 2. The ratio of the differences
in transitions calculated as shown in Table 3 eliminates
effective masses m
e
and m
h
and nanocrystal radius R. The
theoretical ratios are then compared with ratios obtained
experimentally (Table 3). The theoretical ratios and
experimental ratios agree well if we assign the first four
bands observed in PAS to 1s
e
–1s
h
(band E1), 1p
e
–1p
h
(band E2), 1d
e
–1d
h
(band E3) and 2p
e
–2p
h
(band E4).
Optical Limiting Studies
The samples are found to exhibit large optical nonlinearity,
leading to optical limiting behavior. The nonlinearity is
probed using the z-scan technique. Optical limiting can be
due to a variety of nonlinear optical processes such as self
focusing, self defocusing, nonlinear scattering and nonlin-
ear absorption. Optical limiters based on nonlinear
absorption mechanisms like free carrier absorption and
multiphoton absorption are very efficient. Open z-scan
studies are done to investigate the nonlinear absorption
mechanism responsible for the observed optical limiting.
The z-scan experiment is performed with the samples C1,
C2, C3 and C4. For the samples C1 and C2, the concen-
tration was not sufficient to show optical nonlinearity.
Figure 6a and b show the optical limiting curves for sample
C3 and C4 respectively. The optical limiting curves are
extracted from open z-scan data. Transmission values are
normalized to the value obtained for the lowest input
Fig. 5 (a) Photoacoustic
spectra of CdS/Glue
nanocomposite films (b)
Photoacoustic spectrum of CdS/
Glue nanocomposite (circles)
along with Gaussian fit (solid
line). Deconvoluted peaks
corresponding to excitonic
transitions (dashed lines)
Table 1 First few transition energies calculated for spherical quan-
tum dots using noninteracting particle model
Level Transition n
n,l
dE
T1 1s
e
–1s
h
3.1416
ð3:1416Þ
2
m
r
h
2
8p
2
R
2
T2 1p
e
–1p
h
4.4934
ð4:4934Þ
2
m
r
h
2
8p
2
R
2
T3 1d
e
–1d
h
5.7635
ð5:7635Þ
2
m
r
h
2
8p
2
R
2
T4 2s
e
–2s
h
6.2832
ð6:2832Þ
2
m
r
h
2
8p
2
R
2
T5 2p
e
–2p
h
7.7523
ð7:7253Þ
2
m
r
h
2
8p
2
R
2
T6 2d
e
–2d
h
9.0950
ð7:7253Þ
2
m
r
h
2
8p
2
R
2
Table 2 Difference between transition energies corresponding to
1s
e
–1s
h
,1p
e
–1p
h
,1d
e
–1d
h
,2s
e
–2s
h
,2p
e
–2p
h
,2d
e
–2d
h
(Table 1)
Transition differences Energy in units of
h
2
8p
2
R
2
m
r
T2–T1 (4.4934
2
– 3.1416
2
)
T3–T2 (5.7635
2
– 4.4934
2
)
T4–T2 (6.2832
2
– 4.4934
2
)
T5–T2 (7.7253
2
– 4.4934
2
)
T6–T2 (9.0950
2
– 4.4934
2
)
Table 3 The ratio of the differences in transition energies calculated
theoretically and experimentally
Theoretical values Experimental values
T3ÀT2
T2ÀT1
1.262
E3ÀE2
E2ÀE1
1.25
T4ÀT2
T2ÀT1
1.869
T5ÀT2
T2ÀT1
3.827
E4ÀE2
E2ÀE1
3.33
T6ÀT2
T2ÀT1
6.059
566 Nanoscale Res Lett (2007) 2:561–568
123
fluence, which is taken as unity. The circles denote the
experimental data and solid line denotes the theoretical fit.
Since the wavelength chosen for the study is in the off
resonant regime where the photon energy 2.33 eV is less
than the fundamental absorption edge 2.69 eV, the exper-
imental data are analysed using a model incorporating
saturable absorption followed by two photon absorption
(2PA). We consider a nonlinear absorption coefficient of
the form [35]
a IðÞ¼
a
o
1 þ
I
I
s
þ bI ð6Þ
where a
o
is the linear absorption coefficient, b is the 2PA
coefficient, I is the laser intensity and I
s
is the saturation
intensity. Therefore the modified normalized transmittance
using Eq. (6) can be written as
TðzÞ¼
QðzÞ
ffiffiffi
p
p
qðzÞ
Z
1
À1
ln½1 þ qðzÞexpðÀs
2
Þds ð7Þ
where QðzÞ¼expða
o
LI
=
ðIþI
s
ÞÞ; qðzÞ¼bI
o
L
eff
1þ z
=
z
o
ðÞ
2
with I
o
being the peak intensity at the focal point and
L
eff
¼ 1 À exp Àa
o
LðÞ½
=
a
o
where L is the sample length
and z
o
¼ px
2
o
k, where x
o
is the beam waist and k is the
wavelength of the exciting light.
The experimental data and theoretical fit are in good
agreement, indicating that the mechanism of nonlinear
absorption here is 2PA. The values of b and I
s
are found to be
b = 1.9 · 10
–9
m/W and I
s
= 2.3 · 10
12
W/m
–2
respec-
tively, at 4.33 · 10
9
W/cm
2
(corresponding to laser energy
80 lJ) for both the samples C3 and C4 indicating there is no
accumulative optical nonlinearity with the increase in con-
centration. Eventhough TPA appears to be the predominant
mechanism, free carrier absorption also could be operative.
The absorption spectrum shows a long wavelength tail
absorption which can be due to the defect levels arising from
sulphur vacancies which are located below the conduction
band in bulk CdS [36]. The evidence for this defect level
emission in CdS nanocrystals has been reported previously
[12, 37]. So, when excited with a photon of energy 2.33 eV,
the carriers may get excited to this defect level and free
carrier absorption from these levels may happen as the
experiments are done with pulses of nanosecond duration.
Conclusion
Free standing films of CdS quantum dots of mean size
3.4 nm are synthesized by a simple chemical route using
synthetic glue as the host matrix. The excitonic transitions
are studied using photoacoustic spectroscopy and analyzed
in detail using noninteracting particle model. We assign the
first four bands observed in PAS to 1s
e
–1s
h
(band E1),
1p
e
–1p
h
(band E2), 1d
e
–1d
h
(band E3) and 2p
e
–2p
h
(band
E4). The origin of the optical limiting behavior is probed
using z-scan technique with nanosecond laser pulses in the
off resonant regime ðE
g
[ "hx [ E
g
=2Þ at 532 nm. The
experimental data are analysed using a model incorporating
saturable absorption followed by two photon absorption.
The optical limiting behaviour is found to be predomi-
nantly due to two photon absorption process. Nano-
composite films in the present work have the advantages of
large optical nonlinearity and transparency apart from low
cost, reproducibility and ease of preparation. They also
have high optical, thermal, and chemical stability and
hence render the nanocrystals in form convenient for
device applications.
Acknowledgments Financial assistance from Govt. of India is
gratefully acknowledged. The authors PAK and CV also wish to
acknowledge the Department of Science and Technology Unit on
Nanoscience, IIT Madras for help in recording high resolution
transmission electron micrographs.
References
1. D. Cotter, M.G. Burt, R.J. Manning, Phys. Rev. Lett. 68, 1200
(1998)
2. G.P. Banfi, V. Degiorgio, D. Ricard, Adv. Phys. 47, 447 (1998)
3. J. He, W. Ji, G.H. Ma, S.H. Tang, E.S.W. Kong, S.Y. Chow,
X.H. Zhang, Z.L. Hua, J.L. Shi, J. Phys. Chem. B 109, 4373
(2005)
Fig. 6 Normalized
transmittance of the samples C3
(a) and C4 (b) at an excitation
intensity 4.33 · 10
9
W/cm
2
as a
function of the input fluence.
Solid line is a numerical fit to
the experimental data using
Eq. (7)
Nanoscale Res Lett (2007) 2:561–568 567
123
4. W. Jia, E.P. Douglas, F. Guo, W. Sun, Appl. Phys. Lett. 85, 6326
(2004)
5. N. Venkatram, D. Narayana Rao, M.A. Akundi, Opt. Express 13,
867 (2005)
6. K.S. Bindra, A.K. Kar, Appl. Phys. Lett. 79, 3761 (2001)
7. R.A. Vaia, J.F. Maguire, Chem. Mater. 19, 2736 (2007)
8. K.I. Winey, R.A. Vaia (eds.,) Polymer Nanocomposites, (MRS
Bulletin, Materials Research Society, Pittsburgh, PA, 2007)
9. H.P. Li, C.H. Kam, Y.L. Lam, W. Ji, Opt. Commun. 190, 351
(2001)
10. AlL. Efros, A.L. Efros, Sov. Phys. Semicond. 16, 772 (1982)
11. U. Woggon, Optical Properties of Semiconductor Quantum Dots
(Springer, Berlin, 1997)
12. P. Nandakumar, C. Vijayan, Y.V.G.S. Murty, J. Appl. Phys. 91,
1509 (2002)
13. C.B. Murray, D.J. Norris, M.J. Bawendi, J. Am. Chem. Soc. 115,
8706 (1993)
14. D.J. Norris, Al.L. Efros, M. Rosen, M.G. Bawendi, Phys. Rev B
53, 16347 (1996)
15. M.C. Klein, F. Hache, D. Ricard, C. Flytzanis, Phys. Rev. B 42,
11123 (1990)
16. Al.L. Efros, A.I. Ekimov, F. Kozlowski, V. Petrova-Koch, H.
Schmidbaur, S. Shumilov, Solid State Commun. 78, 853 (1991)
17. Y. Wang, W. Mahler, Opt.Commun. 61, 233 (1987)
18. P. Nandakumar, C. Vijayan, Y.V.G.S. Murty, Opt.Commun. 185,
457 (2000)
19. Y. Wang, A. Suna, J. McHugh, E.F. Hilinski, P.A. Lucas, R.D.
Johnson, J. Chem. Phys. 92, 6927 (1990)
20. H. Yao, S. Takahara, H. Mizuma, T. Kozeki, T. Hayashi, Jpn. J.
Appl. Phys. part 1 35, 4633 (1996)
21. T. Miyoshi, N. Matsuo, P. Maly, F. Trojanek, P. Nemec,
J. Kudrna, J. Mater. Sci. Lett. 20, 343 (2001)
22. V. Klimov, P. Haring Bolivar, H. Kurz, Phys. Rev. B 53, 1463
(1996)
23. V.I. Klimov, Ch.J. Schwarz, D.W. Mcbranch, Phys. Rev. B 60,
R2177 (1999)
24. J. He, W. Ji, G.H. Ma, S.H. Tang, E.S.W. Kong, S.Y. Chow, X.H.
Zhang, Z.L. Hua, J.L. Shi, J. Phys. Chem. B 109, 4373 (2005)
25. R.E. Schwerzel, K.B. Spahr, J.P. Kurmer, V.E. Wood, J.A. Jenkins,
J. Phys. Chem. A 102, 5622 (1998)
26. H. Du, G.Q. Xu, W.S. Chin, L. Huang, W. Ji, Chem. Mater. 14,
4473 (2002)
27. P.A. Kurian, C. Vijayan, C.S. Suchand Sandeep, R. Philip,
K. Sathiyamoorthy, Nanotechnology 18, 075708 (2007)
28. A. Rosencwaig, A. Gersho, J. Appl. Phys. 47, 64 (1977)
29. M. Sheik-Behae, A.A. Said, T.M. Wei, D.J. Hagan, E.W. Van
Stryland, IEEE J. Quantum Electron 26, 760 (1990)
30. Y.V.G.S. Murti, P. Nandakumar, C. Vijayan, Phys. Educ. 16, 229
(1999)
31. Y. Wang, N. Herron, Phys. Rev. B 42, 7253 (1990)
32. P.E. Lippens, M. Lanoo, Phys. Rev. B 39, 10935 (1989)
33. S.V. Nair, L.M. Ramaniah, K.C. Rustagi, Phys. Rev. B 45, 5969
(1992)
34. P. Nandakumar, A.R. Dhobale, Y. Babu, M.D. Sastry, C. Vijayan,
Y.V.G.S. Murti, K. Dhanalakshmi, G. Sundararajan, Solid State
Commun. 106, 193 (1998)
35. Y. Gao, X. Zhang, Y. Li, H. Liu, Y. Wang, Q. Chang, W. Jiao,
Y. Song, Opt. Commun. 251, 429 (2005)
36. E.F. Hilinski, P.A. Lucas, Y. Wang, J. Chem. Phys. 89, 3435
(1988)
37. K. Misawa, H. Yao, T. Hayashi, T. Kabayashi, Chem. Phys. Lett.
183, 113 (1991)
568 Nanoscale Res Lett (2007) 2:561–568
123