Báo cáo hóa học: " Research Article Bandwidth Optimization in Centralized WLANs for Different Traffic Types" pdf
Bạn đang xem bản rút gọn của tài liệu. Xem và tải ngay bản đầy đủ của tài liệu tại đây (2.85 MB, 14 trang )
Hindawi Publishing Corporation
EURASIP Journal on Wireless Communications and Networking
Volume 2007, Article ID 23917, 14 pages
doi:10.1155/2007/23917
Research Article
Bandwidth Optimization in Centralized WLANs for
Different Traffic Types
R. J. Haines, N. Fanning, T. Lewis, and J. Coon
Telecommunications Research Laboratory, Toshiba Research Europe Ltd., 32 Queen Square, Bristol BS1 4ND, UK
Received 31 May 2006; Revised 24 November 2006; Accepted 10 January 2007
Recommended by Wei Li
Allocating bandwidth between different forms of coexisting traffic (such as web-browsing, streaming, and telephony) within a
wireless LAN is a challeng ing and interesting problem. Centralized coordination functions in wireless LANs offer several advan-
tages over distributed approaches, having the benefit of a system overview at the controller, but obtaining a stable configuration
of bandwidth allocation for the system is nontrivial. We present, review, and compare different mechanisms to achieve this end,
and a number of different means of obtaining the configurations themselves. We describe an analytical model of the system un-
der consideration and present two mathematical approaches to derive solutions for any system configuration and deployment,
along with an adaptive feedback-based solution. We also describe a comprehensive simulation-based model for the problem, and
a prototype that allows comparison of these approaches. Our investigations demonstrate that a self-adaptive dynamic approach
far outperforms any static scheme, and that using a mathematical model to produce the configurations themselves confers several
advantages.
Copyright © 2007 R. J. Haines et al. This is an open access article distributed under the Creative Commons Attribution License,
which permits unrestricted use, distribution, and reproduction in any medium, provided the original work is properly cited.
1. INTRODUCTION
The IEEE802.11 protocols [1] have b ecome the dominant
standard for wireless local area networks (WLANs). These
protocols have evolved to support a variety of traffictypes,
whichbenefitfromdifferent scheduling and control mecha-
nisms. There are two common forms of traffic encountered
by WLANs. The first is sporadic, bursty data traffic, w hich
is most efficiently served by highly distributed contention-
based access schemes. The second is traffic with stringent
quality-of-service (QoS) requirements, such as bandwidth,
delay and/or jitter, which needs a more structured approach
to provide guarantees of access.
There are two complementary approaches to serving
QoS-sensitive traffic: distributed and centralized access [2].
Distributed approaches have largely focused on differenti-
ated access that prioritizes different traffic types but then re-
lies on statistical guarantees of access for each priority level,
although more recent developments also incorporate a dis-
tributed reservation mechanism [3]. Centralized approaches,
where a central controller allocates resources, benefit from
having a global view of the entire system, and from being
able to concentrate complexity in a single (more feature-rich,
more expensive, higher-powered) device.
The IEEE802.11 standards offer both centralized and dis-
tributed controls. In this work, we concentrate on the cen-
tralized point coordination function (PCF), which can be
seen as a specialized case of the more flexible and complex
hybrid coordination function (HCF) of IEEE802.11e [4].
These centralized approaches are most att ractive in single-
access-point scenarios such as commonly found in the home,
as there are scheduling complexities that arise with multiple-
access-point scenarios. The PCF allows the coexistence of
both QoS-sensitive traffic and bursty data traffic through the
polling of the former and the direct contention of the latter.
This is achieved by overlaying a repeating time-division su-
perframe onto the medium, w ith distinct phases for polled
and contending traffic.
The configuration of this superframe directly affects the
system’s ability to support the two types of trafficeffectively.
If the configuration is badly wrong, then the QoS require-
ments may be missed, or the data traffic starved of access.
Balancing these two competing classes of trafficinanopti-
mal way is the fundamental subject of this work.
Published work in this specific area of configuring the
superframe has, to date, relied on empirical, simulation-
based studies of different scenarios to derive lookup tables
2 EURASIP Journal on Wireless Communications and Networking
of superfr ame configurations [5]. This work improves upon
these studies with a more comprehensive and accurate sim-
ulation model, and then goes on to propose novel solutions
to this problem that have sound mathematical foundations
and offer a more dynamic approach. This more flexible and
adaptable approach al lows a continuous optimized set of su-
perframe parameters to be derived and the more theoretical
basis permits greater confidence in the optimal nature of the
values being employed than is possible with purely experi-
mental results.
This paper is structured as follows: in Section 2 the
IEEE802.11 PCF is explained to give a background to this
problem area. In Section 3 we examine related work in this
area and highlight how this contribution differs from, and
improves upon, what has gone before. Section 4 presents
our simulation model that improves upon that in the lit-
erature, whilst Sec tions 5 and 6 describe our mathemati-
cal approaches to this problem. In Section 7 we describe a
simulation prototype that allows direct comparison of all of
these approaches. Finally, in Section 8,weconcludethispa-
per.
2. IEEE802.11 CENTRALIZED CONTROL
The IEEE802.11 standard [1] was created as a wireless al-
ternativetowiredlocalareanetworks(LANs),whichat
that time were predominately deployed in office e n viron-
ments to carry internet data traffic. Nonetheless, even at that
time, it was recognized that support for QoS-sensitive traf-
fic would be required. To achieve this, two complementary
access schemes were specified, the best-effort contention-
based distributed coordination function (DCF) for delay-
insensitive traffic, and the optional centralized polling-based
point coordination function (PCF) for time-bounded traffic,
such as audio/video streams and voice over internet protocol
(VoIP) traffic.
DCF is the mandatory access mechanism in IEEE802.11.
For sporadic bursty data traffic, this offers a very efficient
means of access: devices (stations, STA, in IEEE802.11
parlance) can compete for access to the medium as soon
as they have a packet to transmit. The underlying access
scheme is carrier-sense multiple access with collision avoid-
ance (CSMA/CA). Multiple access and collision avoidance
are achieved with a combination of prerequisite quiet peri-
ods on the medium (hence the carrier sense) followed by ran-
dom backoffs to avoid collisions. The durations of the quiet
periods (termed interframe spaces) prioritize access onto the
medium. For example, the shortest interframe space (short
interframe space, SIFS) is used between the transmission of a
packet and the transmission by the receiving station of its ac-
knowledgment. Transmission of this acknowledgement has
the highest priorit y of any packet (as it is the only means by
which the transmitting station can be aware of successful de-
livery, and therefore not retransmit the or iginal packet), so it
is allowed onto the medium with the shortest possible inter-
frame space following the end of the original packet trans-
mission. Stations newly contending for access must wait for
a much longer interframe space (the DCF interframe space,
Beacon
CFP CP
Beacon
CFP
MAX
CFP
REP
Figure 1: Superframe structure.
DIFS) before even being able to contend for access with the
random backoff procedure.
However, for QoS-sensitive traffic where a packet must
be sent at a guaranteed time, contending for access (and po-
tentially losing) with every packet quickly becomes impos-
sible under all but the lightest of network loads. To guar-
antee packet transmission, reservation and polling schemes
must be considered. In these cases, the additional overhead
of reserving a transmission in advance becomes acceptable.
The centralized PCF of the original IEEE802.11 standard,
and its progeny, the hybrid coordination function (HCF) in
the IEEE802.11e standard [4], both introduce centralized co-
ordination of resources to allow this QoS-sensitive trafficto
coexist alongside contention-based data exchanges. The dif-
ference between the two is that HCF allows a more flexible
allocation of transmission opportunities compared to PCF,
although this is a t the cost of increased complexity.
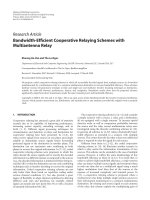
Centralized coordination imposes a time-based repeat-
ing superframe onto the medium (as illustrated in Figure 1),
characterized by the tr ansmission of a broadcast beacon, fol-
lowed by a contention-free (polled) period (CFP) and then a
contention-based access period (CP). The process of overlay-
ing this structure onto the otherwise anarchic access mech-
anism of DCF is possible through the aforementioned inter-
frame spaces: the central controller is able to use the PCF in-
terframe space (PIFS), of shorter duration than the DIFS, to
preempt contending stations and seize the medium to begin
the superframe.
The structure of the superframe is determined by two
parameters, its duration and the proportion of time spent
in the contention-free phase. This duration (i.e., the bea-
con and CFP repetition rate) and the relative size of the CFP
to the rest of the superframe, typically termed CFP
REP
and
CFP
MAX
, respectively, are both configurable by the point con-
troller (PC) entity located at the access point (AP). These two
values are broadcast in the beacon to all stations.
These parameters determine the success of a given
WLAN deployment from the perspect ive of the polled traf-
fic, the contention-based traffic, or both. A badly configured
system will fail to deliver the performance that the end user
has the right to expect, irrespective of the headline data rate
of the product.
3. RELATED WORK
The distributed approach to serving QoS-sensitive traffichas
been closely studied in recent years, both in the guise of the
enhanced distributed channel access (EDCA) subset of the
R. J. Haines et al. 3
IEEE802.11e HCF [4] and in the WiMedia MAC [3](formed
from one of the survivors of the now-defunct IEEE802.15.3a
standard). The latter offers extensions to the IEEE802.11e
EDCA subset including a fully distributed solution includ-
ing both hard and soft reservations of slots (soft reservation
being the ability for a station to tentatively reserve a slot, and
for it to be made available for other stations if unused). The
performance of the WiMedia MAC has been evaluated, and
the soft-reservation scheme is found to be particularly effi-
cient [6]. A number of extensions and enhancements to these
distributed schemes have been proposed from a number of
different perspectives, the sheer number of which suggesting
that there are several shortcomings to this approach. These
extensions have included the use of admission control [7]
by the higher layers, the addition of hybrid automatic repeat
request (ARQ) mechanisms [8] and variable backoffs(con-
tention windows) [9, 10] to the MAC protocol, and cross-
layer schemes linking the differentiated access categories to
the modulation and coding schemes of the physical layer
[11].
The centralized approach has been less well studied, often
because a distributed solution is viewed as being inherently
more scalable and less complex [12]. However, under heavy
and asymmetric loads such as would result from stream-
ing high-definition television and similar demanding appli-
cations, it has been observed that the distributed approach
results in a severe impact on the coexisting trafficstreams
[13, 14]. The complexity of the 802.11e HCF scheme has
been highlighted as an issue, and an enhanced PCF (EPCF)
has been proposed [15] to address some issues with PCF that
HCF also addresses, whilst not imposing all of the complexity
of HCF.
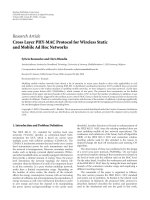
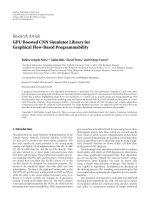
A self-adaptive scheme to configure the PCF superframe
has been proposed [5]. This proposed scheme selects param-
eters from predefined lookup tables indexed by a quantized
number of active polled stations and stepped values for the
maximum allowable delay of the applications. The values
populating the lookup tables are derived through experimen-
tal simulation results, which result in values of an almost ran-
dom nature, as depicted in Figure 2.
These results do not take into account the minimum CFP
and CP sizes mandated by the standard [1, 16], and crucially,
there is no means of generating values outside of the simula-
tion scenarios considered. Nonetheless, these values provide
a valuable benchmark for the approaches considered herein.
The traffic considered in this benchmark study is a combi-
nation of data and VoIP flows, an import ant area for inves-
tigation as internet telephony applications continue to gain
popularity.
4. IMPROVED EMPIRICAL RESULTS
An improved (standard-compliant) simulation model, us-
ing the configuration proposed in [5], has been developed
in OPNET.
The network model is constrained to 16 STAs and an AP
throughout the study presented herein, with all stations lo-
cated within a 300 m diameter. All 16 STAs produce voice
100
90
80
70
60
50
40
30
20
Benchmark CFP repetition
interval (ms)
20
18
16
14
12
10
8
6
4
2
Number of voice nodes
50
100
150
200
Voice delay constraint (ms)
Figure 2: Benchmark CFP
REP
values.
Voice
generator
Data
generator
Separate voice
and data queues
Tx
Rx
MAC
Figure 3: Node model.
traffic but only 6 of them produce data traffic. The PC func-
tion is performed in the AP which is the destination for
all transmissions. The AP transmits only MAC control and
management frames, such as ACKs, polls, and beacons.
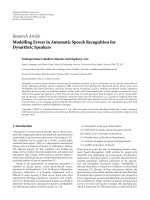
An STA based on a generic node model (Figure 3)gen-
erates voice and potentially data application trafficalong
with the necessary MAC control frames. The different traf-
fic streams are buffered in individual queues until the frames
are transmitted. The data queue is served during the CP and
the voice queue is served during the CFP. The interval be-
tween successive data MAC service data unit (MSDU) gener-
ations varies exponentially with a mean of 7.5 frames per sec-
ond (fps). The data MSDUs vary exponentially in size with a
mean of 1000 bytes. Brady’s model [17] is employed for the
voice traffic generator, which produces 200-byte MSDUs. To
preventidleCFPsandsuddentraffic surges, the start times of
the voice generators are random over the first two s econds of
the simulation.
The AP model, which is based on the generic node
model, controls the CFP with the transmission of beacons,
polls, and CFP end (CF-END) frames using the PC function.
4 EURASIP Journal on Wireless Communications and Networking
Table 1: Summary of model parameters.
Parameter Value Parameter Value
Slot 20 μs Mean data MSDU 1 kbyte
SIFS 10 μs
Mean data rate 7.5 fps
PIFS 30 μs
Voice MSDU 200 bytes
DIFS 50 μs
Voice mean on : off 1s:1.35 s
CW
MIN
31 slots Voice on rate 64 kbps
PLCP time 192 μs
Beacon 160 bytes
MAC header 28 bytes
ACK 14 bytes
Data rate 2 Mbps
Poll\CF
end
20 bytes
Control rate 1 Mbps
Queue sizes 250 Kbits
The AP responds to received data MPDUs with acknowledge-
ments (ACKs) during the CPs. The QoS performance is also
measured in the AP model as it provides sinks for the two
types of traffic. The p olling list, which consists of all 16 STAs,
is cycled through continuously during the CFP. When a voice
MPDU has been received in response to a poll frame, the AP
acknowledges its reception in the proceeding poll frame by
setting the fr ame type field to be a combined poll and ac-
knowledgment. If a node does not have any voice packets
queuedwhenpolled,itrespondswithanulldataframe.At
the beginning of a CFP, the polling is resumed where the pre-
vious CFP ended. If sufficient time remains in a CFP after all
nodes have been polled, the polling cycle begins again. Intel-
ligent polling schemes, such as biasing the polling to nodes
that did not previously respond [18–20], are not utilized in
this study. A check is made to ensure that sufficient time re-
mains in the CFP to accommodate a polled voice frame ex-
change (i.e., poll + voice MSDU + 2SIFS + CF-END) prior
to e very poll transmission. An early CF-END is transmitted
if insufficient time remains.
No check is made during the CP to ensure that the DCF
access mechanism frame exchange sequence (DIFS + CW +
data + SIFS + ACK) will be complete before the next ex-
pected beacon transmission. This will occasionally result in
CP stretching which will shorten the duration of the proceed-
ing CFP.
An IEEE802.11b physical layer (PHY) is assumed as this
provides a fair comparison with the referenced work in this
area. The fundamental behavior of a MAC is largely inde-
pendent of the PHY technology, and when performing com-
parisons between different MAC solutions, the specifics of
the PHY are not particularly relevant. The physical layer is
modeled so that packet losses due to link errors do not occur.
Packet losses occur due to collisions only, and so observa-
tions on the performance can be described purely in terms
of MAC behavior. It is also assumed that there are no hidden
stations, the capture effect does not occur, and none of the
stations are in power-saving mode. The model parameters
are summarized in Tabl e 1.
Table 2: Simulated CFP
MAX
and CFP
REP
values.
Parameter Values
CFP
MAX
(%)
5, 10, 15, 20, 25, 30, 35, 40, 45, 50, 55,
60, 65, 70, 75, 80, 85, 90, 95
CFP
REP
(ms)
50, 60, 70, 80, 90, 100, 110, 120, 130,
140, 150, 160, 170, 180, 190, 200, 210,
220, 230, 240, 250
0.5
0.45
0.4
0.35
0.3
0.25
0.2
0.15
0.1
0.05
0
Mean voice traffic
throughput (Mbps)
250
200
150
100
50
CFP repetition interval (ms)
0
20
40
60
80
100
CFP maximum ratio (%)
Figure 4: Mean voice throughputs.
Generally, the voice traffic has the more stringent perfor-
mance requirements of the two traffic types. Therefore, the
performance of the CFP, and that of the associated voice traf-
fic, is focused on in the presentation of the results. Failure to
satisfy these requirements results in wasted transmissions as
packets received outside of the QoS constraints will proba-
bly be dropped at the transport or application layer. The ap-
proach taken is to determine how to configure the system so
that the time-dependent voice traffic is satisfied whilst en-
suring that the maximum possible amount of medium time
remains for data traffic.
Simulations have been performed for all permutations of
the CFP
MAX
and CFP
REP
settings contained in Ta ble 2. This
provided 399 simulations each covering 5 minutes of simu-
lated time. However, some of the CFP
MAX
and CFP
REP
com-
binations will result in CP and CFP durations that are less
than the minimum mandated by the standard. These invalid
permutations can be discounted at a later stage.
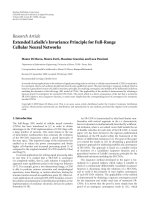
The first set of simulation results is the mean voice traffic
throughputs, which are illustrated in Figure 4.SixteenSTAs
produce approximately 435 kbps of voice traffic within the
network. The voice traffic throughput results show that the
CFP
MAX
value has to be around 45% and above so that al l of
the voice traffic generated can be accommodated.
It is not sufficient to concentrate solely on providing the
necessary resource to accommodate all of the voice trafficto
produce a successful system. The delay that is experienced is
arguably more important for time-dependent voice services.
The mean delays experienced by the voice traffic during the
R. J. Haines et al. 5
10
3
10
2
10
1
Mean voice trafficdelay(ms)
50
100
150
200
250
CFP repetition interval (ms)
95
90
85
80
75
70
65
60
CFP maximum ratio (%)
Figure 5: Mean voice delays.
simulations are illustrated in Figure 5.CFP
MAX
values below
60% incur significant delays so only a subset of the CFP
MAX
results is included. The CFP
MAX
value of 45% suggested by
the mean voice throughput results will result in voice delays
in excess of three seconds, which is unacceptable for tele-
phony services. Voice transmission requires delays below 25
milliseconds if echo cancellation is not available, 150 mil-
liseconds for high quality with echo cancellation, and 400
milliseconds for acceptable quality with echo cancellation
[21]. The results show that CFP
MAX
values in the region of
70% and above are required to achieve mean delays below
150 milliseconds.
The mean voice delay results can generate a lookup ta-
ble to select CFP
MAX
and CFP
REP
values that result in a given
delay. They can also predict the performance of a particu-
lar superframe configuration generated by an optimization
algorithm. This allows different optimization techniques to
be compared. The most interesting observation of Figure 5
is the apparent immunity to CFP
REP
variations that the near
horizontal contours suggest.
Despite having similar mean delays, the probability den-
sity functions (PDFs) of instantaneous voice packet delays for
given CFP
REP
values are quite different. Figure 6 illustrates
the distribution of delays that were experienced for a sub-
set of the CFP
REP
values with a constant CFP
MAX
of 70%.
This value of CFP
MAX
provides mean delays in the region of
150 milliseconds. The distributions contain two peaks, the
first occurring at (nodes/2)
× polled-exchange duration and
the second occurring at CFP
REP
×(1 − CFP
MAX
). The former
occurs due to the average wait experienced during a polling
period, equal to half the time to poll all twelve stations and
the latter due to packets having to wait for a CP to pass.
Figure 7 presents the cumulative distribution functions
(CDFs) of the voice packet delays, and shows the percent-
age that satisfies a given delay constraint. A CDF is required
if the maximum instantaneous delay is the important per-
formance parameter. The CDF can predict the percentage of
frames that may be dropped due to the delay constraints not
being met. For a 400-millisecond instantaneous delay thresh-
old, a CFP
MAX
setting of 70% requires a CFP
REP
in the re-
gion of 170 milliseconds and above. This will provide a voice
service of acceptable quality only if echo cancellation is in-
cluded [21, 22]. The CDFs illustrate that delay distributions
can be highly CFP
REP
sensitive in certain regions. Figure 7
shows that the percentage of packets within the constraint
of 100-millisecond maximum delay varies from 65 to 85 de-
pending on the CFP
REP
setting.
Focusing on the CFP and its associated voice trafficpre-
vents valuable medium time from being wasted. However,
it is also important to understand the effect of superfr ame
configuration on the CP and the associated data traffic. Bi-
asing resource allocation to the voice traffic is only sensible
to the point where the voice services have their QoS con-
straints satisfied. Further biasing in the direction of voice
traffic provides no noticeable improvements in the perfor-
mance of voice services but it results in a noticeable degrada-
tion of the data services.
The data traffic throughput results, illustrated in Figure
8, show that values of CFP
MAX
below approximately 80%
are required to support all of the data traffic (360 Kbps)
generated in the given scenario. The CDF of instantaneous
voice trafficdelays,Figure 7, has demonstrated that for 70%
CFP
MAX
, a minimum CFP
REP
of 170 milliseconds is required
for acceptable voice transmission. This superframe configu-
ration provides sufficient CP capacity to fully accommodate
the generated data traffic. Higher-quality voice transmissions
demanding delays in the region of 150 milliseconds will re-
quire the superframe configuration to be biased further in
favor of the CFP. CFP
MAX
values in excess of 80% will reduce
the amount of data traffic that can be supported. Reducing
the proportion of medium time available for the CP increases
the likelihood of CP stretching as there is a greater probabil-
ity that data packets will be awaiting transmission at the end
of the CP. This CP stretching will have a negative impac t on
the CFP albeit smaller than the positive impact of increasing
the amount of resource allocated to the CFP.
5. NONLINEAR OPTIMIZATION
The first mathematical technique we propose as a candidate
solution as a verifiable theoretical model is that of nonlinear
optimization of an abstrac ted model of the data exchanges
on the superframe [23]. Nonlinear optimization theory pro-
vides a number of means to optimize a number of variable
parameters to provide a stable system solution. These tech-
niques have been applied to a number of areas within com-
munications, including wireless sensor network access [24]
and deriving training sequences for orthogonal-frequency
division multiplexing (OFDM) systems [25]. We use the bar-
rier method [26] in this work.
No matter how robust the mathematical analysis tech-
nique adopted, its success is, of course, dependent on how
closely the model being analyzed resembles reality. In the case
of nonlinear optimization, this means that the formation of
the objec tive and constraint functions is crucial. Our ap-
proach is to maximize the utilization of the contention-free
and contending phases simultaneously within a number of
6 EURASIP Journal on Wireless Communications and Networking
100 ms CFP repetition interval
5
4
3
2
1
0
Percentage of packets (%)
0 100 200 300 400 500 600
Voice p a c ket d e lay ( m s )
(a)
120 ms CFP repetition interval
5
4
3
2
1
0
Percentage of packets (%)
0 100 200 300 400 500 600
Voice p a c ket d e lay ( m s )
(b)
170 ms CFP repetition interval
5
4
3
2
1
0
Percentage of packets (%)
0 100 200 300 400 500 600
Voice p a c ket d e lay ( m s )
(c)
200 ms CFP repetition interval
5
4
3
2
1
0
Percentage of packets (%)
0 100 200 300 400 500 600
Voice p a c ket d e lay ( m s )
(d)
Figure 6: PDFs of voice packet delays at 70% CFP
MAX
.
constraints, such that the two phases’ utilizations are traded-
off against each other. Therefore, expressions for these two
phases must be carefully developed to represent the efficiency
of the resource allocation in each phase, such that the result-
ing objective function can determine how far from the ideal
each component is.
Before the model is developed, as with the preceding
simulation study, we make assumptions of a reliable physi-
cal layer channel (no link errors, no collisions), and exclude
hidden terminals, the capture-effect, and the power-saving
mechanism, and assume that all stations are fully backlogged
(i.e., they always have data to send).
Each phase is affected by two inefficiency components.
The first is the efficiency of an individual exchange (which
scales linearly with the number of exchanges) and the second
is the efficiency of the whole phase, taking into account any
unused airtime at the end of the phase.
Firstly, consider the QoS-sensitive polled traffic in the
CFP (as illustrated in Figure 9). In the case of the first com-
ponent, due to the assumption that all stations are fully back-
logged, no poll is wasted, so each packet polled from station
incurs an overhead comprising just the interframe spaces be-
tween contention-free packets (SIFS):
C
a
= 2
∗
SIFS. (1)
The second component is the wastage at the end of the
CFP if it is configured to any size not divisible exactly by the
frame exchange duration (although note that, in practice, the
central controller can terminate the CFP early and m ake this
“wasted” period available to the CP). The overall efficiency
for the CFP can be calculated as
V
N
P
=
1 −
N
p
C
b
− C
a
xy
,(2)
where C
b
is the entire polled exchange duration (ms) and C
a
is the polled exchange overhead from (1), and x and y are
CFP
MAX
and CFP
REP
, respectively. These parameters are tab-
ulated for convenience in Tab le 3 .
R. J. Haines et al. 7
100
95
90
85
80
75
70
65
60
Percentage of packets within delay constraint (%)
50 100 150 200 250 300 350 400 450 500 550
Delay constraint (ms)
100 ms
120 ms
150 ms
170 ms
200 ms
Figure 7: CDFs of voice packet delays at 70% CFP
MAX
.
0.4
0.35
0.3
0.25
0.2
0.15
0.1
0.05
Mean data traffic
throughput (Mbps)
0
20
40
60
80
100
CFP maximum ratio (%)
50
100
150
200
250
CFP repetition interval (ms)
Figure 8: Mean data throughputs for various CFP
MAX
.
PLCP
header &
preamble
MAC header
&trailer
Polled payload
V bytes
(a) Polled fr ame
PIFS
Beacon
SIFS
CF-poll + data
SIFS
CF-ACK + data
SIFS
CF-poll + data
···
(b)Mediumoccupancy
Figure 9: Polling frame model.
Table 3: Model parameter definitions and values.
Parameter Definition (value)
M
s
Standardized data exchange overhead (0.674 ms)
H
s
Standardized data exchange (4.978 ms)
C
a
Polled exchange overhead (0.02 ms)
C
b
Polled exchange duration (2.228 ms)
N
c
Number of data stations (11)
N
p
Numbers of polling stations considered (2, 4, , 20)
D
Polling rates under consideration
(75, 87.5, 100, 112.5, , 200 ms)
P
r
Contending traffic packet generation rate (0.0075 s
−1
)
CFP
MIN
Minimal CFP size (39.922 ms)
CP
MIN
Minimal CP size (21.404 ms)
PLCP
header and
preamble
MAC
header
and trailer
Data payload
D bytes
(a) Contention frame
PLCP
header and
preamble
ACK
(b) ACK Frame
DIFS +
(CW
∗
slots)
Contention frame SIFS
ACK frame
(c)Mediumoccupancy
Figure 10: Contending frame model.
The number of polled terminals, N
p
, is a parameter that
the AP can reasonably be expected to know as all stations
must associate with the AP if polling service is required.
For the CP (as illustrated in Figure 10), recall the oper-
ation of the DCF. Stations must wait for the DIFS period
of silence on the medium (with the 802.11b physical layer,
thisis50μs). If this period has elapsed without any activity
on the medium, the station then performs a random back-
off for a random number of slots (each of 20-microsecond
duration in 11b) drawn from the range [0, CW], where CW
(contention window) begins at 31 (11b again) and can in-
crease as a binary exponential up to the limit 1023.
If the station detects a transmission during the con-
tention window before its backoff has finished, then the
station has lost this particular contention to another sta-
tion (which happened to choose a smaller backoff this time
around), and it must suspend the countdown, and resume it
on a later attempt. If a station gains access but experiences
a collision on transmission, it will increase the size of CW
for the next attempt. However, the “no collisions”assump-
tion can be used to simplify this mechanism by freezing CW
at its smallest value of 31, and taking the mean CW value of
15.5 for every contention. If every contention is assumed to
win without any other terminal transmitting during the CW
phase (although in reality the probability of seeing another
terminal transmit is going to increase with the number of
terminals present), then a single DIFS per contention can be
assumed.
8 EURASIP Journal on Wireless Communications and Networking
This gives the first efficiency component of the CP as
M
S
= DIFS + backoff + SIFS + ACK frame. (3)
The second efficiency component (wastage at the end of
the phase) can be determined from the effective number of
contending stations. This in turn depends on the trafficlevel
and the total number of contending stations, N
c
. If we know
the approximate packet rate of this traffic, P
r
, the effective
number of concurrently sending stations will be y
× P
r
× N
c
.
Hence, the overall efficiency of the CP simplifies to
L
N
c
=
P
r
× N
c
M
s
− H
s
(1 − x)
,(4)
where H
s
is the entire standardized contended exchange du-
ration (ms), M
s
is the standardized contended exchange over-
head (ms) from (3), N
c
is the number of contending stations,
y is CFP
REP
,andx is CFP
MAX
. We must further constrain this
expression by the frame-generation rate of the traffic, other-
wise this becomes almost a “self-optimizing” model that will
always fill the CP to capacity. We can use the utilization func-
tions L and V in the following objective function:
f
0
(x, y) =
1 − L
N
c
2
+
V
N
p
2
. (5)
We use the 1
− L(N
c
) term since higher values of L corre-
spond to good performance (in contra st to high values of V,
which indicate poorer performance), and square both terms
to ensure that both are positive and continuously differen-
tiable over the whole domain of interest. Substituting the ex-
pressions for V and L givenin(2)and(4), respectively, and
simplifying gives
f
0
(x, y) =
1 −
P
r
N
c
M
s
− H
s
1 − x
2
+
1 −
N
p
C
b
− C
a
xy
2
.
(6)
A number of constraints on this solution can be identi-
fied. CFP
MAX
is a ratio of two time periods, so it must be pos-
itive and less than one. CFP
REP
is bounded by the worst-case
polling frequency (“delay,” D) specified by the application.
Additionally, both the CFP and CP are subject to minimum
duration constraints (“CFP
MIN
”and“CP
MIN
,” resp .) accord-
ing to the standard [1]. The CFP has to be at least big enough
to contain one polled exchange comprising the largest pay-
load possible in each direction, plus a beacon and a CF-end.
The CP has to be large enough to contain an acknowledged
exchange of the largest payload possible.
Mathematically, the problem reduces to an optimization
problem over two variables, x and y: minimize f
0
(x, y)from
(6), subject to the set of constraints:
CFP
MIN
− xy ≤ 0,
CP
MIN
− (1 − x)y ≤ 0,
0
≤ x ≤ 1,
0
≤ y ≤ D.
(7)
5.1. Nonlinear vector optimization of model
Before standard optimization techniques can be unleashed
on the problem, the objective function must be first refor-
mulated in vector form with a single variable. Let z
= (x, y)
T
,
and define the two unit vectors e
1
= (1, 0)
T
and e
2
=(0, 1)
T
.
We can then rewrite the objective function as
f
0
(z) =
1 −
α
1 − e
T
1
z
2
+
1 −
β
z
T
Ez
2
. (8)
Here α
= P
r
N
c
(M
s
− H
s
), β = N
p
(C
b
− C
a
), and E =
e
1
e
T
2
. Other parameters are defined in Ta ble 3, along with the
values used in the application of this model. The constants
are determined by the physical layer under consideration and
the characteristics of the trafficflows.
In vector notation, the constraints can be restated as fol-
lows:
(i) CFP
MIN
−z
T
Ez ≤ 0: first constraint;
(ii) CP
MIN
− e
T
2
z + z
T
Ez ≤ 0: second constraint;
(iii) e
T
1
z − 1 ≤ 0: third constraint, upper bound;
(iv)
−e
T
1
z ≤ 0: third constraint, lower bound;
(v) e
T
2
z − D ≤ 0: forth constraint, upper bound;
(vi)
−e
T
2
z ≤ 0: forth constraint, lower bound.
Before the barrier method [26] can be used to solve this
problem, there is one more hurdle to overcome. This objec-
tive function is not convex, and furthermore may have mul-
tiple solutions (local minima). Two of these minima may
occur at the extreme values of the feasible set, with a third
local minimum from the objective function. Feasible start-
ing points must be determined to guide the solution in the
right direction. By examining the inequality constraints of
the original problem, it is possible to find feasible starting
points x
0
and y
0
that can be used to initialize the barrier
method. Consider the following two inequalities:
CFP
MIN
≤ xy,
CP
MIN
≤ (1 − x)y = y − xy.
(9)
These are obtained by rearranging the first two inequal-
ities of the original problem statement. Solving the second
inequality for xy enables the composite inequality to be writ-
ten as CFP
MIN
≤ xy ≤ y − CP
MIN
.
Thus, for a given y
= y
0
,afeasiblex = x
0
can be taken
from the interval
x
0
∈
CFP
MIN
y
,1
−
CP
MIN
y
, (10)
and the following feasible starting point constraint must be
met:
CFP
MIN
>y
0
− CP
MIN
. (11)
5.2. Application of model
The assumptions and parameters used in [5] and the simula-
tion model in Section 4 canbeadoptedbythismodeltogive
R. J. Haines et al. 9
0.7
0.6
0.5
0.4
0.3
0.2
Optimum CFP
MAX
200
180
160
140
120
100
80
D
0
5
10
15
20
N
p
Figure 11: CFP
MAX
optimization results.
200
150
100
50
Optimum CFP
REP
200
180
160
140
120
100
80
D 0
5
10
15
20
N
p
Figure 12: CFP
REP
optimization results.
some concrete values. These parameters are given in Tables 1,
and 3 gives the resulting concrete values for the constants in
the model. The starting point constraint in (11)canbemet
for these values when, for example, CFP
MIN
= 39.922, CP
MIN
= 21.404, and y
0
= 48.
Three local minima were discovered using the following
set of initial x values:
(1) 1.2
∗
(CFP
MIN
)/y;
(2) 0.5
∗
(1 − CP
MIN
− CFP
MIN
)/y;
(3) 0.8
∗
(1 − (CP
MIN
− CFP
MIN
))/y.
The first of these is a point near the lower end of the fea-
sible set, the second a point in the middle, and the third a
point towards the top end of the feasible set for x.Formany
values of D and N
p
, all of these local minima were found to
be identical, indicating that the local minimum is a global
minimum. In the case where a number of local minima were
found, the objective func tion was evaluated at each one and
the true minimum chosen. The minimum values obtained
are illustrated in Figures 11 and 12—compare the relatively
smooth surface of Figure 12 with that of the benchmark re-
sults shown in Figure 2. These configurations have been ver-
ified by comparison with comprehensive simulation [23].
The optimum values of CFP
MAX
are fairly variable, es-
pecially for larger values of D and the smaller values of N
p
.
This variability seems to occur mainly when the objective is
most flat: in that it does not vary much over a wide range
of CFP
MAX
values. This means that the instability happens
in exactly the situations where choosing a precise value of
CFP
MAX
is least important. The CFP
REP
optima tend to be
close to the maximum D, especially for smaller D where the
constraints do not permit much variation anyway. For larger
D, the optimum values a re significantly smaller than D, this
is in line with the fact that there is much more potential to fit
the polled and contention periods within a smaller repetition
time.
6. QUEUING THEORY APPROACH
Queuing theory models can be used to analyze the perfor-
mance of many aspects of wireless networks. Here we apply
this approach to the polling phase of the PCF procedure. In
these models, the system is thought of as a queue which is
filled with packets by an arrival process and is emptied by
a serv ing process. In this application, the arrival process is
the voice packet generation system, and the serving process
is the pol ling mechanism as implemented by the AP. Queu-
ing models aim to provide information about the distribu-
tions of the time spent in the queue (the waiting time) and
queue length distributions. The waiting time depends on the
mixture of arrival time distribution and service time distri-
bution. The arrival time model for this application is a simple
Poisson process when the voice stream is in “on” mode; we
assume here that the switch from “on” to “off ” occurs suf-
ficiently infrequently to not influence the waiting time dis-
tribution. The service time distribution is dependent on the
exact polling process used by the AP.
A specific use of this technique to packet delay of polled
protocols can be found in [27]. The technique of Laplace-
Stieltjes transforms (LST) allows the treatment of the service
time distributions to be as general as possible and provides
more detailed information about the full dist ribution of the
waiting times. We present the analysis in this form here pri-
marily for the first reason, since we do not use information
beyond the mean waiting time explicitly in this paper. The
service time distribution is given either as a cumulative dis-
tribution funct ion (CDF), or its derivative, the probability
density function (PDF). The LST of a CDF of a random vari-
able F(t)isgivenby
φ(s)
=
∞
0
e
−st
dF(t). (12)
These CDFs (and corresponding LSTs) are used to cap-
ture the distributions of service times and waiting times. A
central result [28] in queuing theory analysis for a queue with
exponential arrival times (mean rate λ) and general service
time distribution (with LST η(s)andmeanτ) is that the LST
of the waiting time is given by
w(s)
=
s(1 − λτ)
s − λ
1 − η(s)
. (13)
10 EURASIP Journal on Wireless Communications and Networking
This is known as the Pollaczek-Khintchine (PK) formula.
Inverting the corresponding LST to get back to the more use-
ful PDF of the waiting times is often intractable. However, we
can readily extract the set of moments (M
n
) of the PDF dis-
tribution using the following formula:
M
n
(F) = (−1)
n
d
n
ds
n
φ(s)
s=0
. (14)
All the properties of a distribution can be deduced from
its full set of moments, but this may require computation of
a large number of them. The mean (μ)andvariance(σ
2
)can
be calculated directly from just the first and second moments:
μ
= M
1
(F),
σ
2
= M
2
(F) − μ
2
.
(15)
6.1. Application to PCF delay model
This theory can be applied to analyze the delay times of the
polling procedure in 802.11 PCF. The polling procedure that
the AP runs flips between two states, polling and contending.
We make two assumptions in this model.
(1) Service times of the polling mechanism are indepen-
dent.
(2) The time to poll and receive responses from the com-
plete set of stations is constant.
The fi rst is not strictly the case here since there is a deter-
ministic switch between polling and CP modes. This means
that the short delay that occurs in polling mode is very likely
to be followed by an equally short delay, and similarly longer
delays will tend to follow longer delays when the system is
in CP mode. In practice, this assumption should only restrict
the range of parameters over which the results are valid, since
the deterministic process is likely to be more stable in the
face of configurations that would otherwise cause the polling
mechanism to break down with unacceptably large delays.
The second is an approximation since if a station has a
packet, its response will take longer than if it is returning
a null frame. Thus it will take longer to pol l the full set of
stations at the beginning of the CFP when most stations are
waiting with a packet than it does at the end when most have
empty queues. In the model, we approximate such a delay by
looking at the expected number of stations that has packets
and combining it with the with-packet and without-packet
polling times, building a weighted average for the polling
time, which we denote by r. This constant rate assumption
will have greatest effect on large superframe configurations
since the variation in total time to poll will be the largest
across the whole frame in these configurations.
Next we construct a CDF for the service time for the
polling traffic. Each station gets polled a total number n
poll
=
xy/r of times each superframe. As in the previous section,
we use x to denote CFP
MAX
and y to denote CFP
REP
.Ineach
of these occasions, the service time is r. In the following time
slot, the CFP ends and the service time is equal to the length
of the CP, y(1
− x). So the service time has value r with prob-
ability n
poll
/(n
poll
+ 1), and value y(1 − x)withprobability
150
100
50
0
Mean delay (ms)
0.50.60.70.80.9
CFP
MAX
Nv = 16
Nv
= 14
Nv
= 12
Figure 13: Mean packet delays for a range of voice stations. Solid
lines show model predictions, dotted lines show simulated values.
1/(n
poll
+ 1). This translates to a PDF for the service times of
ServPDF(t)
=
δ(t − r)n
poll
n
poll
+1
+
δ
t − y(1 − x)
n
poll
+1
. (16)
Here we use δ(t) the Dirac delta function to represent
in the PDF what would be discontinuities in the CDF. The
required CDF is given by the integral of this function. This
service time has corresponding LST given by
LSTServ(s)
=
e
−rs
n
poll
n
poll
+1
+
e
sy(x−1)
n
poll
+1
. (17)
We insert this in the PK formula (13), assuming that the
voice source is in talk-spurt mode with a Poisson arrival rate
of packets with mean λ. If we compute the first moment
using (14), we obtain the following formula for the mean
packet delay:
D
(x,y,r,λ)
=
λ
n
poll
r
2
(x − 1)
2
y
2
2
λ(x − 1)y +(1− λr)n
poll
+1
. (18)
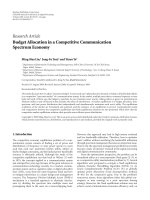
Once suitable values of λ and r are set from the sce-
nario parameters, the mean packet delay can be computed.
Figure 13 shows the mean delay predicted by this method
compared to the mean delay observed from OPNET simula-
tion. Here we fix CFP
REP
to be 120 milliseconds and show the
delays for a range of CFP
MAX
values from 50% to 90%. For
12 voice stations, there is very close agreement between the
model and the simulations. For larger numbers of stations,
there is more discrepancy for smaller values of CFP
MAX
,but
this is where both model and simulation tend to break down
anywayduetohighpacketdelays.
R. J. Haines et al. 11
Nv = 10, delay requirements = 25 ms
2
1.5
1
0.5
0
Utility
0.40.50.60.70.80.9
CFP
MAX
(a)
Nv = 10, delay requirements = 150 ms
2
1.5
1
0.5
0
Utility
0.40.50.60.70.80.9
CFP
MAX
(b)
Nv = 16, delay requirements = 25 ms
2
1.5
1
0.5
0
Utility
0.40.50.60.70.80.9
CFP
MAX
(c)
Nv = 16, delay requirements = 150 ms
2
1.5
1
0.5
0
Utility
0.40.50.60.70.80.9
CFP
MAX
(d)
Figure 14:Objectivesforasetofdifferent network sizes and delay requirements. The blue dotted line shows the polled trafficutility,the
green gives the data utility. The black line is the combined objective; red dotted line is the optimum CFP
MAX
.
Generally though, the agreement is close enough to an-
swer the kind of questions that are required to optimize
the performance of this system. For example, the value of
CFP
MAX
that is required to bring the average delay below
50 milliseconds for 14 voice stations is approximately 0.67
for both model predictions and simulations.
6.2. Selection of optimal CFP
MAX
This approach does not yet provide enough information to
optimize for the values of CFP
REP
. Future work would look
at the higher moments provided by the LST approach and
uses these to more accurately predict the percentage of pack-
ets satisfying delay requirements. However, we can still use
the mean packet delay to selec t CFP
MAX
values.
We can combine this packet delay model with a DCF
throughput model derived from the one described in [29]
to produce a combined performance objective function. The
polled component of the objective is constructed from the
required and predicted delay in the following way:
Obj
polled
= U
delay
req.
delay
predicted
. (19)
Here U(x) is a utility function designed to map the region
[0,
∞) onto [0, 1) (here we use (Ax
k
+ x)/(Ax
k
+ x
2
+1),with
A
= 18, k = 6). Similarly for the data traffic, with predicted
andrequiredlevelsofthroughput,
Obj
data
= U
throughput
predicted
throughput
req.
. (20)
The total objective is simply the sum of these two com-
ponents; maximizing the value of this function provides op-
timum CFP
MAX
values.
Figure 14 illustrates the objectives for different numbers
of voice stations and delay requirements. The curves for the
12 EURASIP Journal on Wireless Communications and Networking
set of 16 voice stations are only partially given since the de-
lay model is not applicable to values of CFP
MAX
less than 0.6
with this number of stations. Note also that with the level of
data traffic described in Section 4 (with 6 data nodes), the
performance for these devices does not drop off significantly
until CFP
MAX
reaches beyond 0.8. This causes the optimum
CFP
MAX
values to be driven chiefly by the polled t raffic. The
optima do change in an intuitive fashion, since increasing the
number of voice stations and tightening the delay restriction
both force a higher value of CFP
MAX
in order to give higher
priority to the voice traffic.
7. APPLICATION
So far in this paper, we have presented a number of alterna-
tive means for configuring the PCF superframe. Clearly, what
is needed is a means for fairly comparing these different ap-
proaches. To achieve this, a prototype has been developed in
OPNET, embodying an adaptive mechanism that reconfig-
ures the superframe as needed. This model can be configured
to use a fixed superframe structure (and thereby, replicate
the results of the aforementioned simulations), but can also
be configured to react to changes in traffic conditions. Addi-
tionally, the model can provide benchmark results, it can be
configured to use the results from Li et al. [5], or can carry
all traffic via the contention-based DCF mechanism.
7.1. Adaptive model
The key to any adaptive model is the provision of a feedback
path, in this case to feed back information on the degree to
which QoS requirements are being met, such as the end-to-
end delays are experienced. In this model, this feedback path
is abstra cted as a statistic wire in OPNET, although a real im-
plementation would, of course, require additional signaling
to transfer this information.
The adaptation mechanism comprises a check as to
whether the QoS requirements are being met as the super-
frame is started. This check is performed periodically, the
period dictated by the tolerance to jitter. If the requirements
have drifted, then the reconfiguration process is triggered.
The reconfiguration process supports multiple data sets.
These data sets can either be a fixed lookup table ( as it is the
case with the Li results), or can be generated dynamically by
an online optimization algorithm. This approach models the
range of possible implementations that could be considered,
from simple products with a limited number of lookup tables
to more complex adaptive solutions.
The entire adaptation algorithm can be disabled (thereby
supporting a predefined fixed superframe configuration),
and the traffic streams can all be diverted to DCF to show
the effect of not having a polling mechanism at all.
7.2. Scenarios
In this paper, we concentrate on two specific scenarios of in-
terest. To allow comparison with the benchmark results, the
physical layer rates are those supported by 802.11b physical
10
2
10
1
10
0
10
−1
10
−2
10
−3
End-to-end delay (s)-log scale
0 100 200 300 400 500 600 700 800 900
Simulation time (s)
DCF
Fixed, polling stream
Figure 15: End-to-end delays for scenario 1.
layer (2 Mbps for data and 1 Mbps for control messages). The
first scenario comprises an AP plus:
(i) 6 STA: local file transfer (DCF, 1500-byte mean);
(ii) 10 STA: carrying voice traffic (30-millisecond maxi-
mum delay, fixed MSDU 200 bytes, 64 kbps to corre-
spond to a G.711-style voice CODEC, duty cycle 1 :
2.35).
The second scenario is an extension of the first. In this
second scenario, an additional “glut” of QoS-sensitive traffic
is initiated halfway through the simulation, in the form of an
additional six voice trafficstreams.
7.3. Results
The first scenario is a static scenario in terms of the traffic
stream profile, as no new traffic streams begin and no ex-
isting traffic streams end in the course of the simulation. It
would be expected that measurements of performance pa-
rameters will soon reach a fairly steady state, and this is borne
out by results shown in Figures 15 and 16.
The results are for a DCF-only configuration (i.e., all traf-
fic having to contend for access), a fixed superframe scheme
and adaptive schemes using data from the benchmark (Li),
and the results from Sections 4, 5,and6. In the following
traces, in all but the DCF case, there are separate traces for the
polling and contending traffic flows, the polling results are
marked by solid lines, the contending are marked by dashed
lines. Specific traces of interest are highlighted in the figures.
The DCF benchmark configuration shows increasing in-
stantaneous end-to-end delay, but offers the best receive rate
of all the contention schemes as no time is spent polling.
The other schemes all achieve the required end-to-end de-
lay requirements of the voice traffic, including the fixed su-
perframe configuration because it has an “ideal” configura-
tion selected for this scenario ( CFP
MAX
of 85% and CFP
REP
of 30 milliseconds). The received data rates (Figure 16)have
all clustered in a similar way, with the polled traffic getting
considerably greater throughput.
R. J. Haines et al. 13
200
180
160
140
120
100
80
60
40
20
Receive rate (packets per second)
0 100 200 300 400 500 600 700 800 900
Simulation time (s)
Polled traffic
DCF
Contending traffic
Figure 16: Receive rates for scenario 1.
10
2
10
1
10
0
10
−1
10
−2
10
−3
End-to-end delay (s)-log scale
0 100 200 300 400 500 600 700 800 900
Simulation time (s)
Contending traffic delay increases
DCF
Polled traffic delay remains bounded
Figure 17: End-to-end delays for scenario 2.
300
250
200
150
100
50
0
Receive rate (packets per second)
0 100 200 300 400 500 600 700 800 900
Simulation time (s)
Adaptive schemes
DCF
Fixed schemes
Figure 18: Receive rates for scenario 2.
The benefits of PCF and of having an adaptive scheme
soon become apparent when the second scenario is consid-
ered. Firstly, let us consider the disadvantages of a DCF-only
system. As can be seen in Figure 18, the received data rate for
DCF does not change when the system is further loaded with
additional traffic, and, in Figure 17, the end-to-end delay in-
creases.
Theadaptiveschemesareabletorespondtothechange
in traffic stream demand and reconfigure to provide a nearly
constant end-to-end delay for the polling traffic, sacrificing
some of the end-to-end delay performance of the contending
traffic, which is an acceptable and even sensible tradeoff.
A more detailed examination of the adaptive schemes
reveals that the nonlinear optimization approach offers the
most stable configurations, but the queuing-theory-based
approach offers comparable results and has the benefit of
having more potential for distributed solutions in this area.
The nonlinear optimization approach does well on the polled
delays, but that is at the expense of the contention traf-
fic, which incurs a greater penalty than with the other ap-
proaches. There is the clear benefit with models that cater for
all of the constraints of the IEEE802.11 specification, making
any solution based on those results fully compliant with the
standard.
8. CONCLUSIONS
This paper has described the IEEE802.11 centralized control
schemes, concentrating on the PCF. There has been a consid-
erable amount of research into the support of QoS-sensitive
traffic in more distributed aspects of IEEE802.11, but much
less investigation into centralized solutions. An existing su-
perframe configuration solution has been described and op-
portunities for improvement have been identified.
A number of solutions for configuring the PCF super-
frame have been presented. Firstly, an improved simulation
model has been used to provide an accurate set of results for
any lookup-table-oriented solution. This model confers the
advantage over the literature available to date of being fully
compliant with the standard. This approach demonstrates
the need to focus on the time-dependent services and shows
the importance of considering several performance measure-
ments.
Secondly, two mathematical models have been devel-
oped, resulting in optimized sets of values for a given config-
uration, and, critically, general purpose algorithms that pro-
vide optimal results for any set of model constraints.
Finally, an adaptive prototype has been presented that
can show each approach in active use, highlighting the effects
of changes in traffic requirements. This prototype has high-
lighted the consistency of the more mathematical ly based
approaches,aswellasdemonstratingthebenefitsofboth
centralized control and a daptive solutions.
In terms of future work, we hope to extend this solution
to the more general case of the IEEE802.11e HCF, as well as
investigating the benefits (and disadvantages) of distributed
methods of handling mixed traffic networks such as the dis-
tributed reservation protocol [3].
14 EURASIP Journal on Wireless Communications and Networking
REFERENCES
[1] IEEE (Institute of Electrical Electronics Engineers), “IEEE
Standard 802.11: Wireless LAN Medium Access Control
(MAC) and Physical Layer (PHY) Specifications,” 1999.
[2] Y. Xiao, “QoS guarantee and provisioning at the contention-
based wireless MAC layer in the IEEE 802.11e w ireless LANs,”
IEEE Wireless Communications, vol. 13, no. 1, pp. 14–21, 2006.
[3] WiMedia-Alliance (Ecma International (Ecma)), “Standard
ECMA-368 High Rate Ultra Wideband PHY and MAC Stan-
dard,” 2005, />id
=res.
[4] IEEE (Institute of Electrical Electronics Engineers), “IEEE
Standard 802.11e—Part 11 Amendment 8: Medium Access
Control (MAC) Quality of Service Enhancements,” 2005.
[5] C. Li, J. Li, and X. Cai, “A study of self-adaptive t ransmis-
sion for integrated voice and data services over an IEEE 802.11
WLAN,” in Proceedings of 15th IEEE Internat ional Sympo-
sium on Personal, Indoor and Mobile Radio Communications
(PIMRC ’04), vol. 3, pp. 1922–1926, Barcelona, Spain, Septem-
ber 2004.
[6] Y. Zang, G. Hiertz, J. Habetha, B. Otal, H. Sirin, and H
J. Reumerman, “Towards high speed wireless personal area
network - efficiency analysis of MBOA MAC,” in Proceed-
ings of International Workshop on Wireless Ad-Hoc Networks
(IWWAN ’05), pp. 10–20, London, UK, May 2005.
[7] Y. Xiao and H. Li, “Evaluation of distributed admission con-
trol for the IEEE 802.11 e EDCA,” IEEE Communications Mag-
azine, vol. 42, no. 9, pp. S20–S24, 2004.
[8] J. Wall and J. Y. Khan, “An adaptive ARQ enhancement
to support multimedia traffic using 802.11 wireless LANs,”
in Proceedings of IEEE Global Te lecommunications Conference
(GLOBECOM ’04), vol. 5, pp. 3037–3041, Dallas, Tex, USA,
November 2004.
[9] P. Chatzimisios, A. C. Boucouvalas, and V. Vitsas, “IEEE
802.11 wireless LANs: performance analysis and protocol re-
finement,” EURASIP Journal on Wireless Communications and
Networking, vol. 2005, no. 1, pp. 67–78, 2005.
[10] L. Gannoune and S. Robert, “Dynamic tuning of the con-
tention window minimum (CWmin) for enhanced service dif-
ferentiation in IEEE 802.11 wireless ad-hoc networks,” in Pro-
ceedings of 15th IEEE International Symposium on Personal, In-
door and Mobile Radio Communications (PIMRC ’04), vol. 1,
pp. 311–317, Barcelona, Spain, September 2004.
[11] M. Bandinelli, F. Chifi, R. Fantacci, D. Tarchi, and G. Van-
nuccini, “A link adaptation strategy for QoS support in IEEE
802.11e-based WLANs,” in Proceedings of IEEE Wireless Com-
munications and Networking Conference (WCNC ’05), vol. 1,
pp. 120–125, New Orleans, La, USA, March 2005.
[12] A. Iera, G. Ruggeri, and D. Tripodi, “Providing throughput
guarantees in 802.11e WLAN through a dynamic priority
assignment mechanism,” Wireless Personal Communications,
vol. 34, no. 1-2, pp. 109–125, 2005.
[13] D. Chen, D. Gu, and J. Zhang, “Supporting real-time traffic
with QoS in IEEE 802.11e based home networks,” in Proceed-
ings of 1st IEEE Consumer Communications and Networking
Conference (CCNC ’04), pp. 205–209, Las Vegas, Nev, USA,
January 2004.
[14] G. Smith and D. Dillon, “QOS over IEEE 802.11e: the need for
HCCA for video applications,” Bermai, pp. 1–13, 2004.
[15] J. N. Al-Karaki and J. M. Chang, “Quality of service support
in IEEE 802.11 wireless ad hoc networks,” Ad Hoc N etworks,
vol. 2, no. 3, pp. 265–281, 2004.
[16]S.Mangold,S.Choi,G.R.Hiertz,O.Klein,andB.Walke,
“Analysis of IEEE 802.11 e for QoS support in wireless LANs,”
IEEE Wireless Communications, vol. 10, no. 6, pp. 40–50, 2003.
[17] P. Brady, “A model for generating on-off speech patterns in
two-way conversation,” Bell System Technical Journal, vol. 48,
pp. 2445–2472, 1969.
[18] J. Zheng and E. Regentova, “An improved polling scheme for
voice support in IEEE 802.11 wireless network,” in Proceedings
of International Conference on Information Technology: Coding
and Computing (ITCC ’05), vol. 2, pp. 603–608, Las Vegas, Nev,
USA, April 2005.
[19] X. Ma, C. Du, and Z. Niu, “Adaptive polling list arr angement
scheme for voice transmission with PCF in wireless LANs,”
in Proceedings of Joint Conference of the 10th Asia-Pacific Con-
ference on Communications and the 5th International Sympo-
sium on Multi-Dimensional Mobile Communications Proceed-
ings (APCC/MDMC ’04), vol. 1, pp. 21–25, Beijing, China,
August-September 2004.
[20] R. Y. W. Lam, V. C. M. Leung, and H. C. B. Chan, “Polling-
based protocols for packet voice transport over IEEE 802.11
wireless local area networks,” IEEE Wireless Communications,
vol. 13, no. 1, pp. 22–29, 2006.
[21] ITU-T (International Telecommunications Union - Telecom-
munication Standardisation Sector), “Transmission systems
and media: general characteristics of international telephone
connections and international telephone circuits: one-way
transmission time,” 1996.
[22] X. Ma, Y. Wu, Z. Niu, and T. Sato, “Performance analysis of
the packetized voice transmission with PCF in an IEEE802.11
infrastructure wireless LAN,” in Proceedings of 9th Asia-Pacific
Conference on Communications (APCC ’03), vol. 2, pp. 571–
575, Penang, Malaysia, September 2003.
[23] R. J. Haines, T. Lewis, J. Coon, and N. Fanning, “Non-linear
optimization of IEEE 802.11e super-frame configuration,”
in Proceedings of 63rd IEEE Vehicular Technology Conference
(VTC ’06), vol. 3, pp. 1211–1215, Melbourne, Australia, May
2006.
[24] B. Krishnamachari and F. Ord
´
o
˜
nez, “Analysis of energy-
efficient, fair routing in wireless sensor networks through non-
linear optimization,” in Proceedings of 58th IEEE Vehicular
Technology Conference (VTC ’03), vol. 5, pp. 2844–2848, Or-
lando, Fla, USA, October 2003.
[25] M. Sandell and J. Coon, “Near-optimal training sequences for
MIMO OFDM systems with nulled subcarriers,” in Proceed-
ings of IEEE Global Telecommunications Conference (GLOBE-
COM ’05) , pp. 2244–2249, St. Louis, Mo, USA, November-
December 2005.
[26] S. Boyd and L. Vandenberghe, Convex Optimization,Cam-
bridge University Press, Cambridge, Mass, USA, 2004.
[27] L. Wang, M. Hamdi, R. Manivasakan, and D. H. K. Tsang,
“Multimedia-MAC protocol: its performance analysis and ap-
plications for WDM networks,” IEEE Transactions on Commu-
nications, vol. 54, no. 3, pp. 518–531, 2006.
[28] R. B. Cooper, Introduction to Queueing Theory, Elsevier/North
Holland, Amsterdam, The Netherlands, 1981.
[29] G. Bianchi, “Performance analysis of the IEEE 802.11 dis-
tributed coordination function,” IEEE Journal on Selected Ar-
eas in Communications, vol. 18, no. 3, pp. 535–547, 2000.