Báo cáo hóa học: " Research Article Combined Rate and Power Allocation with Link Scheduling in Wireless Data Packet Relay Networks with Fading Channels" pptx
Bạn đang xem bản rút gọn của tài liệu. Xem và tải ngay bản đầy đủ của tài liệu tại đây (1.03 MB, 17 trang )
Hindawi Publishing Corporation
EURASIP Journal on Wireless Communications and Networking
Volume 2007, Article ID 24695, 17 pages
doi:10.1155/2007/24695
Research Article
Combined Rate and Power Allocation with Link Scheduling in
Wireless Data Packet Relay Networks with Fading Channels
Minyi Huang
1, 2
and Subhrakanti Dey
2
1
Department of Information Engineering, Research School of Information Sciences and Engineering,
The Australian National University, Canberra, ACT 0200, Australia
2
Department of Electrical and Electronic Engineering, University of Melbourne, Parkville, 3010 Victoria, Australia
Received 19 November 2006; Revised 22 May 2007; Accepted 19 June 2007
Recommended by Lin Cai
We consider a joint rate and power control problem in a wireless data traffic relay network with fading channels. The optimization
problem is formulated in terms of power and rate selection, and link transmission scheduling. The objective is to seek high aggre-
gate utility of the relay node when taking into a ccount buffer load management and power constraints. The optimal solution for
a single transmitting source is computed by a two-layer dynamic programming algorithm which leads to optimal power, rate, and
transmission time allocation at the wireless links. We further consider an optimal power allocation problem for multiple transmit-
ting sources in the same framework. Performances of the resource allocation algorithms including the effect of buffer load control
are illustrated via extensive simulation studies.
Copyright © 2007 M. Huang and S. Dey. This is an open access article distributed under the Creative Commons Attribution
License, which permits unrestricted use, distribution, and reproduction in any medium, provided the original work is properly
cited.
1. INTRODUCTION
Recently there has been a growing research interest in traf-
fic relay in wireless networks [1–7]. Relaying is regarded as
a promising means for supporting high data rate transmis-
sion in 4G systems, where users may be separated from the
base station or an access point in a wireless local area net-
work (WLAN) by a long distance. The implementation of
multihop relaying can lead to accommodating more high
data rate users, efficient interference control, and significant
power savings via economical amplifier design. In addition,
simultaneous transmission from the base station and the re-
lay node may achieve capacity gains through cooperative di-
versity. See [6] for a summary on relay-based deployment
ideas for wireless and mobile broadband radio. Among re-
cently published works, traffic relay has been considered for
cellular networks in [8, 9], and for wireless data packet net-
works in [2].
In a practical relay deployment scenario, one naturally
encounters random fluctuation of the channel gain along
each involved link, which impairs the transmission of sig-
nals. Power control is effective for dealing with fading by
maintaining an acceptable power level at the receiver end
by responding to channel variations. On the other hand, in
systems facilitating variable rate transmission, rate control is
also useful in reducing the probability of error. The reader
is referred to [10, 11] on power control, [12, 13]onrate
control, and [14, 15] on joint rate and power control. No-
tably, under dynamic channel conditions, dynamic program-
ming techniques have provided useful tools for system per-
formance optimization in the context of either rate or power
control [12, 16]. Specifically, in [2], the authors analyzed
an optimal power control algorithm by using stochastic dy-
namic programming techniques for a two-hop relay problem
where the source and relay each contains a buffer.
In this paper, we consider joint rate and power control in
a wireless data packet relay model. Such relay-based packet
data transmission systems can be useful in almost all wire-
less data networks cellular, WLANs, mobile multihop ad hoc
networks, or even emerging hybrid networks combined of
different components that provide seamless integr ated ser-
vice for transmitting and receiving data at high rates over the
wireless channel. In this setup, packets at the source nodes
(SN) need to reach a destination node (DN) via a relay node
(RN). Hence there are two sets of w ireless channels connect-
ing the sources a nd destination with the relay node being lo-
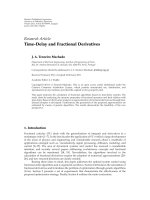
cated at an intermediate location; see Figure 1. For either a
single or multiple sources, however, we restr ict to a single
2 EURASIP Journal on Wireless Communications and Networking
Destination
node
Rate
R
2
Relay
node
Rate
R
1
Source
node
Channel
Buffer level
Channel
z
Figure 1: The relay model.
destination, which is typical for modeling the access point
to a wired infrastructure which receives data traffic from dif-
ferent users. For practical implementation, the significance
of one relay node lies in the fact that it reduces complicated
routing task, avoids the formation of bottleneck links, and
increases network reliability [17].
In our relay model, we assume that (i) at the wireless
links, data packets are sent using a spread spectrum scheme,
and furthermore, (ii) it is not allowed for the relay node
to receive and transmit packets simultaneously (half-duplex
model). The second assumption is made because, at the re-
lay node of the network, the receiver and the transmitter
are installed at the same unit and, if active simultaneously,
will produce self-interference which is significantly more se-
rious than the near-far effect in a code-division multiple-
access (CDMA) model. This assumption is useful for inter-
ference management in a w i reless data network which re-
quires low bit error rate (BER) under much poorer channel
quality compared to wired networks. Node transmission as-
sumptions similar to (ii) can be also found in [2, 18]. Notice
that assumption (ii) naturally leads to the issue of t ransmis-
sion link scheduling and its associated optimization.
Indeed, under the above assumptions, we can essen-
tially implement a joint CDMA/time-division multiple-
access (TDMA) protocol, where the TDMA component is
used to allocate the transmission time of the wireless links
connecting the relay node. The CDMA component allows
multiple sources to transmit simultaneously where the re-
ceivers can be equipped with multiuser detection capability.
For the joint rate and power control analysis, we will con-
centrate on the single user case although the optimization of
the multiple source case can be formulated in a straightfor-
ward manner. This leads to useful notational simplifications
in the underlying optimization problem which is very rich in
structure. The solution to this problem provides us with in-
teresting insights into network resource allocation problems.
We study the multisource case from the perspective of p ower
control only, as considering variable rate CDMA transmis-
sion from multiple users in the context of relaying is beyond
the scope of this paper. We also assume that al l necessary re-
source allocation computations (for link scheduling, power
and rate allocation) are carried out in a centralized manner.
For the particular problem considered in this paper with one
or more sources, relay and destination, the centralized entity
carrying out these computations can be the destination. Note
that this implies that the destination needs to have all channel
information regarding the source-relay and relay-destination
links available to itself in a dynamic manner, that is, this
information is collected at the same time scale as the chan-
nel changes. Clearly, this requires additional communication
overhead such as sending of pilot tones to relay and receiving
additional information from the relay regarding the source-
relay link. While these computations can be distributed at the
source and the relay based on their locally available infor-
mation (perhaps resulting in loss of optimality), in this pa-
per we do not investigate such distributed resource allocation
algorithms. A detailed investigation of channel estimation-
related communication overhead issues is also beyond the
scope of the current paper.
The main contributions of this paper are summarized as
follows.
(i) A unified framework for power, rate control, and link
scheduling with fading channel is proposed.
(ii) A two layer dynamic programming scheme for link
scheduling and rate/power selection is provided.
(iii) Algorithms for relay utility optimization and dynamic
buffer load control are proposed, which lead to sim-
ple threshold rules for link scheduling according to the
buffer level conditioned on channel quality. Numeri-
cal studies are presented to illustrate the performance
of all algorithms.
The rest of the paper is organized as follows. In Section 2
we state the channel model and variable rate packet trans-
mission. Section 3 presents the model for transmission dy-
namics in terms of a finite state Markov chain. The system
state transition resulting from channel variations and mul-
tiple retransmissions is described in Section 4, and then in
Section 5, the performance measure is introduced which in-
volves the objec tive of relay node utility, buffer management,
and power savings. The dynamic programming equation is
analyzed in Section 6 . The role of buffer load control is an-
alyzed in Section 7. Numerical examples are presented in
Section 8 for optimal rate and power control. Section 9 illus-
trates power control with multiple sources. Some concluding
remarks are included in Section 10.
2. SYSTEM MODEL
In this section, we consider the case of a single transmitting
source node. Let x(t)andy(t) denote, respectively, the chan-
nel link gain between the source and relay, and that b etween
the relay and destination, where t takes v alues from a set of
discrete times. We will term the wireless channels associated
with x(t)andy(t) as the incoming and outgoing links, re-
spectively. Transmission takes place across a channel if and
only if the channel is active.
We model x(
t)andy(t) by two independent finite state
Markov chains with state space S
x
={a
1
, , a
n
} and S
y
=
{
b
1
, , b
m
}, which describe the random fluctuation of the
channel gain. Note that the individual channel gains can
be temporally correlated due to their Markovian property.
For packet transmission, let us consider the incoming link.
The transmission for the other link is formulated similarly.
A packet transmitted by the source, if received correctly at
the relay node, results in an acknowledgment (ACK) which
is immediately sent by a feedback channel from the relay to
M. Huang and S. Dey 3
the source; consequently, the source deletes that packet and
continues with the transmission of the next one if its channel
(i.e., the incoming link) is still in an active state. We assume
that the feedback channel is error-free and does not interfere
with data transmissions.
In the case of a packet loss (or a corrupted packet), the
source will receive a negative acknowledgment (NACK) from
the relay node, and it needs to go through multiple retrans-
missions until the packet is received successfully or until a
maximum number of M trials is reached, whichever happens
earlier. See [19, 20] for similar retransmission schemes. If a
maximum number of retransmissions is reached without a
packet being successfully received, the packet will be deleted
and the source will turn to the next packet. We use the same
maximum retransmission number M for both the source and
the relay.
2.1. System parameter specifications
The channel state is updated by a period of T>0, and we
specify the two channel gains by the discrete time Markov
chains x(kT)andy(kT), k
= 0, 1,2, Both x(t)andy(t),
t
= kT, are homogeneous with one-step transition matrices
P
x
and P
y
, respectively. During the period [kT,(k+1)T), k ≥
0, the channel state remains a constant until a possible jump
at (k +1)T, and moreover, the transmitting node can choose
different packet rate R
p
(packets/second) for that interval;
however, under our direct sequence spread spectrum (DSSS)
scheme the chip rate for both links is assumed to be the same
fixed constant R
c
. Hereafter, we refer to [kT,(k +1)T)asa
transmission cycle, or simply a cycle,onwhichapacketrateis
selected at kT. Obviously, with the given constant chip rate,
the packet rate R
p
may be equivalently translated into a cor-
responding processing g a in G
p
in order to maintain the con-
stant chip rate. This is the so-cal led variable spreading gain
technique [21]. We assume a constant packet size of L bits.
Then R
c
= R
p
LG
p
, and a cycle contains R
c
T chips. In our
subsequent analysis, the word “packet rate” refers to R
p
and
the term “scaled rate” (or simply “rate”) refers to the num-
ber of packets transmitted per cycle of duration T,givenby
R
= R
p
T.
3. SYSTEM DYNAMICS FOR TRANSMISSION
In this section, we describe the packet transmission mecha-
nism. We assume that the source buffer is always nonempty
and that the relay buffer is sufficiently large such that the
issue of buffer overflow may be neglected. The power con-
trol problem amounts to selecting the power level of individ-
ual packets in a transmission cycle during which the chan-
nel state does not change. The number of packets transmit-
ted during a cycle (of duration T)isgivenbyR
p
T,whichis
integer-valued.
3.1. The bit-energy-to-interference ratio with
asinglesource
We use the terminology “bit-energy-to-interference ratio”
even though we are only analyzing a single user case. This
is done with the intention that we can use the same termi-
nology when multiple users are concerned. For the incoming
link, at time t we denote the power by p
x
(t) and the packet
rate by R
x
(t). The background noise intensity at the relay re-
ceiver is η
x
> 0. So the bit-energy-to-interference ratio (E
b
/I)
can be denoted as
1
e
x
(t) =
R
c
Lη
x
x( t)p
x
(t)
R
x
(t)
=
c
1
x( t)p
x
(t)
R
x
(t)
,(1)
where c
1
= R
c
/(Lη
x
). Similarly, for the outgoing link we in-
troduce the bit-energy-to-interference ratio
e
y
(t) =
R
c
Lη
y
y(t)p
y
(t)
R
y
(t)
=
c
2
y(t)p
y
(t)
R
y
(t)
,(2)
where c
2
= R
c
/(Lη
y
)andη
y
> 0 is the background noise
intensity observed by the receiver at the destination.
For both links, we u se the same function P
s
(r)todenote
the success probability of a packet transmission when the bit-
energy-to-interference ratio is r
≥ 0. In practical systems,
such a probability depends on the specific detection scheme
at the receiver, and whether coding as well as packet combin-
ing is employed [20].
3.2. A Markov chain model for retransmissions
We introduce the integer-valued random process I
x
(resp., I
y
)
for the incoming (resp., outgoing) link to index the number
of trials of the current transmission. We call I
x
and I
y
the
label processes with state space S
={1, 2, , M} where M is
the maximum retransmission number.
We introduce the variable a taking values in
{1, 2},where
a
= 1anda = 2 mean, respectively, the incoming and out-
going links being active. a will be called the scheduling vari-
able or simply the scheduler. Notice that under the operating
assumption, the value of a is chosen at kT and it remains
constant over [kT,(k +1)T) until it is updated at (k +1)T.
For the incoming link, suppose a scaled rate of R
= R
p
T
packets is selected at kT for the cycle [kT,(k +1)T). Denote
Δ
R
= TR
−1
= R
−1
p
, Δ
i
R
= iΔ
R
,(3)
where 0 ≤ i ≤ R. Consider the transmission of a packet on
the subinterval [kT + Δ
i
R
, kT + Δ
i+1
R
) ⊂ [kT,(k +1)T), 0 ≤
i ≤ R − 1, with an associated bit-energy-to-interference ratio
e
x
(kT + Δ
i
R
). We define the conditional probability
P
I
x
kT+Δ
i+1
R
=
l+1 | I
x
kT + Δ
i
R
=
l, e
x
kT + Δ
i
R
, a=1
=
1 − P
s
e
x
kT + Δ
i
R
,0≤ i ≤ R − 1, l ≤ M − 1,
(4)
1
Here the rate R
x
is used for the transmission of a group of packets, and p
x
is the power level for a specific packet in that group. A more detailed spec-
ification will be given later concerning the time scales of this transmission
mechanism.
4 EURASIP Journal on Wireless Communications and Networking
M
pppp
123
1
1
− p
1
− p
1
− p
1
− p
Figure 2: The retransmission model where p = 1 − P
s
(e
x
).
where we recall that a = 1 means that the incoming link is ac-
tive. The above gives the probability of transmitting the same
packet at the next time instant resulting from a packet loss.
Due to the maximal trial number constraint, we have
P
I
x
kT+Δ
i+1
R
=
1 | I
x
kT+Δ
i
R
=
M, e
x
kT + Δ
i
R
, a = 1
=
1, 0 ≤ i ≤ R − 1
(5)
which means that the channel must transmit a new packet
no matter what is the outcome of the previous transmission
provided that the link continues to be active. We also set
P
I
x
kT + Δ
i+1
R
=
l | I
x
kT + Δ
i
R
=
l, e
x
kT + Δ
i
R
, a = 1
=
1, 0 ≤ i ≤ R − 1, 1 ≤ l ≤ M,
(6)
where a
= 1 indicates that link is inactive. In this case, we
necessarily have e
x
(kT + Δ
i
R
) = 0 since the power becomes
zero. The interpretation is obvious: if that link is not active,
the label process should b e frozen.
The transition of I
x
(and also I
y
) is illustrated by the di-
rected graph in Figure 2 where the probability p
= 1−P
s
(e
x
).
I
x
is incremented by 1 if I
x
<Mand if there is a packet loss.
In the case of a transmission success or when the maximum
trial number has been reached, I
x
will transit to 1.
TheanalysisforI
y
is similar and will not be repeated here.
However , if I
y
is introduced into the system state specifica-
tion, there must be at least one packet in the buffer; other-
wise, the index I
y
is automatically ignored.
We note that in a data packet network, a packet discard is
a rare event. However, it plays an important role in affecting
the quality of service [19]. Now we examine the mechanism
for a packet discard event in the outgoing link. We use D
t
with t = kT + Δ
i
R
to denote a packet discard event for the
outgoing link on the time interval [kT +Δ
i
R
, kT +Δ
i+1
R
), i ≥ 0.
Then a packet discard occurs on that interval if and only if
I
y
(t) = M and a packet loss results at kT + Δ
i+1
R
.Byuseof
Bayesian rule, we have
P
D
t
=
1 − P
s
e
y
(t)
P
I
y
(t) = M
. (7)
For a relevant analysis on packet discard rates, see [ 19].
It is shown that by increasing the number M, the packet
discard rate can be effectively reduced at a modest expense
of increased transmission delay. When M continues to in-
crease towards a high value, the resulting additional delay will
rapidly saturate.
4. SYSTEM STATE TRANSITION IN A CYCLE
Once a link is activated, the system state may be described
using a finite state transition model involving only the ac tive
link. Since for the two label processes, only I
y
will be involved
in the optimization formulation as it affects the buffer state
directly, below we give the details when the outgoing link is
active. The case for the incoming link is only briefly sketched.
4.1. The outgoing link
We denote the channel state by y
∈ S
y
, the labelling param-
eter I
y
by l ∈ S ={1, 2, , M}, and the relay buffer state z
by i.Herewerequirei
≥ 1. For the cycle [kT,(k +1)T), let
R
= R
p
T. Below we take 0 ≤ j ≤ R − 1.
Case 1. Packet loss with l<M:
kT + Δ
j
R
yli
−→
kT + Δ
j+1
R
y
l +1 i
,(8)
where the first entry in the quadruple is time, 1
≤ l ≤ M − 1
and i
≥ 1. We have y
= y if 0 ≤ j ≤ R−2, and if j = R−1, y
can take a different value in S
y
if the channel gain has a jump.
The same rule is applicable to all the following scenarios for
the relation between y and y
.
Case 2. Transmission success:
kT + Δ
j
R
yli
−→
kT + Δ
j+1
R
y
1 i − 1,
,(9)
where 1
≤ l ≤ M and i ≥ 1.
Case 3. Packet discard:
kT + Δ
j
R
yMi
−→
kT + Δ
j+1
R
y
1 i − 1
, (10)
where i
≥ 1. Following a transmission failure, that packet
is deleted and the system turns to the next packet which is
labelled by 1.
We note that for both Cases 2 and 3,ifi
= 1, then the
label processes I
y
automatically vanish at kT + Δ
j+1
R
, and it
will be recreated only when a new packet enters the buffer.
For the state t ransitions specified in the above three cases,
the associated transition probability can be easily computed.
For example, let us consider Case 1 for the outgoing link with
j
≤ R−2. Then we have y = y
and the transition probability
is 1
− P
s
(e
y
)wheree
y
is easily determined by use of y, R,and
M. Huang and S. Dey 5
the power on the interval [kT +Δ
j
R
, kT +Δ
j+1
R
). If we have j =
R− 1, we have the transition probability P
y
(y, y
)[1− P
s
(e
y
)]
with its corresponding e
y
where P
y
is the one step transi-
tion matrix for the channel state at the outgoing link and
y
∈ S
y
.
4.2. The incoming link
We denote the channel state by x, the labelling parameter in
I
x
by l, and the buffer state by i ≥ 0. For the cycle [kT,(k +
1)T), assume R
= R
p
T is selected.
The analysis of the state transition is very similar to that
of the outgoing link. The only notable difference is that af-
ter a transmission success, the buffer state will increase by 1;
specifically, we have the following tr ansition:
kT + Δ
j
R
xli
−→
kT + Δ
j+1
R
x
1 i +1
, (11)
where 1
≤ l ≤ M. We omit the details for the state transition
for the other cases.
4.3. The partial idle period case
We need to consider a particular situation for the outgoing
link. Assume R>1 for the cycle [kT,(k +1)T), and the
buffer state decreases from a positive number to zero before
the time instant kT + Δ
R−1
R
is reached. For such a scenario we
stipulate that the transmission time is still reserved for the
outgoing link and the incoming link can only b e activated at
t
= (k +1)T. Then the system state transition can be easily
determined by updating y at (k +1)T, and the label index I
y
temporarily disappears.
Although this rule seemingly wastes part of the available
transmission time, in reality this does not constitute a draw-
back. First, by choosing kT, k
= 0, 1, 2, , as the activating
time, we may reduce the implementational complexity. Sec-
ond, for an optimized control policy, if it is the only choice
to activate the outgoing link when there is only a small num-
ber of buffered packets, the system will tend to minimize (if it
cannot avoid) the idle time by using a small packet rate which
increases the effectiveness of each transmission and also en-
ergy efficiency.
5. PERFORMANCE MEASURE
We begin by specifying a one-stage cost for the cycle [kT,(k+
1)T), k
= 0, 1, 2, Such an interval is used to describe the
operation of the active link which can be either the incoming
or the outgoing link. For notational convenience, we will op-
timize with respect to the scaled rate R (packets/cycle) rather
than R
p
(packets/second). Following the notation in (3), we
divide the cycle into R subintervals [kT + Δ
i
R
, kT + Δ
i+1
R
), i =
0, 1, 2, , R − 1. Depending on which link is active, we may
have a positive constant power level, denoted as p
x
(kT + Δ
i
R
)
or p
y
(kT + Δ
i
R
). Let z(kT + Δ
i
R
), i ≥ 1, be the buffer state
at time t
= kT + Δ
i
R
. Following the success of a transmis-
sion at the incoming (outgoing, resp.) link, the buffer state
will increase (decrease, resp.) by one, and in the event of a
packet loss, the buffer state will remain the same unless a
packet discard forces a decrease by one. Corresponding to
[kT,(k +1)T), we introduce the cost
J
c
kT, R, a, x, y, l
y
, j
=
R−1
i=0
−
h
z
kT + Δ
i
R
1
{z(kT+Δ
i+1
R
)>z(kT+Δ
i
R
)}
−
1
{z(kT+Δ
i+1
R
)<z(kT+Δ
i
R
),I
y
(kT+Δ
i
R
)<M}
+1
{I
y
(kT+Δ
i
R
)=M}
P
s
e
y
kT + Δ
i
R
+ λ
p
x
kT + Δ
i
R
+ p
y
k + Δ
i
R
,
(12)
where x and y denote the channel states at t
= kT.Thevalues
of I
y
and z at kT are l
y
and j, respectively. The scheduler a
determines which set of powers is positive, and the constant
λ>0 is the coefficient for power penalty. h is the reward
rate for sending a packet into the relay buffer. The power is
not explicitly indicated inside J
c
. J
c
(kT, R, a, x, y, l
y
, j)willbe
called the cycle cost on [kT,(k +1)T).
I
x
has no impact on the evolution of the buffer state.
Hence, J
c
is independent of I
x
, which is a useful feature for
reducing the size of the state space in further numerical solu-
tions.
In J
c
, the first two terms in the summand indicate that
if there is a change of buffer level in two successive time in-
stances, that is, a packet is successfully transported into or
out of the buffer, then a negative penalty (hence a reward)
should be imposed on the system. Note that conditioned on
{I
y
= M}, the buffer state will necessarily decrease by one
following one transmission; however, we only reward the fa-
vorable outcome when the packet is successfully transmitted.
Such terms effectively capture the aggregate utility of the re-
lay node in either receiving or for warding traffic. However,
in the calculation, there is an asymmetry for the one-stage
reward in moving a packet into or out of the buffer. Such an
asymmetry in the reward rate as adjusted by the weight func-
tion h(z)isusefulforbuffer management. In fact, we can
choose h(z) as a monotonically decreasing function defined
on the set of nonnegative integers. Then the marginal benefit
in receiving packets will decrease when the buffer level z is
large and hence the priority of activating the incoming link
will be lowered under such circumstances. Without buffer
load control, under very general conditions, there may be an
unbounded accumulation of packets in the buffer, and we
will address this issue separately in Section 7.
We decompos e J
c
into the form
J
c
= J
(1)
c
+ J
(2)
c
, (13)
6 EURASIP Journal on Wireless Communications and Networking
where
J
(1)
c
kT, R, x, y, l
y
, j
=
R−1
i=0
− h
z
kT + Δ
i
R
× 1
{z(kT+Δ
i+1
R
)>z(kT+Δ
i
R
)}
+ λp
x
k + Δ
i
R
,
(14)
J
(2)
c
kT, R, x, y, l
y
, j
=
R−1
i=0
−
1
{z(kT+Δ
i+1
R
)<z(kT+Δ
i
R
),I
y
(kT+Δ
i
R
)<M}
− 1
{I
y
(kT+Δ
i
R
)=M}
P
s
e
y
kT + Δ
i
R
+ λp
y
kT + Δ
i
R
,
(15)
where the right-hand side of (14)or(15) simply reduces to
zero if the corresponding link is inactive. Here J
(m)
c
, m = 1, 2,
is naturally understood as the cost incurred by the individual
links.
Now we introduce the infinite horizon discounted cost
function to be employed for the joint rate and power alloca-
tion:
J
R
∞
, a
∞
, x, y, l
y
, j
=
E
∞
k=0
ρ
k
J
c
kT, R, a, x, y, l
y
, j
,
(16)
where we again omit the power entries and (x
, y, l
y
, j)(de-
noting the set of values at time kT) is determined by the sam-
ple path of the channel states, label process I
y
, and the buffer
state. The parameter ρ
∈ (0, 1) is the discount factor. R
∞
and
a
∞
denote the sequences of rate allocation and scheduling ac-
tions. Here (x, y, l
y
, j) gives the values of channel states, label
index I
y
,andbuffer state z at time t = 0.
The optimal control problem amounts to finding a
scheduling rule and associated rate/power allocation such
that the cost J is minimized. For notational brevity, in fur-
ther analysis we may drop the time index kT in J
c
, J
(1)
c
or J
(2)
c
without causing confusion.
Remark 1. It should b e noted that due to the half-duplex na-
ture of the relay transmission scheme, only one link is active
at a given time. Therefore the performance function only re-
wards the success of the individual links at any given cycle of
duration T. This is captured by the individual link costs J
(1)
c
and J
(2)
c
given by (14)and(15), respectively. When an indi-
vidual link is not a ctive, the corresponding cost is zero. How-
ever, notice that the expected cost (defined by (16)) repre-
sents an infinite horizon average discounted cost where both
links are rewarded for successful transmissions in the long
term.
6. A TWO-LAYER DYNAMIC PROGRAMMING
EQUATION
In this optimal control framework, the control may be rep-
resented as a composite vector including the scaled rate R,
the link scheduler a, and the power levels for the active link.
For both links, we assume the rate R and power p are se-
lected from two finite sets R
={R
1
, R
2
, , R
N
1
} and P
=
{
p
1
, p
2
, , p
N
2
},respectively.
At time t
= 0, if the system state is (x, y, l
y
, i), repre-
senting the two channel states, the label parameter I
y
,and
the buffer state z in sequence, we write the optimal cost
v(x, y, l
y
, i) = inf
R,p,a
J(R
∞
, a
∞
, x, y, l
y
, i). v is also called the
value function to the underlying optimal control problem.
Here the infimum is computed from all admissible controls
using the available (channel and buffer) information, and the
rate and power are then assigned to the active link.
The dynamic programming principle gives
2
v(x, y, l, i) =min
min
R,p
EJ
(1)
c
(R, x, y, l, i)+ρEv(x
, y
, l, i
)
,
min
R,p
EJ
(2)
c
(R, x, y, l, i)+ρEv(x
, y
, l
, i
)
,
(17)
where we use l or l
to denote a value of I
y
. The second term
at the right-hand side of (17)isdefinedonlyforbuffer level
i
≥ 1. We term (17) the intercycle dynamic programming
equation which determines which link should be active if
both internal terms were known by some means.
We give some interpretation for the two components at
the right-hand side of (17). We consider the first component.
When the scheduling action a
= 1 is employed at the ini-
tial time t
= 0, the label I
y
= l will remain the same value
on [0, T), but all other quantities will change to new values
(x
, y
, i
)att = T. Hence in the second expectation, we have
the set of entries (x
, y
, l, i
) within the value function. The
leading term J
(1)
c
(x, y, l, i) corresponds to the cost on the in-
terval [0, T), and the term ρEv(x
, y
, l, i
) is the discounted
optimal cost-to-go from T to
∞. The second component at
the right-hand side of (17) is interpreted analogously. How-
ever, when a
= 2, the index l will transit to a new value l
at
t
= T.
6.1. The intracycle dynamic programming
Notice that in (17) we need to carry out an internal mini-
mization step which is used for rate selection and power al-
location for the subintervals within a cycle at the active link.
This internal minimization leads to an independent applica-
tion of the dynamic programming principle.
For given R, we have the Bel lman equation
v
(m)
( j, R, x, y, l, i)=min
p∈P
E
H
(m)
j
+ v
(m)
( j +1,R, x
, y
, l
, i
)
,
(18)
2
If i = 0, then I
y
= l
y
vanishes in the physical system model. However,
associated with i
= 0, we can always retain l
y
with any value from 1 to
M as a “dummy” index. This leads to a unified parametrization for the
optimal cost with four arguments regardless of the buffer state.
M. Huang and S. Dey 7
where m = 1, 2, 0 ≤ j ≤ R − 1, x
, y
, l
, i
denote the two
channel states, I
y
and the buffer state z at time kT + Δ
j+1
R
,
respectively, and
H
(1)
j
=−h(i) × 1
{z(kT+Δ
j+1
R
)>i}
+ λp
x
k + Δ
j
R
,
H
(2)
j
=−1
{z(kT+Δ
j+1
R
)<i,I
y
kT+Δ
j
R
=l<M}
− 1
{I
y
(kT+Δ
j
R
)=l=M}
P
s
e
y
kT + Δ
j
R
+ λp
y
kT + Δ
j
R
.
(19)
The cases m
= 1, 2 correspond to the activation of the links
by a
= 1, 2, respectively. Since the outgoing link transmits
only when there is at least one packet in the relay buffer, v
(2)
is defined for i ≥ 1. For the case m = 1, we have l
= l in
(18). The variable p in (18) stands for p
x
for m = 1, and p
y
for m = 2. The terminal condition for (18)is
v
(m)
(R, R, x, y, l, i) = ρv(x, y, l, i), m = 1, 2. (20)
Associated with (18), the state transition within a cycle is de-
termined in Section 4.Let
v
(m)
(x, y, l, i) = min
R∈R
v
(m)
(0, R, x, y, l, i). (21)
Combing the intracycle and intercycle dynamic program-
ming equations, we get
v(x, y, l, i)
= min
v
(1)
(x, y, l, i), v
(2)
(x, y, l, i)
, (22)
where v
(2)
is defined only for i ≥ 1.
Finally, the optimal scheduler a
∗
and rate R
∗
for the sys-
tem state (x, y, l, i)aregivenas
a
∗
= argmin
m
v
(m)
(x, y, l, i)
, i ≥ 1,
R
∗
= argmin
R
v
(a
∗
)
(0, R, x, y, l, i)
.
(23)
a
∗
should be set to 1 for i = 0. Once a
∗
and R
∗
are com-
puted for a transmission cycle, the optimal power is easily
determined using (18) by substituting m
= a
∗
and R = R
∗
.
Now a comment on the time-scale of the implementation of
optimal scheduling, rate, and power allocation is in order.
Note that the channel state changes at the end of each cy-
cle which is the time scale for link scheduling and rate selec-
tion. In each cycle, more than one packet can be tr ansmitted
with different power levels depending on the channel qual-
ity (and buffer level). Therefore, power control is done on a
faster time scale.
Computational complexity : the dynamic programming ap-
proach for optimal control problems (including control of
Markov decision processes (MDP)) suffers from the “curse
of dimensionality” in general. The application considered in
this paper to optimal resource allocation in wireless relay net-
works is no exception. Indeed the computational complexity
of the proposed algor ithm increases exponentially with the
number of users. However, by using an infinite time horizon
discounted performance measure in this paper (which is rea-
sonable when the time scale of individual packets is much
smaller than the overall service time of users), the complex-
ity can be partially reduced in that the control strategy only
depends on the system operating states (buffer level, chan-
nel quality, e tc.) and not on time, and such a control strategy
can be computed offline, provided the channel statistics, and
so forth remain unaltered over the time scale of the applica-
tion.
Indeed, it is important to consider more practical ap-
proaches for multiple users. We argue that our analysis with
the simple models provide some guidelines in developing
reduced-complexity optimization strategies. For instance, we
expect that the threshold-type scheduling rule observed in
the case for the simple model may carry over to the case of
many users. Thus, in the case of many users, it may be rea-
sonable to selec t suboptimal strategies by restricting the solu-
tion space to threshold-type strategies. One can also resort to
neuro-dynamic programming-based value function approxi-
mation techniques [22] to reduce computational complexity.
However, these studies are beyond the scope of the current
paper and will be carried out in future work.
7. THE ROLE OF BUFFER LOAD CONTROL
Recall that in the cycle cost J
c
, we have introduced the weight
function h(z)forbuffer load control. Now we examine the
effect of h(z)inaffecting the scheduler and packet buffering.
Since h is mostly related to the preference of the buffer to-
wards receiving over forwarding trafficorviceversa,weonly
consider the scheduling action, and both the power and rate
are fixed for the purpose of this simplified analysis. We as-
sume R
= 1. Furthermore, we take the maximum retransmis-
sion number M
=∞, that is, a packet is always retransmitted
until it is received by the next node.
The link quality of the two channels is specified as fol-
lows. Each channel has two states (“good” and “bad,” repre-
sented by rows 1 and 2, resp.) with state transition probability
matrix
P
x
=
0.92 0.08
0.18 0.82
, P
y
=
0.90 0.10
0.16 0.84
. (24)
Such two state Markov chain models are also called the
Gilbert-Elliott (GE) model [23]. Obviously, under the pre-
vious fixed power and rate assumption, the quality of chan-
nel as measured by transmission success rate translates into
a corresponding channel gain. For the incoming link, when
the channel is at “good” and “bad” states, let the success
8 EURASIP Journal on Wireless Communications and Networking
0
0.5
1
1.5
2
2.5
0 50 100 150
(G, G)
(a)
0
0.5
1
1.5
2
2.5
0 50 100 150
(G, B)
(b)
1
1.5
2
0 50 100 150
(B, G)
(c)
1
1.5
2
0 50 100 150
(B, B)
(d)
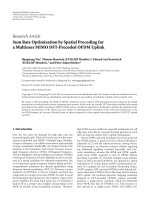
Figure 3: Link scheduling w ithout buffer load control. Horizontal axis: buffer level; vertical axis: scheduler state.
probability of packet transmission be
P
x
s
(1) = 0.9, P
x
s
(2) = 0.4, (25)
respectively, and for the outgoing link, let the success proba-
bility be
P
y
s
(1) = 0.85, P
y
s
(2) = 0.45, (26)
respectively.
We adopt a cost function of the form
J
= E
∞
k=0
ρ
k
−
h
z
k
1
{z
k+1
>z
k
}
− 1
{z
k+1
<z
k
}
, (27)
where we use the sequence of integers 0, 1, 2, , to index
the system states including the buffer level at different times.
Here one packet is transmitted between two successive time
instants since R
= 1. The cost (27) is based on the first two
terms in (12). We take ρ
= 0.95.
7.1. The case without buffer load control
We first examine the case h(z)
≡ 1. Since a closed form ex-
pression of the scheduling action as a function of the buffer
and channel states is not available, we adopt a numerical
method to examine the control actions for different buffer
levels. We can easily solve the associated dynamic program-
ming equation by value iteration. It is seen from Figure 3 that
the optimal solution is very close to opportunistic schedul-
ing which we define here as the scheduling rule which maxi-
mizes the one step reward. For relevant literature on oppor-
tunistic scheduling, see [24–26]. In [24], the notion of op-
portunistic scheduling in a multiuser multiaccess channel is
based on the principle that the user with the best channel
M. Huang and S. Dey 9
−17
−16.8
−16.6
−16.4
−16.2
−16
−15.8
−15.6
−15.4
−15.2
−15
Cost
0 20 40 60 80 100 120
Buffer level
Cost with (G, G)
Cost with (G, B)
Cost with (B, G)
Cost with (B, B)
Figure 4: The optimal cost as a function of the initial buffer state
with different combinations of initial channel states.
transmits. The seminal work on opportunistic beamform-
ing [26] is also based on this idea which forms the basis of
the notion of “multiuser diversity” when a sufficiently large
number of users are present to increase the sum capacity in
a multiaccess channel. In [25], opportunistic scheduling is
defined as a policy where the user with the largest perfor-
mance value transmits, where the performance measure is
defined for each user based on some desirable criteria such
as high throughput and/or low power consumption and so
forth. For our example with the given parameters, the op-
portunistic scheduling policy is given as
a
=
1 if incoming link is “good,”
2 if incoming link is “bad” and z>0.
(28)
Notice that in Figure 3, for the three scenarios w ith chan-
nel state pairs (G, G), (G, B), and (B, G), the associated ac-
tion a is consistent with (28). Here G and B stand for “good”
and “bad” states, respectively. With the channel state pair
(B, B), there is a minor discrepancy between the optimally
computed a and (28) in that a(z)
= 1forz = 0, 1, 2, 3 as
shown in Figure 3. By inspecting Figure 4, we have the nat-
ural interpretation—by activating the incoming link so as
to increase the buffered packet number from the very low
level, the system will be steered into a lower-cost state. In-
deed, when the initial state corresponds to a mild buffer load
z>4, the optimal cost is lower. The reason is that with that
higher buffer le vel, the scheduler has better flexibility (i.e.,
utilizing channel diversity) in choosing the most profitable
action before hitting the boundary z
= 0whichwouldforce
the scheduler to take a
= 1 even if the incoming channel link
is poor.
Although the above opportunistic scheduling as well as
its approximate version as shown in Figure 3 is simple for im-
plementation, it may cause the buffer to grow without bound
and thus necessitate buffer load control. We state the fol low-
ing result.
Proposition 1. For the model specified by (24)–(26) with
h(z)
≡ 1 and any given initial condition z
0
, one has
lim
t→∞
Ez
t
=∞for the scheduling rule (28).
Proof. See the appendix.
The above instability results suggest in link scheduling,
that the usual basic opportunistic scheduling is generally in-
adequate for producing practical control laws.
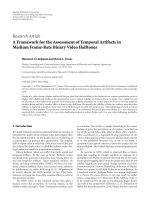
7.2. The case with buffer load control
We select the weight function h(i)
= 1/(1 + 0.001i), i ≥ 0.
Similar to Case 1, the optimal scheduling rule is computed
by value iteration. For the scenarios (G, B), (B, G), and
(B, B), the scheduling action is the same as in Case 1;see
Figure 5. In contrast, when both channels are in the good
states, the transmission time allocation depends on the buffer
level. Once the number of buffered packets exceeds a cer-
tain threshold, t ransmission switches to the outgoing link.
This effectively prevents the unlimited growth of the buffer
level.
8. NUMERICAL RESULTS FOR JOINT RATE AND POWER
CONTROL AND LINK SCHEDULING
We assume three choices for the scaled rate, that is, R
∈
{
1, 2, 3}. Let the set of admissible powers be given by
{1.0, 1.5, 2.0, 2.5, 3.0}. The maximum retransmission num-
ber is M
= 6. The discount factor in the cost function
is taken to be ρ
= 0.9. The weight for power penalty is
λ
= 0.05. The channel state transition probability ma-
trices are still given by P
x
and P
y
in (24). The function
h(i)
= 1/(1 + 0.001i)forabuffer level i ≥ 0. For the
incoming link, when the channel is in the “good” and
“bad” states, the packet transmission success probability is
given by Pr
x
(1) = (p/R)
4
/(0.1+(p/R)
4
)andPr
x
(2) =
(0.3p/R)
4
/(0.1+(0.3p/R)
4
), respectively. Similarly, for the
outgoing link, the success probability for the two channel
statesisgivenbyPr
y
(1) = (0.95p/R)
4
/(0.1+(0.95p/R)
4
)
and Pr
y
(2) = (0.35p/R)
4
/(0.1+(0.35p/R)
4
), respectively.
For justifications of such rational fraction expressions for the
success probability in terms of the signal-to-interference ra-
tio, see [11] and references therein. Here we use an exponent
of 4 for the ratio p/R so that a large R can rapidly decrease
the success probability. The reason for introducing such an
effect is that the successful transmission of a packet relies
on the correct detection of all its bits. Thus, the packet error
probability can be made very sensitive to the bit-energy-to-
interference ratio which affects the bit error rate.
The value function is computed by value iteration in 50
steps, which further determines the optimal transmission
link allocation, and rate and power selection.
Our computations indicate that the value function
v(x, y, l, i) is insensitive to the label index l, which denotes the
10 EURASIP Journal on Wireless Communications and Networking
1
1.5
2
0 50 100 150
(G, G)
(a)
0
0.5
1
1.5
2
2.5
0 50 100 150
(G, B)
(b)
1
1.5
2
0 50 100 150
(B, G)
(c)
1
1.5
2
0 50 100 150
(B, B)
(d)
Figure 5: Link scheduling with buffer load control. When both links are in the good state and the buffer level exceeds a certain level, there is
a switch of transmission from the incoming link to the outgoing link. Horizontal axis: buffer level; vertical axis: scheduler state.
retransmission index. For a fix ed i, x, y triple, when l changes
in the range 1
≤ l ≤ M = 6, the relative error is less than
2
× 10
−4
.HenceinFigure 6 we select l = 1 and display v as a
function of the buffer state i for given values of x, y.
The optimal link allocation is shown in Figure 7 where
the incoming and outgoing links are represented by the num-
bers 1 and 2 along the vertical axis, respectively, and the as-
sociated rate is given in Figure 8. It is clearly seen that the
optimal link scheduling is based on a threshold-type policy,
that is once the buffer level exceeds a certain threshold, the
link switching takes place. It is also seen that when the link
with a poor state is required to transmit, a low rate R
= 1
is used. When the channel condition is good for either the
incoming or the outgoing link, the optimal rate selection is
high for the appropriate link with R
= 3. Here we do not
explicitly display the power, but for the reader’s reference, in
the case of channel state being (G, G), the power level p
= 1.5
is used for either active link. In the case the channel state is
given by (B, B) and the outgoing link is active, the low rate
R
= 1 is used and the power is taken as p = 3.0toensure
adequate success probability.
For the channel state (B, G) in both Figures 7 and 8,we
redisplay the low buffer level part in Figure 9. An interesting
link and rate adaptation phenomenon is observed. With the
low buffer condition i
= 0, 1, the incoming link is active with
R
= 1 as constrained by the poor channel state. For i = 2, the
outgoing link with the “good” channel state becomes a ctive
with R
= 2, and if there is an adequate number of packets
stored (i
≥ 3), it operates more aggressively with R = 3.
9. MULTIUSER POWER-CONTROLLED RELAY
In this section, we focus on power control for a multiuser
packet relay model.
M. Huang and S. Dey 11
−22
−21
−20
−19
−18
−17
−16
−15
Cost v
0 20 40 60 80 100 120 140 160
Buffer level
Cost with (G, G)
Cost with (G, B)
Cost with (B, G)
Cost with (B, B)
Figure 6:Theshapeofthecostversusbuffer load (with optimal
rate and power control).
9.1. Channel modeling
We consider N transmitting source nodes. Let x
i
(t), t = kT,
i
= 1, , N, denote the gain of the incoming channel be-
tween the ith source and the relay. Let the gain of the outgo-
ing link still be denoted as y(kT).
We model x
i
(t)andy(t) by independent finite state
Markov chains with state space S
x
i
={a
i
1
, , a
i
n
} and S
y
=
{
b
1
, , b
m
}.Bothx
i
(t)andy(t), t = kT, are homogeneous
with one step transition matrices P
x
i
and P
y
,respectively.In
order to simplify notation, we assume the number of chan-
nel states is n for all incoming links, and a generalization to
different state space sizes is obvious. As in the joint rate and
power control formulation, at a given time the relay node can
only operate in the transmitting or receiving mode, and all
source nodes can simultaneously transmit to the relay node
by use of a CDMA scheme. In this model, the packet rate
R
p
is set to one, that is, each transmitting node sends out
onepacketontheinterval[kT,(k +1)T). The retransmis-
sion scheme is similar to Section 2 and wil l not be repeated
here.
9.2. The received signal-to-interference ratio
For the ith incoming link, we denote the power at time in-
stant t by p
i
(t). The background noise intensity at the relay
receiver is η
1
> 0. So the signal-to-interference ratio (SIR)
after detection by matched filtering can be denoted as
e
i
(t) =
x
i
(t)p
i
(t)
η
1
+
j=i
h
ij
x
j
(t)p
j
(t)
, (29)
where h
ij
denotes the squared cross-correlation between the
signature sequences of users i and j. Let the signature se-
quence of the ith user be s
i
= (1/
G
p
)(s
i1
, , s
iG
p
)where
s
ik
∈{−1, 1}, and then we have the relation h
ij
= (s
i
s
j
)
2
.
It is obvious that s
i
s
i
= 1. In practical implementation, one
can use the simple method of generating s
ik
,1≤ k ≤ G
p
as G
p
i.i.d. binary random variables, and h
ij
, i = j can be
reduced by increasing G
p
[27]. In decoding the source bits,
the bit-error rate (BER) depends on the above received SIR.
Similarly, for the outgoing link we introduce the SIR
e
y
(t) =
y(t)p
y
(t)
η
2
= c
2
y(t)p
y
(t), (30)
where c
2
= 1/η
2
,andη
2
> 0 is the background noise intensity
observed by the receiver at the destination. Note that e
y
(t)
does not depend on G
p
due to the scaled spreading sequence.
For all wireless links, we use the same function P
s
(r)to
denote the success probability of a packet transmission when
the received SIR is r
≥ 0.
9.3. System dynamics and cost function
As in Section 3, we can also describe the system state transi-
tion in a similar fashion; the main difference is that when the
incoming links are active, the buffer state may transit from
j
≥ 0toj
∈{j, j +1, , j + N}, depending on how many
sources succeed in tr ansmission. Subsequently, the perfor-
mance function is determined as follows: corresponding to
[kT,(k +1)T), we introduce the one-stage cost
J
c
kT, a, x, y, l
y
, j
=
− h
z(kT)
1
{z(kT+T)>z(kT)}
−
1
{z(kT+T)<z(kT),I
y
(kT)<M}
+1
{I
y
(kT)=M}
P
s
e
y
(kT)
+
i
λ
i
p
i
(kT)+λp
y
(kT)
,
(31)
where x = (x
1
, , x
N
)andy correspond to the channel
states at the initial time of the cycle [kT,(k +1)T). We denote
the scheduler by a.ThevaluesofI
y
and z at kT are denoted
by l
y
and j, respectively. The power is not explicitly indicated
inside J
c
. The scheduler a determines which set of powers is
positive, and the constants λ
i
, λ>0 are the weight coefficients
for power penalty.
Now we introduce the cost function for scheduling and
power control:
J
a
∞
, x, y, l
y
, j
=
E
∞
k=0
ρ
k
J
c
kT, a, x, y, l
y
, j
, (32)
where we again omit the power entries and (x
, y, l
y
, j)isde-
termined by the sample path of the channel states, label pro-
cess I
y
, and the buffer state. The parameter ρ ∈ (0, 1) is the
discount factor, and a
∞
denotes the sequence of scheduling
actions. The variables x
= ( x
1
, , x
N
), y, l
y
and j at the left-
hand side of (32) describe the system condition at the initial
time t
= 0.
Then by using the same method as in Section 6,wemay
write the dynamic programming equation for the optimal
scheduler and powers. The details are omitted h ere.
12 EURASIP Journal on Wireless Communications and Networking
1
1.2
1.4
1.6
1.8
2
0 50 100 150
Link switch with (G, G)
(a)
1
1.2
1.4
1.6
1.8
2
0 50 100 150
No switch with (G, B)
(b)
1
1.2
1.4
1.6
1.8
2
0 50 100 150
Link switch with (B, G)
(c)
1
1.2
1.4
1.6
1.8
2
0 50 100 150
Link switch with (B, B)
(d)
Figure 7: The switch of transmission time between two links due to buffer conditions. Horizontal axis: buffer level; vertical axis: scheduler
state.
9.4. A numerical example with two users
In the following, we analyze a two-user model. First, we de-
note the received SIR in the form
e
1
=
x
1
p
1
η
1
+ h
12
x
2
p
2
, e
2
=
x
2
p
2
η
1
+ h
21
x
1
p
1
(33)
for the two users. For the relay node, the SIR is given as e
y
=
yp
y
/η
2
. Let the channel state transition matrices for the two
incoming links and the outgoing link be given by
P
x
1
=P
x
2
=
0.90.1
0.20.8
, P
y
=
0.92 0.08
0.25 0.75
,respectively.
(34)
Other parameters for channel modeling and packet
transmission are chosen as follows. The squared cross-
correlation coefficients are chosen to be h
12
= h
21
= 0.015.
Making use of the random construction of signature se-
quences in [27], h
ij
at such a magnitude can be attained
by a processing gain G
p
approximately equal to 64 (1/64 ≈
0.0156). The noise power intensity is η
1
= η
2
= 10
−10
mW.
The channel gain for x
i
, i = 1, 2 or y may change between
two values
{10
−10
,10
−11
}. In other words, when deteriorat-
ing, the channel gain may drop by 10 dB. The emitting power
for each of the three wireless links may be chosen from the
set
{40, 130, 220, 310, 400} in mW. We take the maximum re-
transmission number M
= 5.
To avoid calculations with very small quantities, we use
appropriate normalization for the noise intensity, channel
gain, and power to set η
1
= η
2
= 0.025 (for 10
−10
mW),
and the values of x
1
, x
2
,andy by the same set {1, 0.1},
M. Huang and S. Dey 13
1
1.5
2
2.5
3
0 50 100 150
Rate with (G, G)
(a)
1
1.5
2
2.5
3
0 50 100 150
Rate with (G, B)
(b)
1
1.5
2
2.5
3
0 50 100 150
Rate with (B, G)
(c)
1
1.5
2
2.5
3
0 50 100 150
Rate with (B, B)
(d)
Figure 8: The optimal rate assigned to the active link for different combinations of channel states. Except the case of (G, B), there is a switch
of transmitting node as shown in Figure 7. Horizontal axis: buffer level; vertical axis: rate.
corresponding to the “good” (10
−10
)and“bad”(10
−11
)
channel conditions, respectively. We also set the candidate
power levels for the mobile users and the relay node by
{1, 3.25, 5.50, 7.75, 10}, with the base power level being 1
(representing 40 mW). It can be checked that under the base
power level (p
i
= 1) and the good channel state (x
i
= 1), the
received SIR is about 16.02 dB when only one source node
is transmitting. This is consistent with the observation that
for data networks, the target received SIR or bit-energy-to-
interference ratio needs to be maintained at high levels for
reliable detection of the source bits [20]. In the numerical re-
sults presented below, all related quantities are computed in
terms of these normalized values.
For the three wireless links connecting the two sources,
the relay and the destination, (similar to the modeling in
[10]), we model the packet transmission success probability
by P
s
(r) = 1 − e
−0.1r
for an SIR level r. For other typical
approximations of packet success probability in terms of ex-
ponential functions and rational fractions, see [10]. For this
choice, an SIR level of 16.02 dB amounts to a packet success
rate of 0.9817. In the cost function, we use a discount factor
ρ
= 0.9, and λ
1
= λ
2
= λ = 0.02 denote the power penalty
factors.
In Figures 10–13, we display the numerical solution for
the optimal cost v as well as the associated control poli-
cies where the value of retransmission index l is 1. Figure 10
shows the curves of the optimal cost as a function of the ini-
tial buffer level with two sets of initial channel conditions.
It is seen that for the two curves, the cost monotonically in-
creases. The reason is that when the bufferlevelishigher,
the resulting cost due to receiving packets into the buffer is
also higher (i.e., less profitable). Figure 11 shows the alloca-
tion of link scheduling to the incoming links or the outgoing
link, depending on whether or not the buffer level exceeds
14 EURASIP Journal on Wireless Communications and Networking
1
1.2
1.4
1.6
1.8
2
0 123456789
Scheduler a
Buffer level
Theactivelinkwith(B, G) and different buffer levels
(a)
1
1.5
2
2.5
3
0 123456789
Rate R
Buffer level
The rate with (B, G) and different buffer levels
(b)
Figure 9: The scheduler and rate’s dependence on the buffer state
with limited load. The channel condition is (B, G).
−15
−14
−13
−12
−11
−10
−9
−8
v
0 20 40 60 80 100 120 140 160 180 200
z
(x
1
= 1, x
2
= 2, y = 1)
(x
1
= 1, x
2
= 2, y = 2)
Figure 10: v as a function of buffer level when the channel states
are fixed.
a certain threshold level when the channel states are fixed. In
Figure 11, the channel states are given by (1, 2, 1) and (1, 2, 2),
listed in the order (x
1
, x
2
, y), respectively where 1 represents
“good” and 2 represents “bad” channels, respectively. For the
1
1.2
1.4
1.6
1.8
2
0 20 40 60 80 100 120 140 160 180 200
Buffer level z
Scheduler state with channel state (1, 2, 1)
(a)
1
1.2
1.4
1.6
1.8
2
0 20 40 60 80 100 120 140 160 180 200
Buffer level z
Scheduler state with channel state (1, 2, 2)
(b)
Figure 11: The state of the scheduler switching between 1 and 2.
0 20 40 60 80 100 120 140 160 180 200
Buffer level z
0
0.5
1
p
1
(a)
0 20 40 60 80 100 120 140 160 180 200
Buffer level z
0
2
4
6
8
p
2
(b)
0 20 40 60 80 100 120 140 160 180 200
Buffer level z
0
0.5
1
p
y
(c)
Figure 12: Power allocation as a function of z and channel state
(1, 2, 1).
M. Huang and S. Dey 15
0 20 40 60 80 100 120 140 160 180 200
Buffer level z
0
1
2
3
4
p
1
(a)
0 20 40 60 80 100 120 140 160 180 200
Buffer level z
0
1
2
3
4
p
2
(b)
0 20 40 60 80 100 120 140 160 180 200
Buffer level z
0
0.5
1
p
y
(c)
Figure 13: Power allocation as a function of z and channel state
(1, 1, 1).
channel state being (1, 2, 2), at the beginning, the system uti-
lizes the incoming links and stops to do so only when the
buffer level exceeds a higher threshold compared to the case
of channel state (1, 2, 1). The power allocation in Figure 12 is
associated with the scheduling rule depicted in Figure 11(a)
where the channel state is (1, 2, 1) and only the buffer level
is treated as a variable. Figure 12(b) shows that the second
user has a poorer link gain and is hence compensated with a
higher power. Once the bufferlevelexceedsacertainvalue,
the outgoing link (with the good channel state) should be
activated using the base power level 1.
Figure 13 displays the power allocation with channel
states (1, 1, 1), in which the low buffer level corresponds to
higher powers p
1
= p
2
= 3.25. When the buffer level j is
small, the reward rate h( j) is high. This leads to an increas-
ing transmission success probability by using higher trans-
mission power and the resulting interference further causes
the two users to mutually increase their power levels to 3.25.
We have also examined the difference v(x, y, l
1
, j) −
v(x, y, l
2
, j),asafunctionofthebuffer level j, incurred by
taking two different label indices (1
≤ l
1
= l
2
≤ M = 5)
while the channel states are fixed as (x
1
, x
2
, y) = (1,1,1) or
other fixed triples. Compared to the magnitude of v itself,
this difference is seen to be negligible. This is a very inter-
esting and useful feature that simplifies numer ical computa-
tions. Specifically, in a suboptimal computation of the value
function v, one can essentially treat v simply as a function of
the buffer level and channel states, and then can obtain the
rate and power selection solutions using only a fraction of
time required for solving the original problem optimally. In
effect, this is equivalent to solving the problem with M
=∞.
Indeed, when M has a moderate magnitude (say, above 5),
packet discard becomes rare and the system behavior, includ-
ing the evolution of the buffer level, is very close to the case
by taking M
=∞.
It is worthwhile pointing out that in this discrete dynamic
programming context, although one cannot find a closed
form solution for the optimal power control and transmis-
sion scheduling strategies, link scheduling can be achieved
by some simple switching rules or threshold type policies,
specified in terms of the buffer level and channel states, and
this feature is true for different values of the label index I
y
.
In prac tical applications, this fact can be used to design low
complexity implementation of the optimal control law by
specifying some simple lookup tables.
10. CONCLUDING REMARKS AND FUTURE WORK
In this paper, we developed a unified optimization frame-
work based on a two-stage dynamic programming algorithm
for link scheduling and joint rate and power control in wire-
less data packet relay networks with fading channels. This
approach captures the real-time utility of the network and
leads to simple “threshold-type” scheduling rules for link al-
location as well as simple rate/power selection. For the case
of multiple users, the dynamic programming algorithm leads
to a h igh computational complexity, and a potentially useful
approach may lie in seeking suboptimal policies via approxi-
mate dynamic programming [22, 28].
In future work, it is of interest to consider the deployment
of a dual mode mobile user as a relay station. For such sys-
tems, it is potentially useful to introduce an incentive mech-
anism [29] (e.g., a node receives credit for forwarding traf-
fic) for the relay node to promote its willingness in shar-
ing its resources with other users while maintaining its own
service. In general, this requires introducing a p erformance
measure capturing the service objectives of all users in a bal-
anced manner and will be investigated in future work.
APPENDIX
The buffer state may be regarded as being driven by the
Markov chains, and its growth rate can be estimated by use
of the asymptotics of x
t
, y
t
as well as the scheduler a.Infact,
(x
t
, y
t
, z
t
) may be looked at as a joint Markov process. Let
E[z
t+1
| z
t
, x
t
, y
t
] denote the conditional expectation of z
t+1
given (z
t
, x
t
, y
t
). In view of the scheduling rule, we estimate
the increment
Δ
t+1
= E
z
t+1
− z
t
=
E
E
z
t+1
− z
t
| z
t
, x
t
, y
t
=
E
0.9 × 1
(x
t
=1)
− 0.85 × 1
(x
t
=2,y
t
=1,z
t
>1)
− 0.45 × 1
(x
t
=2,y
t
=2,z
t
>1)
≥
E
0.9 × 1
(x
t
=1)
− 0.85 × 1
(x
t
=2,y
t
=1)
− 0.45 × 1
(x
t
=2,y
t
=2)
= D
t
,
(A.1)
16 EURASIP Journal on Wireless Communications and Networking
where 1
A
is the indicator function for the set A.Byuseof
the transition matrices for x
t
and y
t
, it is easy to obtain the
stationary distributions
lim
t→∞
P
x
t
= 1
, P
x
t
= 2
=
[0.6923, 0.3077],
lim
t→∞
P
y
t
= 1
, P
y
t
= 2
=
[0.6154, 0.3846].
(A.2)
It follows that
Δ
t+1
≥ D
t
t
→∞
−−−→ 0.9 × 0.6923 − 0.85 × 0.3077 × 0.6154
− 0.45 × 0.3077 × 0.3846
= 0.6231 − 0.2142 = 0.4089.
(A.3)
Then we get lim inf
t→∞
Ez
t
/t > 0.4, and this completes the
proof.
ACKNOWLEDGMENTS
This work is supported by the Australian Research Coun-
cil. The first author’s work was performed at Department
of Electrical and E lectronic Engineering, University of Mel-
bourne.
REFERENCES
[1] J. Boyer, D. D. Falconer, and H. Yanikomeroglu, “Multihop
diversity in wireless relaying channels,” IEEE Transactions on
Communications, vol. 52, no. 10, pp. 1820–1830, 2004.
[2] S. Gitzenis and N. Bambos, “Power-controlled packet relays in
wireless data networks,” in Proceedings of IEEE Global Telecom-
munications Conference (GLOBECOM ’03), vol. 1, pp. 464–
469, San Francisco, Calif, USA, December 2003.
[3] M. O. Hasna and M S. Alouini, “End-to-end performance of
transmission systems with relays over Rayleigh-fading chan-
nels,” IEEE Transactions on Wireless Communications, vol. 2,
no. 6, pp. 1126–1131, 2003.
[4] J. N. Laneman and G. W. Wornell, “Energy-efficient antenna
sharing and relaying for wireless networks,” in IEEE Wire-
less Communications and Networking Conference ( WCNC ’00),
vol. 1, pp. 7–12, Chicago, Ill, USA, September 2000.
[5] R.U.Nabar,H.B
¨
olcskei, and F. W. Kneubuhler, “Fading relay
channels: performance limits and space-time signal design,”
IEEE Journal on Selected Areas in Communications, vol. 22,
no. 6, pp. 1099–1109, 2004.
[6]R.Pabst,B.H.Walke,D.C.Schultz,etal.,“Relay-basedde-
ployment concepts for wireless and mobile broadband radio,”
IEEE Communications Magazine, vol. 42, no. 9, pp. 80–89,
2004.
[7] H Y. Wei and R. D. Gitlin, “Two-hop-relay architecture for
next-generation WWAN/WLAN integration,” IEEE Wireless
Communications, vol. 11, no. 2, pp. 24–30, 2004.
[8] S. Mukherjee and H. Viswanathan, “Resource allocation
strategies for linear symmetric wireless networks with relays,”
in IEEE International Conference on Communications (ICC
’02), vol. 1, pp. 366–370, New York, NY, USA, April-May 2002.
[9] H. Viswanathan and S. Mukherjee, “Performance of cellular
networks with relays and centralized scheduling,” IEEE Trans-
actions on Wireless Communications, vol. 4, no. 5, pp. 2318–
2328, 2005.
[10] N. Bambos and S. Kandukuri, “Power-controlled multiple ac-
cess schemes for next-generation wireless packet networks,”
IEEE Wireless Communications, vol. 9, no. 3, pp. 58–64, 2002.
[11] Y. Li and N. Bambos, “Power-controlled media streaming in
the interference-limited wireless networks,” in Proceedings of
the 1st Annual International Conference on Broadband Net-
works (BROADNETS ’04), pp. 560–568, San Jose, Calif, USA,
October 2004.
[12] J. Razavilar, K. J. R. Liu, and S. I. Marcus, “Jointly opti-
mized bit-rate/delay control policy for wireless packet net-
works with fading channels,” IEEE Transactions on Commu-
nications, vol. 50, no. 3, pp. 484–494, 2002.
[13] N. Yin and M. G. Hluchyj, “A dynamic rate control mechanism
for source coded traffic in a fast packet network,” IEEE Journal
on Selected Areas in Communications, vol. 9, no. 7, pp. 1003–
1012, 1991.
[14] C. C. Chai, T. T. Tjhung, and L. C. Leck, “Combined power
and rate a daptation for wireless cellular systems,” IEEE Trans-
actions on Wireless Communications, vol. 4, no. 1, pp. 6–13,
2005.
[15] G. Kulkarni, V. Raghunathan, and M. Srivastava, “Joint end-
to-end scheduling, power control and rate control in multi-
hop wireless networks,” in IEEE Global Telecommunications
Conference (GLOBECOM ’04), vol. 5, pp. 3357–3362, Dallas,
Tex, USA, November-December 2004.
[16] J F. Chamberland and V. V. Veeravalli, “Decentralized dy-
namic power control for cellular CDMA systems,” IEEE Trans-
actions on Wireless Communications, vol. 2, no. 3, pp. 549–559,
2003.
[17] D. Zhao and T. D. Todd, “Real-time traffic support in relayed
wireless access networks using IEEE 802.11,” IEEE Wireless
Communications, vol. 11, no. 2, pp. 32–39, 2004.
[18] T. ElBatt and A. Ephremides, “Joint scheduling and power
control for wireless ad hoc networks,” IEEE Transactions on
Wireless Communications, vol. 3, no. 1, pp. 74–85, 2004.
[19] M. M. Krunz and J. G. Kim, “Fluid analysis of delay and packet
discard performance for QoS support in wireless networks,”
IEEE Journal on Selected Areas in Communications, vol. 19,
no. 2, pp. 384–395, 2001.
[20] B. Lu, X. Wang, and J. Zhang, “Throughput of CDMA data
networks with multiuser detection, ARQ, and packet combin-
ing,” IEEE Transactions on Wireless Communications, vol. 3,
no. 5, pp. 1576–1589, 2004.
[21] C L. I and K. K. Sabnani, “Variable spreading gain CDMA
with adaptive control for true packet switching wireless net-
work,” in IEEE International Conference on Communications
(ICC ’95), vol. 2, pp. 725–730, Seattle, Wash, USA, June 1995.
[22] D. P. Bertsekas and J. N. Tsitsiklis, Neuro-Dynamic Program-
ming, Athena Scientific, Belmont, Mass, USA, 1996.
[23] E. N. Gilbert, “Capacity of a burst-noise channel,” Bell Systems
Technical Journal, vol. 39, no. 5, pp. 1253–1265, 1960.
[24] R. Knopp and P. A. Humblet, “Information capacity and
power control in single-cell multiuser communications,” in
Proceedings of IEEE International Conference on Communica-
tions (ICC ’95), vol. 1, pp. 331–335, Seattle, Wash, USA, June
1995.
[25] X. Liu, E. K. P. Chong, and N. B. Shroff, “Opportunistic trans-
mission scheduling with resource-sharing constraints in wire-
less networks,” IEEE Journal on Selected Areas in Communica-
tions, vol. 19, no. 10, pp. 2053–2064, 2001.
[26] P. Viswanath, D. N. C. Tse, and R. Laroia, “Opportunistic
beamforming using dumb antennas,” IEEE Transactions on In-
formation Theory, vol. 48, no. 6, pp. 1277–1294, 2002.
M. Huang and S. Dey 17
[27] J. Zhang and E. K. P. Chong, “CDMA systems in fading chan-
nels: admissibility, network capacity, and power control,” IEEE
Transactions on Information Theory, vol. 46, no. 3, pp. 962–
981, 2000.
[28] D. Vengerov, N. Bambos, and H. R. Berenji, “A fuzzy reinforce-
ment learning approach to power control in wireless transmit-
ters,” IEEE Transactions on Systems, Man, and Cybernetics, Part
B, vol. 35, no. 4, pp. 768–778, 2005.
[29] H Y. Wei and R. D. Gitlin, “Incentive scheduling for co-
operative relay in WWAN/WLAN two-hop-relay network,”
in IEEE Wireless Communications and Networking Conference
(WCNC ’05), vol. 3, pp. 1696–1701, New Orleans, La, USA,
March 2005.