Báo cáo hóa học: " Research Article On Sum Rate and Power Consumption of Multi-User Distributed Antenna System with Circular " pdf
Bạn đang xem bản rút gọn của tài liệu. Xem và tải ngay bản đầy đủ của tài liệu tại đây (744.83 KB, 9 trang )
Hindawi Publishing Corporation
EURASIP Journal on Wireless Communications and Networking
Volume 2007, Article ID 89780, 9 pages
doi:10.1155/2007/89780
Research Article
On Sum Rate and Power Consumption of Multi-User
Distributed Antenna System with Circular Antenna Layout
Jiansong Gan, Yunzhou Li, Limin Xiao, Shidong Zhou, and Jing Wang
Department of Electronic Engineering, Tsinghua University, Room 4-405 FIT Building, Beijing 100084, China
Received 18 November 2006; Accepted 29 July 2007
Recommended by Petar Djuric
We investigate the uplink of a power-controlled multi-user distributed antenna system (DAS) with antennas deployed on a circle.
Applying results from random matrix theory, we prove that for such a DAS, the per-user sum rate and the total transmit power
both converge as user number and antenna number go to infinity with a constant ratio. The relationship between the asymptotic
per-user sum rate and the asymptotic total transmit power is revealed for all possible values of the radius of the circle on which
antennas are placed. We then use this rate-power relationship to find the optimal radius. With this optimal radius, the circular
layout DAS (CL-DAS) is proved to offer a significant gain compared with a traditional colocated antenna system (CAS). Simulation
results are provided, which demonstrate the validity of our analysis.
Copyright © 2007 Jiansong Gan et al. This is an open access article distributed under the Creative Commons Attribution License,
which permits unrestricted use, distribution, and reproduction in any medium, provided the original work is properly cited.
1. INTRODUCTION
Information theory suggests that for a system with a large
number of users, increasing the number of antennas at the
base station leads to a linear increase in sum-rate capacity
without additional power or bandwidth consumption [1].
However, previous studies have mostly focused on scenar-
ios with all antennas colocated at the base station. Suppose
antennas are connected but placed with geographical separa-
tions, each user will be more likely to be close to some an-
tennas, and the transmit power can therefore be saved. This
is the concept of distributed antenna system (DAS) which
was originally introduced for coverage improvement in in-
door wireless communications [2].
Recent interests in DAS have shifted to advantages in ca-
pacity or sum rate. The channel capacity of a single-user DAS
and the sum rate of a multi-user DAS were investigated and
compared with those of co-located antenna systems (CAS)
using Monte Carlo simulation in [3]and[4], respectively,
where significant improvements have been observed. How-
ever, these works did not provide theoretical analysis to char-
acterize the exact gain that a DAS offers over a CAS. Nei-
ther did they present optimal parameters for antenna deploy-
ment.
Another line of work introduces coordination between
base stations and suggests an architecture quite similar to
DAS [5]. Sum rate of such a system has been studied in [6, 7].
However, unlike investigations in DAS which evaluate perfor-
mance improvement by scattering co-located antennas, these
works mainly assess performance enhancement by introduc-
ing coordination between base stations. In addition, analysis
in [7], for example, assumes a large number of antennas co-
located at the base station, which differs from ideas of DAS.
In this study, we demonstrate the advantage of scattering
co-located antennas in an analytical way. Though there are
different ways to scatter antennas and different antenna lay-
outs may result in different performances, investigating all
possible layouts is rather difficult. For analytical tractability
we only consider a special DAS with antennas deployed on
a circle. A similar model has been used in [8] to study the
capacity of CDMA system with distributed antennas. Since
distributed antennas are relatively cheap, it is feasible to de-
ploy a large number of antennas, which makes application of
random matrix theory possible. Applying recent results from
this theory, we prove that for a circular-layout DAS (CL-
DAS), the per-user sum rate and the total transmit power
both converge as user number and antenna number go to
infinity with a constant ratio. Then, the relationship between
the asymptotic per-user sum rate and the asymptotic total
transmit power is disclosed for all possible values of the ra-
dius of the circle on which antennas are deployed. We fur-
ther show how the rate-power relationship can be used to
find the optimal radius. A CL-DAS with this optimal radius
2 EURASIP Journal on Wireless Communications and Networking
R
0
a
b
R
Antenna
Central processor
User
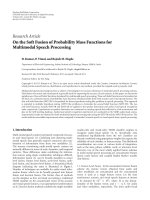
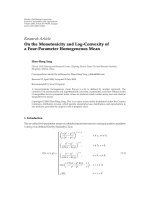
Figure 1: Illustration of CL-DAS.
is proved to offer a significant gain over a traditional CAS.
Though the maximum achievable gain that a general layout
DAS provides over a CAS has not been found yet, it can be
lower bounded by the presented gain for the optimized CL-
DAS (OCL-DAS). Hence, we demonstrate the possibility of
great performance enhancement by scattering the centralized
antennas.
The remainder of this paper is organized as follows.
Section 2 describes the system model. Sum rate, power con-
sumption, and their relationship are analyzed in Section 3.In
Section 4, we show how to use the rate-power relationship for
antenna deployment optimization and how much gain can
be obtained. Simulation results can be found in Section 5.
Finally, concluding remarks are given in Section 6.
2. SYSTEM MODEL
Before proceeding further, we first explain the notations used
in this paper. All vectors and matrices are in boldface, X
T
and X
H
are the transpose and the conjugate transpose of X,
respectively, X
i,j
is the (i, j)th element of X, X
i,:
is the ith row
of X , X
:,j
is the jth column of X,andE is the expectation
operator.
As illustrated in Figure 1, an isolated coverage area of ra-
dius R is considered. To describe antenna and user distribu-
tions, we use polar coordinates (r, θ) relative to the center of
the coverage area. The CL-DAS under study consists of N an-
tennas which are independent and uniformly distributed on
the circle with r
= a. (We do not assume deterministic de-
ployment scheme here, considering that the complex terrain
may make deploying a large number of antennas with de-
terminate positions difficult.) These antennas are connected
to the central processor via optical fibers. K single-antenna
users are mutually independent and uniformly distributed in
the coverage area excluding the radius R
0
neighborhood of
each antenna [9]. To describe user distribution, b is used to
denote user polar radius in the following analysis.
2.1. Signal model
Let x
k
and p
k
be the transmitted signal with unit energy and
the transmit power of the kth user, respectively. Let h
k
∈
C
N×1
denote the vector channel between the kth user and the
distributed antennas. Then, the received signal y
∈ C
N×1
can
be expressed as
y
=
K
k=1
h
k
p
k
x
k
+ n = HP
1/2
x + n,(1)
where x
= [x
1
, x
2
, , x
K
]
T
is the transmitted signal vec-
tor, P
= diag(p
1
, p
2
, , p
K
) is the transmit power matrix,
n
∈ C
N×1
is the noise vector with distribution CN (0, σ
2
n
I
N
),
and H
= [h
1
, h
2
, , h
K
] is the channel matrix. Since anten-
nas are geographically separated, to model DAS channel, we
should encompass not only small-scale fading but also large-
scale fading. Here, we model H as
H
= L ◦ H
w
,(2)
where “
◦” is the Hadamard product or element-wise prod-
uct, H
w
, a matrix with independent and identically dis-
tributed (i.i.d.), zero mean, unit variance, circularly symmet-
ric complex Gaussian entries, reflects the small-scale fading,
and L represents large-scale fading between users and anten-
nas. Adding shadowing to path loss model used in [3], we
model entries of L as
L
n,k
=
D
−γ
n,k
S
n,k
, R
0
≤ D
n,k
< 2R ∀n, k,(3)
where D
n,k
and S
n,k
are independent random variables rep-
resenting the distance and the shadowing between the nth
antenna and the kth user, respectively, γ is the path loss ex-
ponent.
{S
n,k
| n = 1, 2, , N, k = 1, 2, , K} are i.i.d.
random variables with probability density function (pdf),
f
S
(s) =
1
√
2πλσ
s
s
exp
−
(ln s)
2
2λ
2
σ
2
s
, s>0, (4)
where σ
s
is the shadowing standard derivation in dB and λ =
ln 10/10. Since these S
n,k
s are i.i.d., we will not distinguish
them in the following analysis and simply use S instead.
We note that the system model used in this study differs
from that in [6, 7] where the large-scale fading part L is as-
sumedtobefixed.AfixedL is applicable for performance
comparison between systems with and without coordination,
since coordination does not impact L. However, this fixed
L does not apply to performance comparison between CAS
and DAS, since it cannot fully reflect the large-scale fading
between antennas and users for different antenna layouts.
Therefore, a stochastic L must be included, which makes our
work quite different from analyses in [6, 7].
Power allocation policy impacts system performance to a
great extent. To investigate performance of DAS, we assume
a power control scheme widely used in CDMA systems, with
Jiansong Gan et al. 3
which all users are guaranteed to arrive at the same power
level. The power control scheme is given by
p
k
N
n=1
L
2
n,k
= P
R
∀k,(5)
where P
R
is the required receiving power level.
2.2. Distance distributions
As distances between users and antennas impact the chan-
nel directly, a key problem for the performance analysis is to
investigate their characteristics. Since they are random vari-
ables, we characterize them by presenting their distribution
functions.
Although radius of the circle for antenna deployment can
be optimized, it is a constant once chosen. So in the following
analysis, we first consider an arbitrary a and establish a rate-
power relationship between the asymptotic per-user sum rate
and the asymptotic total transmit power. Then, we optimize
a to get the best performance. As antennas are mutually inde-
pendent and uniformly distributed on the circle, their polar
angles Θ
a1
, Θ
a2
, , Θ
aN
are i.i.d. random variables with pdf,
f
Θ
a
θ
a
=
1
2π
,0
≤ θ
a
< 2π. (6)
Since users cannot fall into the radius R
0
neighborhood
of each antenna, when there are a large number of anten-
nas, users cannot fall into the area such that the polar radius
b satisfies
|b − a| <R
0
. As users are mutually independent
and uniformly distributed, the polar radiuses of the K users
B
1
, B
2
, , B
K
are i.i.d. random variables with pdf,
f
B
(b) =
b
r∈B
r dr
, b
∈ B,(7)
where B
={b | 0 ≤ b ≤ R, |b −a|≥R
0
} is the effective cov-
erage area. The polar angles of the K users Θ
u1
, Θ
u2
, , Θ
uK
are i.i.d. random variables with pdf
f
Θ
u
θ
u
=
1
2π
,0
≤ θ
u
< 2π. (8)
We characterize the distance distributions from two as-
pects: the perspective of a user and the perspective of an an-
tenna. Consider a user indexed k, we assume its polar radius
is b and polar angle is θ
u
. Then, the distance between this
user and the nth antenna can be expressed as
D
n,k
=
a
2
+ b
2
− 2ab cos
Θ
an
− θ
u
∀
n. (9)
Since Θ
a1
, Θ
a2
, , Θ
aN
are i.i.d. random variables with
pdf (6), distances from this user to all antennas D
1,k
,
D
2,k
, , D
N,k
are i.i.d. random variables with cumulative dis-
tribution function (cdf):
F
D|B
(d | b) = Pr
D ≤ d | B = b
=
⎧
⎪
⎪
⎪
⎪
⎪
⎨
⎪
⎪
⎪
⎪
⎪
⎩
0ifd<|a − b|,
1ifd
≥ a + b,
1
π
arccos
a
2
+ b
2
− d
2
2ab
, otherwise.
(10)
Since antennas are symmetric, distance distributions for
all antennas are the same. Without loss of generality, we con-
sider an antenna indexed n. When the polar radius of the kth
user is b, distribution of D
n,k
is the same as (10). Averaging
the distribution over all possible user polar radius, we get the
cdf of D
n,k
,
F
D
(d) =
b∈B
F
D|B
d | b
f
B
(b)db. (11)
Since users are mutually independent and uniformly dis-
tributed, distances from the nth antenna to all users
D
n,1
, D
n,2
, , D
n,K
are i.i.d. random variables with cdf (11).
3. ASYMPTOTIC ANALYSIS
When instantaneous channel state information is available at
the receiver side but not at the transmitter side, the sum rate,
normalized by the number of users, can be expressed as [10]
C
=
1
K
log
2
det
I
N
+
1
σ
2
n
HPH
H
. (12)
Unfortunately, (12) depends on distances, shadowing, and
small-scale fading between antennas and users which are ran-
dom variables. Hence, it is random and difficult to evaluate.
To assess the cost of the system, we introduce a metric
called total transmit power which can be defined as
E
K
k=1
p
k
=
K
k=1
P
R
N
n=1
L
2
n,k
, (13)
where the second equality follows from (5). Equation (13)is
also a random variable depends on distances and shadowing
between antennas and users.
In this section, we prove as N, K
→∞with K/N → β,
both the per-user sum rate and the total transmit power con-
verge to their respective asymptotic values. To prove this con-
vergence, we first cite some definitions and results from ran-
dom matrix theory.
3.1. Definitions and preliminary results
Definition 1. Given a vector v
= [v
1
, v
2
, , v
N
], its empirical
distribution function (edf) is defined as
F
N
(x)
1
N
N
n=1
I
[v
n
,∞)
(x), (14)
4 EURASIP Journal on Wireless Communications and Networking
where I
A
(w) is the indicator function taking value 1 if w ∈ A
and 0 otherwise. If F
N
(·)convergesasN →∞, its limit (the
asymptotic edf) is denoted by F(
·).
The following proposition is a reformulation of some
theorems presented in [11, 12], which provides a theoretical
support for our analysis.
Proposition 1. Consider an N
× K matrix H = L ◦ H
w
w ith
L and H
w
independent N ×K random matrices. Entries of H
w
are independent, zero mean, unit variance, circularly symmet-
ric complex Gaussian variables. Let G
= L ◦ L be the power
gain matrix of H.Ifforallk,edfof(G
:,k
)
T
converges as N →∞
to the cdf of a random variable w ith expectation 1 and all mo-
ments bounded, and for all n,edfofG
n,:
converges as K →∞to
the cdf of a random variable with expectation 1 and all mo-
ments bounded, the sum rate normalized by the number of
transmit antennas converges almost surely as N,K
→∞with
K/N
→ β:
1
K
log
2
det
I
N
+
ρ
K
HH
H
a.s.
−→ C(β, ρ)
= log
2
1+
ρ
β
−
1
4
F
ρ
β
, β
−
log
2
e
4ρ
F
ρ
β
, β
+
1
β
log
2
1+ρ −
1
4
F
ρ
β
, β
,
(15)
where ρ is the signal-to-noise ratio (SNR) and F (
·, ·) is de-
fined as
F (x,z)
x
1+
√
z
2
+1−
x
1 −
√
z
2
+1
2
. (16)
3.2. Proof of the convergence and derivation of
the rate-power relationship
We have shown that though antenna placement and user dis-
tribution are performed in a random manner, distributions
of distances between antennas and users are known. With
such information, we investigate the distributions of entries
of channel matrix H. Since its small-scale fading part H
w
is
well modeled as with independent, zero mean, unit variance,
circularly symmetric complex Gaussian entries, the rest is to
investigate its large-scale fading part. Denote the power gain
matrix of H by G with G
n,k
= L
2
n,k
= D
−γ
n,k
S, we characterize
the distributions of elements of G from two perspectives: a
user’s perspective and an antenna’s perspective. From (4)and
(10), we learn that for a user indexed k, G
1,k
, G
2,k
, , G
N,k
are i.i.d. random variables with cdf:
F
G|B
g | b
=
∞
0
1 − F
D|B
g
u
−1/γ
b
f
S
(u)du,
(17)
given B
k
= b. Then, the arithmetical average 1/N
N
n
=1
G
n,k
can be writen as
G(a, b) E
G | B = b
=
exp
1
2
λ
2
σ
2
s
·
E
D
−γ
| B = b
(18)
= exp
1
2
λ
2
σ
2
s
1
π
π
0
a
2
+ b
2
− 2ab cos θ
−γ/2
dθ,
(19)
according to (4)and(10).
From the perspective of an antenna indexed n, G
n,1
,
G
n,2
, , G
n,K
are i.i.d. random variables with cdf
F
G
(g) =
∞
0
1 − F
D
g
u
−1/γ
f
S
(u)du, (20)
according to (4)and(11).
From (5), we have
p
k
=
P
R
N
n
=1
L
2
n,k
=
P
R
N
n
=1
G
n,k
∀k. (21)
To e v a l u a t e ( 12), we rewrite it to (15)’sformandgetthe
power-controlled equivalent channel H
E
= H
√
KP
1/2
.Ac-
cording to property of H
E
and Proposition 1, we present the
following proposition:
Proposition 2. Theuplinkper-usersumrateofaCL-DAS
converges almost surely, as N
→∞, K →∞with K/N → β,
to
C
β,
βP
R
σ
2
n
. (22)
Proof. See appendix.
To characterize power consumption of a CL-DAS, we in-
vestigate the asymptotic behavior of E in (13) when there are
a large number of antenna and users. By the strong law of
large numbers and the distributions of G’s elements, we have
1
K
K
k=1
K/N
1/N
N
n
=1
G
n,k
a.s.
−→ β
b∈B
1
G(a, b)
f
B
(b)db, (23)
as N, K
→∞, K/N → β,whereG(a, b)isdefinedin(18).
Let
P (a)
b∈B
1
G(a, b)
f
B
(b)db, (24)
we have
E
a.s.
−→ βP
R
P (a). (25)
The total transmit power represents the cost of a system,
and the per-user sum rate stands for the output. To com-
pare cost-output relationships for different antenna configu-
rations, we establish the relationship between the asymptotic
per-user sum rate and the asymptotic total transmit power
according to (22)and(25):
C
= C
β,
E
P (a)σ
2
n
. (26)
Jiansong Gan et al. 5
4. DEPLOYMENT OPTIMIZATION AND
PERFORMANCE ENHANCEMENT
We lea rn fro m ( 26) that different a results in different rate-
power relationship. In CAS, a is fixed to be 0, while it may
vary from 0 to R for CL-DAS. Therefore, choosing the opti-
mal radius and achieving the best rate-power relationship is
possible. In this section, we will show how to decide the opti-
mal radius and how much gain an optimized CL-DAS offers
compared with a CAS.
As C(β, ρ) is a monotonic increasing function of ρ, the
optimal radius that minimizes the power consumption for a
given sum-rate requirement is the a that minimizes (24). In
the same way, this a also leads to the maximum sum rate for
a given total transmit power. So the a that minimizes (24)is
optimal for antenna deployment in the sense of both power
consumption and sum rate.
To evaluate performance enhancement that an OCL-DAS
provides over a CAS, we define two metrics. The first is the
power gain under the same sum rate constraint, defined as
G
p
10 log
E
CAS
E
OCL-DAS
, (27)
with C
OCL-DAS
= C
CAS
. The second is the per-user sum-rate
gain in the high SNR regime under the same total transmit
power constraint, defined as
G
c∞
C
OCL-DAS
− C
CAS
(28)
with E
OCL-DAS
→∞, E
CAS
→∞,andE
OCL-DAS
= E
CAS
.Asper
3 dB SNR increase in the high SNR regime leads to a per-user
sum-rate increase of min(1, 1/β) bits/s/Hz [12, 13], we have
G
c∞
= G
p
/3min(1,1/β).
4.1. Optimization for γ
= 4
As a uniform closed-form expression for G(a, b)in(19)is
hard to obtain for all γ, we deal with a typical path loss expo-
nent of 4 in this section. Then, (19)becomes:
G
(4)
(a, b) = exp
1
2
λ
2
σ
2
s
1
π
π
0
1
a
2
+ b
2
− 2ab cos θ
2
dθ
= exp
1
2
λ
2
σ
2
s
a
2
+ b
2
a
2
− b
2
3
.
(29)
To g e t P
(4)
(a), we further express the pdf of user polar radius
(7)as
f
B
(b)=
2b
A
, b
∈
0, max
0, a−R
0
∪
min
R, a+R
0
, R
,
(30)
where A
= (max(0, a − R
0
))
2
+max(0,R
2
− (a + R
0
)
2
). Sub-
stituting (29)and(30) into (24), we have
P
(4)
(a) =
1
A
f (0) − f
max
0, a − R
0
+ f (R) − f
min
R, a + R
0
,
(31)
where
f (t)
= exp
−
1
2
λ
2
σ
2
s
t
6
3
− 2a
2
t
4
+7a
4
t
2
− 8a
6
ln
a
2
+ t
2
.
(32)
Since in a practical system R
0
R,wecanrewriteP
(4)
(a)in
(31) to the following piecewise form:
P
(4)
(a)
=
⎧
⎪
⎪
⎪
⎪
⎪
⎪
⎪
⎪
⎪
⎪
⎪
⎪
⎪
⎪
⎨
⎪
⎪
⎪
⎪
⎪
⎪
⎪
⎪
⎪
⎪
⎪
⎪
⎪
⎪
⎩
f (R) − f
a + R
0
R
2
−
a + R
0
2
,0≤ a<R
0
,
f (0)
− f
a − R
0
+ f (R) − f
a + R
0
a − R
0
2
+ R
2
−
a + R
0
2
,
R
0
≤ a ≤ R − R
0
,
f (0)
− f
a − R
0
a − R
0
2
, R − R
0
<a≤ R.
(33)
A closed-form rate-power relationship is then obtained by
substituting (33) into (26).
For a path loss exponent of 4, the optimal ra-
dius for antenna deployment is the one that minimizes
(33). Therefore, a
(4)
opt
satisfies (∂P
(4)
(a)/∂a)|
a
(4)
opt
= 0and
(∂
2
P
(4)
(a)/∂
2
a)|
a
(4)
opt
> 0, or it is one of the endpoints of the
intervals in (33). Given R and R
0
,wecanfinda
(4)
opt
numeri-
cally. Consider R
= 2000 m and R
0
= 20 m according to the
COST231-Walfish-Ikegami model [14], we find that a
(4)
opt
=
1352 m and P
(4)
(a
(4)
opt
) = 5.988·10
11
·exp(−(1/2)λ
2
σ
2
s
). Sub-
stituting P
(4)
(a
(4)
opt
) into (26), the rate-power relationship of
OCL-DAS becomes
C
(4)
OCL-DAS
= C
β,
E
· exp
(1/2)λ
2
σ
2
s
5.988 · 10
11
σ
2
n
. (34)
CAS is a special case of CL-DAS with a
= 0. According to
(33), we have P
(4)
(0) = 5.334 ·10
12
· exp(−(1/2)λ
2
σ
2
s
)and
C
(4)
CAS
= C
β,
E
· exp
(1/2)λ
2
σ
2
s
5.334 · 10
12
σ
2
n
. (35)
Comparing (34)and(35), we find that OCL-DAS offers
apowergainofG
(4)
p
= 10 log(53.34/5.988) = 9.498 dB or a
per-user sum-rate gain in high SNR regime of G
(4)
c
∞
= 3.166 ·
min(1, 1/β) bits/s/Hz over CAS. We note that shadowing only
impacts P (a) by a scalar multiplication of exp(
−(1/2)λ
2
σ
2
s
)
and thus does not impact the value of the optimal radius.
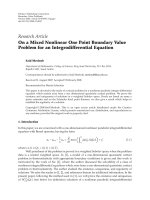
4.2. Optimization for an arbitrary γ
For most practical systems, the path loss exponent is not
an integer, which makes the closed-form expression for (24)
hard to obtain. To find the optimal radius for an arbitrary γ,
we present a numerical optimization method. This method
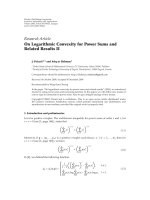
6 EURASIP Journal on Wireless Communications and Networking
2000180016001400120010008006004002000
a (m)
σ
S
= 0
γ
= 4.55
Minimum
×10
14
0
0.5
1
1.5
2
2.5
3
3.5
P(a)
Figure 2: Numerical result of P (a)forγ = 4.55 and σ
s
= 0.
is widely applicable but with high computational complexity.
We use COST231-Walfish-Ikegami model [14]tofindaprac-
tical γ, since it covers antenna height of less than 10 m, which
is common for DAS. We take a scenario with the following
parameters as an example: mobile station height l.5 m, an-
tenna height 10 m, building height 20 m, and street width
20 m [8]. Under these conditions, γ becomes 4.55.
R
= 2000 m and R
0
= 20 m are considered here. Then,
a may vary from 0 to 2000 m. We set the increasing step
to 1 m, so a takes value in
{0, 1, , 2000}m. To calculate
(24)foreacha, we set the increasing step of b to 1 m. For
each (a, b) pair, we calculate G(a, b)in(19)numerically.With
these G(a,b)s, we calculate (24)foreacha, and thus we get
P
(4.55)
(a) as plotted in Figure 2 for σ
s
= 0. For other σ
s
,
only a scalar multiplication of exp(
−(1/2)λ
2
σ
2
s
) to the pre-
sented result is needed. The numerical result shows the op-
timal a that minimizes P
(4.55)
(a)isa
(4.55)
opt
= 1331 m and
P
(4.55)
(a
(4.55)
opt
) = 2.394 · 10
13
· exp(−(1/2)λ
2
σ
2
s
), so the rate-
power relationship of OCL-DAS becomes
C
(4.55)
OCL-DAS
= C
β,
E
· exp
(1/2)λ
2
σ
2
s
2.394 · 10
13
σ
2
n
. (36)
As P
(4.55)
(0) = 3.195 · 10
14
· exp(−(1/2)λ
2
σ
2
s
), the rate-
power relationship of CAS is
C
(4.55)
CAS
= C
β,
E
· exp
(1/2)λ
2
σ
2
s
3.195 · 10
14
σ
2
n
. (37)
Comparing (36)and(37), we find that OCL-DAS offers
apowergainofG
(4.55)
p
= 10 log(31.95/2.394) = 11.25 dB or
a per-user sum-rate gain in high SNR regime of G
(4.55)
c
∞
=
3.751 · min(1, 1/β) bits/s/Hz over CAS.
5045403530252015105
Total transmit power (dBm)
Asymptotic β
= 1
Simulation N
= K = 300
Asymptotic β
= 1.5
Simulation N
= 200, K = 300
γ
= 4
σ
S
= 4
CAS
OCL-DAS
0
1
2
3
4
5
6
7
8
Per-user sum rate(bits/s/Hz)
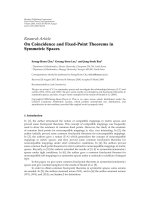
Figure 3: Simulation results for a large-scale system with γ = 4.
5. SIMULATION RESULTS
5.1. Simulation for a large-scale system
In this section, we verify the validity of our analysis via
large-scale system simulation, where there are a large num-
ber of antennas and users. Noise power σ
2
n
is −107 dBm given
5 MHz bandwidth and
−174 dBm/Hz thermal noise as in the
universal mobile telecommunications system (UMTS). The
shadowing standard deviation is set to 4 according to field
measurement for microcell environment [15].
Figure 3 presents simulation results for γ
= 4, which has
been studied in Section 4.1. According to the analysis, anten-
nas are mutually independent and uniformly distributed on
the circle of r
= 1352 m for OCL-DAS, while they are cen-
tralized at the center for CAS. For each set of parameters in
this figure, 50 independent realizations are carried out. In
each realization, the required receiving power P
R
is generated
according to uniform distribution in [
−110, −80] dBm; an-
tenna positions, user locations, shadowing and H
w
are gen-
erated according to aforementioned distributions; then the
per-user sum rate and the total transmit power are calcu-
lated and plotted according to (12)and(13), respectively.
The rate-power relationships for OCL-DAS (34) and CAS
(35) are also plotted for comparison. We can draw from the
plots that the simulated results converge to the rate-power
relationship for both OCL-DAS and CAS. OCL-DAS out-
performs CAS by nearly 10 dB in power efficiency for both
β
= 1andβ = 1.5, which agrees well with our analysis.
As for the sum rate, OCL-DAS offers nearly 3 bits/s/Hz per
user for β
= 1 and 2 bits/s/Hz per user for β = 1.5inthe
high transmit power regime, which validates the analytical
results.
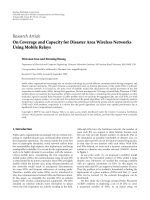
Figure 4 presents simulation results for γ
= 4.55, which
has been studied in Section 4.2. According to the analysis, an-
Jiansong Gan et al. 7
65605550454035302520
Total transmit power (dBm)
Asymptotic β
= 1
Simulation N
= K = 300
Asymptotic β
= 1.5
Simulation N
= 200, K = 300
γ
= 4.55
σ
S
= 4
CAS
OCL-DAS
0
1
2
3
4
5
6
7
8
Per-user sum rate(bits/s/Hz)
Figure 4: Simulation results for a large-scale system with γ = 4.55.
tennas are mutually independent and uniformly distributed
on the circle of r
= 1331 m for OCL-DAS. P
R
is also gener-
ated according to uniform distribution in [
−110, −80] dBm.
The analytical relationships (36)and(37)forγ
= 4.55 are
also plotted. As the plots demonstrate, the simulated results
converge to the asymptotic expression for both OCL-DAS
and CAS, and OCL-DAS outperforms CAS by more than
11 dB in power efficiency for both β
= 1andβ = 1.5, which
agrees well with our analysis. In the high transmit power
regime, the per-user sum-rate gain is nearly 3.5 bits/s/Hz per
user for β
= 1 and 2.5 bits/s/Hz per user for β = 1.5, which
also verifies the validity of our analysis.
5.2. Simulation for a practical system scale
From a practical point of view, we investigate the applicabil-
ity of the analysis and the asymptotically optimal circle ra-
dius to a practical system scale, for example, eight antennas
and eight users. Though we consider a random deployment
of antennas and a random distribution of users in the asymp-
totic analysis, it is inefficient to adopt this scheme in a system
with a small number of antennas, since the totally random
scheme may result in, with a considerable probability, un-
balanced load among antennas. For a small-scale system, we
consider a more efficient scheme with regularly deployed an-
tennas. We assume the coordinates of the nth antenna are
(a,((n
− 1)π/4)), n = 1, 2, , 8. These antennas divide the
circular area into eight congruent sectors with the polar an-
gle of the nth sector satisfying θ
n
∈ [((n−1)π/4)−π/8, ((n−
1)π/4) + π/8), n = 1, 2, , 8. We also assume that the eight
simultaneously-accessing users are located in the eight dis-
tinct sectors, which can be achieved via user selection.
In this simulation, only a path loss exponent of 4 is con-
sidered. Since we need to investigate the applicability of the
2000150010005000
a (m)
Simulation
Asymptotic
γ
= 4
σ
S
= 4
3.1
3.2
3.3
Mean per-user
sum rate (bits/s/Hz)
(a)
2000150010005000
a (m)
Simulation
Asymptotic
Minimum (1350 m)
20
25
30
35
Mean total
transmit power(dBm)
(b)
Figure 5: Simulation results for a practical system scale (N = K =
8).
asymptotically optimal radius, performances for all possible
a are simulated with the P
R
set to a medium value −95 dBm.
Considering the tradeoff between computational complex-
ity and accuracy, we set the increasing step of a to 10 m,
so a takes value in
{0, 10, , 2000}m. Performance of the
asymptotically optimal radius 1352 m is also simulated. For
a small-scale system, the instantaneous per-user sum-rate is
subject to a large variation and thus less valuable. So we eval-
uate the mean per-user sum rate and the mean total trans-
mit power averaged over 10
5
realizations. Since the rate-
power relationship for a small-scale system may differ from
the asymptotic relationship, we examine the mean per-user
sum rate and the mean total transmit power separately with
results displayed in Figure 5.Wecandrawfromthisfigure
that the mean per-user sum rate differs little (less than 2%)
from the asymptotic analysis. Though the difference between
the mean total transmit power and the asymptotic result
is noticeable, the two curves coincide well in shape. More
importantly, difference between the simulated optimal ra-
dius 1350 m and the asymptotically optimal radius 1352 m is
small and OCL-DAS saves nearly 8 dB total transmit power
compared with CAS. Hence, the deployment optimization
methodisapplicableinpracticeandOCL-DASprovidesa
significant gain even when the system scale is small.
5.3. Simulation for a multi-cell environment
As shown in the previous sections, OCL-DAS in an isolated
area offers significant power gain and capacity gain over CAS.
However, in a multicell environment, as antennas are dis-
8 EURASIP Journal on Wireless Communications and Networking
6050403020100−10
Mean total transmit power (dBm)
OCL-DAS
CAS
0
0.5
1
1.5
2
2.5
3
3.5
Mean per-user sum rate (bits/s/Hz)
Figure 6: Performance of OCL-DAS in a multicell environment
(N
= K = 8).
tributed far from the cell center, they may suffer from more
inter-cell interference. To estimate the impact of the inter-
cell interference, we present simulation results of OCL-DAS
in a multi-cell environment. Since a multi-cell system with
sufficient frequency reuse can be regarded as consisting of
several isolated areas, which have been analyzed in the pre-
vious parts, we consider the worst case with universal fre-
quency reuse in the following simulation. We assume that
the interferences only come from the neighboring cells, and
a one-tier cell structure is considered. Since we are interested
in the performance of a practical OCL-DAS, small-scale sys-
tem with the same configuration as in Section 5.2 is consid-
ered for each cell. For fair comparison between OCL-DAS
and CAS, we assume each cell processes its receiving signals
independently and simply treats signals from other cells as
interference.
In the multi-cell simulation, the required receiving power
P
R
varies from −120 dBm to −70 dBm. Figure 6 displays sim-
ulation results for both OCL-DAS and CAS. From the plot,
we find that when the transmit power is relatively small,
the system is noise-limited and acts like an isolated cell. In
this situation, OCL-DAS offers a power gain of nearly 10 dB
over CAS. As transmit power increases, the system becomes
interference-limited, and increasing transmit power does not
lead to a further capacity increase. In this regime, OCL-DAS
reaches it capacity limit of 3.1 bits/s/Hz per user, while the
capacity limit is 1.8 bits/s/Hz per user for CAS. Therefore,
OCL-DAS offers a capacity gain of 1.3 bit/s/Hz per user over
CAS. Though it is not as large as in an isolated cell environ-
ment, the capacity improvement is significant.
6. CONCLUSIONS
We have proved that for a CL-DAS, the per-user sum rate and
the total power consumption both converge as user num-
ber and antenna number go to infinity with a constant ratio.
Then, the relationship between the asymptotic per-user sum
rate and the asymptotic total transmit power is established.
Based on this relationship, the optimal radius for antenna de-
ployment has been found. The optimized CL-DAS has been
shown to offer power gains of 9.498 dB and 11.25 dB over
CAS for path loss exponents of 4 and 4.55, respectively. We
believe that these gains are not the best we can achieve by
scattering antennas and with some better antenna topologies
it is possible to get even higher system performances.
APPENDIX
PROOF OF PROPOSITION 2
Consider the power-controlled equivalent channel H
E
=
L
√
KP
1/2
◦ H
w
,whereH
w
is a matrix with independent, zero
mean, unit variance, circularly symmetric complex Gaussian
entries. To apply Proposition 1, we investigate the asymp-
totic edf of each row and each column of the equivalent
power gain matrix G
E
which consists of G
E
n,k
= Kp
k
L
2
n,k
=
Kp
k
G
n,k
= (KP
R
G
n,k
/
N
n
=1
G
n,k
).
We first check edf of each column of G
E
.For
an arbitrary user with index k and polar radius b,
its corresponding power gain vector G
E
:,k
consists of
(KP
R
G
1,k
/
N
n=1
G
n,k
), (KP
R
G
2,k
/
N
n=1
G
n,k
), ,(KP
R
G
N,k
/
N
n
=1
G
n,k
). Since G
1,k
, G
2,k
, , G
N,k
are i.i.d. random
variables with cdf (17), by the strong law of large
numbers, edf of (G
E
:,k
)
T
converges almost surely, as
N, K
→∞, K/N → β, to the cdf of a random variable
(G
E
| B = b) = (βP
R
· (G | B = b)/E [G | B = b]),
where (G
| B = b) is a random variable with cdf (17). The
expectation of (G
E
| B = b)is
E
G
E
| B = b
= βP
R
,(A.1)
which is independent of user index k and user polar radius b.
Since R
0
≤ D<2R, G(a, b)in(18)satisfies
exp
1
2
λ
2
σ
2
s
·
(2R)
−γ
< G(a, b) ≤ exp
1
2
λ
2
σ
2
s
·
R
−γ
0
,
(A.2)
then for all q, the qth moment of (G
E
| B = b)isbounded:
E
G
q
E
| B = b
=
βP
R
G(a, b)
q
· E
D
−γq
| B = b
·
E
S
q
<
βP
R
exp
(1/2)λ
2
σ
2
s
·
(2R)
−γ
q
·R
−γq
0
·exp
1
2
λ
2
σ
2
s
q
2
=
βP
R
q
2R
R
0
γq
exp
1
2
λ
2
σ
2
s
q(q −1)
.
(A.3)
In the same way, the edf of each row of G
E
converges al-
most surely to the cdf of a random variable G
E
with F
G
E
(g) =
b∈B
F
G
E
|B
(g | b) f
B
(b)db. The expectation of G
E
is
E
G
E
= E
E
G
E
| B
= βP
R
,(A.4)
Jiansong Gan et al. 9
and for all q, the qth moment of G
E
is bounded:
E
G
q
E
=
E
E
G
q
E
| B
<
βP
R
q
2R
R
0
γq
exp
1
2
λ
2
σ
2
s
q(q − 1)
.
(A.5)
We have shown that H
E
satisfies Proposition 1,except
that the expectation of the asymptotic edf of each column
and each row of G
E
is βP
R
. With some necessary normaliza-
tion, we conclude that as N, K
→∞with K/N → β,(12)
converges almost surely to
C
β,
βP
R
σ
2
n
. (A.6)
ACKNOWLEDGEMENTS
This work was supported by China’s 863 Beyond 3G Project
Future Technologies for Universal Radio Environment (Fu-
TURE) under Grant 2003AA12331002 and National Natural
Science Foundation of China under Grant 90204001.
REFERENCES
[1] W. Rhee and J. M. Cioffi, “On the capacity of multiuser wire-
less channels with multiple antennas,” IEEE Transactions on In-
formation Theory, vol. 49, no. 10, pp. 2580–2595, 2003.
[2] A.A.M.Saleh,A.J.RustakoJr.,andR.S.Roman,“Distributed
antennas for indoor radio communications,” IEEE Transac-
tions on Communications, vol. 35, no. 12, pp. 1245–1251, 1987.
[3] H. Zhuang, L. Dai, L. Xiao, and Y. Yao, “Spectral efficiency
of distributed antenna system with random antenna layout,”
Electronics Letters, vol. 39, no. 6, pp. 495–496, 2003.
[4] M.V.Clark,T.M.WillisIII,L.J.Greenstein,A.J.RustakoJr.,
V. Erceg, and R. S. Roman, “Distributed versus centralized an-
tenna arrays in broadband wireless networks,” in Proceedings
of the 53rd IEEE Vehicular Technology Conference (VTS ’01),
vol. 1, pp. 33–37, Rhodes, Greece, May 2001.
[5] G. J. Foschini, H. C. Huang, K. Karakayali, R. A. Valenzuela,
and S. Venkatesan, “The value of coherent base station coor-
dination,” in Proceedings of the 39th Annual Conference on In-
formation Sciences and Systems (CISS ’05), The Johns Hopkins
University, Baltimore, Md, USA, March 2005.
[6] O. Somekh, B. M. Zaidel, and S. Shamai, “Sum-rate character-
ization of multi-cell processing,” in Proceedings of the Cana-
dian Workshop to Information Theory (CWIT ’05), Montreal,
Quebec, Canada, June 2005.
[7] M. N. Bacha, J. S. Evans, and S. V. Hanly, “On the capacity
of cellular networks with MIMO links,” in Proceedings of IEEE
International Conference on Communications (ICC ’06), vol. 3,
pp. 1337–1342, Istanbul, Turkey, June 2006.
[8] J. H. Lee, J. H. Roh, and C. E. Kang, “Reverse link capacity
analysis of DS-CDMA system with distributed antennas us-
ing selection diversity,” Electronics Letters, vol. 36, no. 23, pp.
1962–1963, 2000.
[9] M S. Alouini and A. J. Goldsmith, “Area spectral efficiency of
cellular mobile radio systems,” IEEE Transactions on Vehicular
Technology, vol. 48, no. 4, pp. 1047–1066, 1999.
[10] E. Telatar, “Capacity of multi-antenna Gaussian channels,” Eu-
ropean Transactions on Telecommunications,vol.10,no.6,pp.
585–595, 1999.
[11] A. M. Tulino, L. Li, and S. Verd
´
u, “Spectral efficiency of mul-
ticarrier CDMA,” IEEE Transactions on Information Theory,
vol. 51, no. 2, pp. 479–505, 2005.
[12] A. M. Tulino, A. Lozano, and S. Verd
´
u, “Impact of antenna
correlation on the capacity of multiantenna channels,” IEEE
Transactions on Information Theory, vol. 51, no. 7, pp. 2491–
2509, 2005.
[13]A.M.Tulino,S.Verd
´
u, and A. Lozano, “Capacity of antenna
arrays with space, polarization and pattern diversity,” in Pro-
ceedings of IEEE Information Theory Workshop (ITW ’03),pp.
324–327, Paris, France, March-April 2003.
[14] G. L. St
¨
uber, Principles of Mobile Communication,KluwerAca-
demic Publishers, Boston, Mass, USA, 2nd edition, 2001.
[15] A. J. Goldsmith and L. J. Greenstein, “Measurement-based
model for predicting coverage areas of urban microcells,” IEEE
Journal on Selected Areas in Communications,vol.11,no.7,pp.
1013–1023, 1993.