Báo cáo hóa học: " Research Article StereoBox: A Robust and Efficient Solution for Automotive Short-Range Obstacle Detection Alberto Broggi, Paolo Medici, and Pier Paolo Porta" potx
Bạn đang xem bản rút gọn của tài liệu. Xem và tải ngay bản đầy đủ của tài liệu tại đây (3.72 MB, 7 trang )
Hindawi Publishing Corporation
EURASIP Journal on Embedded Systems
Volume 2007, Article ID 70256, 7 pages
doi:10.1155/2007/70256
Research Article
StereoBox: A Robust and Efficient Solution for Automotive
Short-Range Obstacle Detec tion
Alberto Broggi, Paolo Medici, and Pier Paolo Porta
VisLab, Dipartimento Ingegreria Informazione, Universit
`
a di Parma, 43100 Parma, Italy
Received 30 October 2006; Accepted 15 April 2007
Recommended by Gunasekaran S. Seetharaman
This paper presents a robust method for close-range obstacle detection with arbitrarily aligned stereo cameras. System calibration
is performed by means of a dense grid to remove perspective and lens distortion after a direct mapping between image pixels and
world points. Obstacle detection is based on the differences between left and right images after transformation phase and with a
polar histog ram, it is possible to detect vertical structures and to reject noise and small objects. Found objects’ world coordinates
are transmitted via CAN bus; the driver can also be warned through an audio interface. The proposed algorithm can be useful
in different automotive applications, requiring real-time segmentation without any assumption on background. Experimental
results proved the system to be robust in several envitonmental conditions. In particular, the system has been tested to investigate
presence of obstacles in blind spot areas around heavy goods vehicles (HGVs) and has been mounted on three different p rototypes
at different heights.
Copyright © 2007 Alberto Broggi e t al. This is an open access article distributed under the Creative Commons Attribution License,
which permits unrestricted use, distribution, and reproduction in any medium, provided the original work is properly cited.
1. INTRODUCTION
Problems concerning traffic mobility, safety, and energy con-
sumption have become more serious in most developed
countries in recent years. The endeavors to solve these prob-
lems have triggered the interest towards new fields of re-
search and applications, such as automatic vehicle driving.
New techniques are investigated for the entire or partial au-
tomation of driving tasks. A recently defined comprehen-
sive and integrated system approach, referred to as intelli-
gent transportation systems (ITSs), links the vehicle, the in-
frastructure, and the driver to make it possible to achieve
more mobile and safer traffic conditions by using state-of-
the-art electronic communication and computer-controlled
technology.
In fact, ITS technologies may provide vehicles with dif-
ferent types and levels of “intelligence” to complement the
driver. Information systems expand the driver’s knowledge
of routes and locations. Warning systems, such as collision-
avoidance technologies, enhance the driver’s ability to sense
the surrounding environment. Driver assistance and au-
tomation technologies simulate the driver’s sensor-motor
system to operate a vehicle temporarily during emergencies
or for prolonged periods.
Human-centered intelligent vehicles hold a major po-
tential for industry. Since 1980, major car manufactur-
ers and other firms have been developing computer-
based in-vehicle navigation systems. Today, most devel-
oped/developing systems around the world have included
more complex functions to help people to drive their ve-
hicles safely and efficiently. New information and control
technologies that make vehicles smarter are now arriving
on the market either as optional equipment or as spe-
cialty after-market components. These technologies are be-
ing developed and marketed to increase driver safety, per-
formance, and convenience. However, these disparate in-
dividual components have yet to be integrated to create a
coherent intelligent vehicle that complements the human
driver, fully considering his requirements, capabilities, and
limitations.
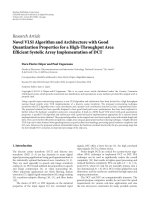
In particular, concerning heavy goods vehicles (HGVs),
many accidents involving trucks are related to the limited
field of view of the driver: there are large blind spots all
around the vehicle (see Figure 1). Some of these blind areas
can be at least partly covered by additional mirrors. How-
ever, this is not always an optimal solution considering the
aerodynamic effects and also the resulting complex driver
interface.
2 EURASIP Journal on Embedded Systems
Truck
Visible area
through mirrors
Visible area
Visible area
through mirrors
Visible
area
Visible area
Figure 1:Fieldofviewofatruckdriver.
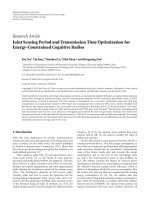
Figure 2: Typical dangerous situation.
Examples of traffic situations where the limited field of
view can result in conflicts are
(i) starting from stationary at crosswalks or other places
where a person or an object can be close in front of the
vehicle,
(ii) lane change and turn situations to the passenger side,
(iii) situations with cross-road trafficsideways,
(iv) backup situations especially when ranging up to a
loading dock.
This type of accidents accounts for approximately 10% of
all accidents between trucks and unprotected road users and
about 20% of all fatal accidents between trucks and unpro-
tected road users.
The most effective single measure would be to improve
the forward vision from HGV cabs so that an average size
pedestrian could be seen even when standing right up against
the front of the vehicle, see Figure 2. This would have been
likely to save the lives of 12% of the pedestrians killed by
HGVs. Changing the design of the front of a truck in this way
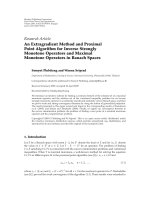
is not an easy task. Similar benefits can be achieved by using
sensors to detect the presence of a pedestrian or an obstacle
and to warn the driver and also to prevent the vehicle from
taking off when something is present in the forward blind
spot: this is called start-inhibit, see Figure 3.
Embedded systems have to be compact and well designed
for integration, but at the same time easy to use and to con-
figure. In particular for a market ready product, there are
some production aspects that get a central importance, for
example, calibration procedure.
In all vision systems, calibration is one of the main topics,
because it deeply affects algorithms performance; with our
Figure 3: Start-inhibit protection system.
method the system is hardware-independent. In fact in case
of accident or generic camera misalignment, the system can
be restored after a recalibration (that could be done with au-
tomatic procedure with the vehicle parked in front of a grid).
Even in case of cameras substitution for damage or commer-
cial, reason system restoring would be done in the same way.
This is a strong point of StereoBox because it allows an
easy installation and maintenance.
The system is composed of two cameras with sferic l enses
to get a wide field of view, but introducing a strong distortion
on images. They are placed in front of the truck and are arbi-
trary aligned, as will be discussed in Section 5 .Inparticular,
only the frontal driver blind spot area is framed by the cam-
eras.
Two well-known approaches for stereo obstacle detection
have been considered:
(i) the computation of the disparity of each pixel [1],
(ii) the use of stereo inverse perspective mapping [2].
An obstacle detection algorithm for offroad autonomous
driving is presented in [1]. The dominant surface (e.g., the
ground) is found through a v-disparity image [3] computa-
tion, while the obstacles come from a disparity space image
(DSI) analysis. In this case, the cameras axes of the stereo
system are almost parallel to the ground. Unfortunately, this
approach is not suitable for start-inhibit, because one of the
most important design issues is not to force a specific cam-
eras alignment. In fact, the approach described in [1]re-
quires a perfect camera alignment and precise constraints on
cameras orientation.
Therefore a stereo inverse perspective mapping-based ap-
proach has been considered. The whole processing is per-
formed by means of two main steps:
(i) lens distortion and perspective removal from both
stereo images,
(ii) obstacle detection.
Concerning the first step, the problems of distortion re-
moval and inverse perspective mapping without the knowl-
edge of the intrinsic and extrinsic parameters of cameras
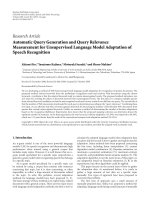
Alberto Broggi et al. 3
Distorsion
removal &
IPM
Right
image
Distorsion
removal &
IPM
Left
image
Obstacle list
Label filtering
Polar histogram
Labeling
Filtered threshold
−
Figure 4: Algorithm’s block diagram.
have to be solved. Lens distortion is usually modeled as poly-
nomial radial distortion [4, 5] and it is removed by estimat-
ing the coefficients of this polynomial. After the distortion
removal phase, extrinsic parameters are obtained [6], never-
theless, the highly complex mathematical model of the sferic
lens may affect the computational time.
Therefore, a graphic interface to remove lens distortion
has been designed to manually associate the grid points of the
source image to their homologous points on a square grid on
the IPM image [2] as explained in Section 2. This preprocess-
ing is performed offline and the result are stored in a lookup
table for a quicker online use.
In order to detect obstacles, two different approaches
have been tested.
(1) The first searches for connected blocks on the thresh-
olded image generated from the difference between left
and right images after distortion removal and inverse
perspective mapping (see [7]).
(2) The other one is based on the use of a polar histogram
(see [8, 9]).
These two approaches have been fused into one al-
gorithm to get the best from both. The w hole algorithm
flowchart is described in Figure 4 and is discussed in the fol-
lowing.
2. CALIBRATION
Camera calibration is one of the most important topics for
vision systems especially when fielding systems that must be
installed on real vehicles which have to operate in real sce-
narios.
In our case, highly distorting cameras are used with-
out any knowledge about the intrinsic and extrinsic cam-
era parameters. An analytic approach to calibration would
be computationally prohibitive: the equations that are nor-
(a) (b)
Figure 5: Original and undistorted images of the grid.
mally used to model sferic lenses become too complex when
wide-angle lenses are used.
Therefore, an empiric strategy has been used: during an
offline preprocessing, a lookup table that allows a fast pixel
remapping is generated; namely each pixel of the distorted
image is associated to its corresponding pixel on the undis-
torted image. Images of a grid, painted on a stretch of flat
road in front of the truck, are used to compute the look-
up table (see Figure 5). A manual system to pinpoint all the
crossing points on the source image is used.
Thanks to the knowledge of the relative position of the
truck with respect to the grid itself and to the assumption
that the road can be considered nearly flat in the proximity
of the vehicle, it is possible to compute a new image (the IPM
image) removing both the perspective effect and camera dis-
tortion at once. A nonlinear interpolation function is used
to remap the pixels of the source image that are not cross-
points.
The process to determine coordinates (x, y) of the source
image from the (i, j) pixels of the IPM image is divided into
two steps.
LetusassumetohaveagridwithN vertical lines and M
horizontal lines. For each vertical line of the grid, a function
f
n
is defined, where n ∈ [1, N] is the line number. The spline
creation is constrained by the correspondences between the
crossing points of each line in the source image and in the
IPM image; see (2) as an example, assuming x
1
, y
1
, x
2
, y
2
,
and so forth, as the coordinates of the cross-points on the
source image:
f
n
( j):R −→ R
2
, f
n
( j) =
⎧
⎨
⎩
f
x
n
( j) −→ x,
f
y
n
( j) −→ y,
(1)
f
x
1
(0) = x
1
,
f
y
1
(0) = y
1
,
f
x
1
(1) = x
2
,
f
y
1
(1) = y
2
,
.
.
.
f
x
1
(N) = x
N
,
f
y
1
(N) = y
N
.
(2)
4 EURASIP Journal on Embedded Systems
(a) (b)
(c) (d)
Figure 6: Perspective and distortion removal: (a) left source image;
(b) right source image; (c) left IPM image; (d) right IPM image.
Using functions f
1
( j), f
2
( j), , f
N
( j), another class of
functions can be built, called g
j
(i) and defined as described
in (3)with(4) as constraint:
g
j
(i):R −→ R
2
, g
j
(i) =
⎧
⎨
⎩
g
x
j
(i) −→ x,
g
y
j
(i) −→ y,
(3)
g
j
(1) = f
1
( j),
g
j
(2) = f
2
( j),
.
.
.
g
j
(N) = f
N
( j).
(4)
In this way, all the pixels of the IPM image have a corre-
spondence to a pixel of the source image and the cubic spline
interpolation method allows to get the best match between
the two sets of pixels. An example of the resulting images ob-
tained using these equations is shown in Figure 6.
Being the system based on stereo vision, two tables, one
for each camera and both fixed under the same reference
frame, are computed with this procedure. The lookup table
generation is a time-consuming step, but it is computed only
once when the cameras are installed or when their position is
changed.
3. ALGORITHM
Starting from the IPM images, a difference image D is gener-
ated by comparing every pixel i of left image (L) to its homol-
ogous pixel of the right one (R) and computing their absolute
distance:
D
i
=
L
i
− R
i
. (5)
In particular, working on RGB color images, the distance
used is the average of absolute differences of each color chan-
nel.
(a)
1
2
(b)
Figure 7: Difference image between Figures 6(c) and 6(d) and result
of labeling.
Then a particular threshold filter is applied on the result-
ing image D. In particular, for each pixel we define a square
area A centered on it; the average value m of all the pixels
in that area is computed and a threshold γ is applied on m.
The resulting value is assigned to the pixel T
i
as shown in the
following equation:
∀i ∈ D, m =
∀ j∈A
D
j
N
A
, T
i
=
⎧
⎨
⎩
0ifm<γ,
1ifm>γ,
(6)
where N
A
represents the number of pixels in A.
This is a kind of lowpass filtering and is useful to find
the most significant differences in these images. Compared
to similar methods like a thresholding followed by a morpho-
logical opening, it is faster because it is easy to be optimized
and, nevertheless, works on the whole range of values of grey
images.
Connected areas appearing in the resulting image are lo-
calized for and labeled: a progressive number is assigned to
each label for further identification (as shown in Figure 7).
A polar histogram is computed for each region. The focus
used to compute the polar histogram is the projection of
the mid point between the two cameras onto the road plane.
These regions produce peaks on the polar histogram. Thus,
the presence of strong peaks can be used to detect obstacles.
Some specific configurations of this histogram have to be
considered, due to regions that are weakly connected or too
thin to be a real obstacle. Therefore, it is necessary to further
filter the polar histog rams to remove regions that cannot be
considered as obstacles.
This filtering is performed considering the width of
the histog ram for the region of interest. The width of the
histogram is computed in correspondence to a given thresh-
old. When a polar histogram features several peaks, different
values of width (w
1
, w
2
, etc.) are generated (see Figure 8(a)).
If max
{w
1
, w
2
, , w
n
} >w
min
(where w
min
is a width thresh-
old), then the region previously labeled is maintained, other-
wise it is discarded.
For each resulting region, the point k closest to the ori-
gin of the polar reference system and the angles of view
(a
1
, a
2
) under which the region is seen are computed (see
Figure 8(b)).
Alberto Broggi et al. 5
w
1
w
2
(a)
w
(x, y)
a
1
a
2
r
k
(b)
Figure 8: (a) Polar histogram thresholding and filtering and (b)
information extracted from the detected obstacle.
(a) (b)
(c)
1.4, 1.4
0.7, 0.3
(d)
(e)
1.4, 1.4
0.7, 0.3
(f)
Figure 9: (a) left source image, (b) right source image, (c) difference
image, (d) connected components labeling, (e) polar histograms,
(f) resulting image.
A rough w idth (w) of the detected object is computed as
well, applying the following equation and considering r as
the distance of k from the focus:
w
= 2r · tan
a2 − a1
2
. (7)
Working on the IPM image, the location of point k in
world coordinates can be estimated through the same lookup
table previously used.
Figure 9 shows the complete set of intermediate results
starting from the left and right original images; the differ-
ence and labeled images; the polar histogram whose filtering
allows detecting one obstacle and discarding the small road
curb; and finally the left original image with a red marker
indicating the obstacle.
1.5m
2m
3m
Figure 10: Possible position of the stereo pair.
(a) (b)
Figure 11: Two examples of StereoBox hardware.
4. COMPUTATIONAL REQUIREMENTS
The system presented in this paper was tested in several situ-
ations and with different architectures.
The algorithm can be applied to both progressive and
interlaced images, widen the range of possible applications
and hardware. Applied to a pair of 768
× 576 pixels interlaced
color images, it takes approximately 30 milliseconds to be ex-
ecuted on an off-the-shelf Pentium4 running at 3.2 GHz. On
the same architecture, working on stereo 640
× 480 progres-
sive image retrieved from Bayer Pattern CCD sensor, the al-
gorithm takes only 20 milliseconds to be executed on each
frame.
Due to the small amount of resources required, the sys-
tem was ported also on cheaper architectures. On Via EPIA
EN15000 running at 1.5 GHz, analyzing stereo 640
×480 pro-
gressive images, algorithm takes about 80 miiliseconds and it
is thus capable to run up to 10 Hz.
5. SYSTEM SETUP
The stereo pair is placed right above the region of interest: in
particular in all the different set-ups tested so far the cameras
have been fixed in the front side of the vehicle.
The system was tested with cameras installed at several
different heights: 3 m, 2 m, and 1.5 m, as shown in Figure 10.
Stereo baseline and camera lenses must be changed accord-
ingly. Values for baseline and focal length shown in Table 1
werechoseninordertoviewagivenarea.
Another important degree of freedom is cameras conver-
gence: especially in case of large baselines or low heights, it
is hard to view the whole region of interest with both cam-
eras when their optical axes are parallel. Since images are
6 EURASIP Journal on Embedded Systems
0.6, 0.8
(a)
1.7, 0.6
(b)
1.9, 0.4
(c)
2.8, 0.4
(d)
1, 1.7
0.7, 0.4
(e)
1, 0.5
(f)
2.2, 2.5
0.7, 0.1
(g)
0.8, 0.9
(h)
1.2, 1.7
1, 0.2
(i)
0.3, 1.5
2.3, 1.4
(j)
2.6, −0.1
(k)
1.2, 0.4
(l)
Figure 12: Result images showing typical algorithm output. A red dot s hows the closest point of contact of each obstacle with the ground.
Truck
battery (12 V)
DC/DC adapter
in 12 V- out 19 V
Firewire
cable
Truck
can net
PC
Speakers
HUB
Firewire cable
Cameras
Figure 13: Block schema of the system.
preprocessed with a lookup table (as explained in Section 2)
every effect introduced by freely placing of cameras is re-
moved together w ith distortion and perspective.
In Figure 11 are shown different systems developed for
two different projects.
Thesystemisabletoprovideseveraltypesofoutputon
several peripherals (typical application layout is shown in
Figure 13).
Table 1: System specifications for different cameras heights.
Height (m) Baseline (m) Focal length (mm)
30.8 2.3
20.5 2.3
1.5 0.5 2.2
(i) The system can provide a visual output (e.g., on a dis-
play). This output consists in dedistorted image with
mark on detected obstacles. A blinking red frame no-
tify to driver danger condition.
(ii) An audio output: an intermittent sound is modulated
according to distance and position of obstacles.
(iii) Through CAN bus, detected object’s world coordinates
are sent and a system can use this information to per-
form a high-level fusion with others’ sensors.
(iv) Using CAN (or serial/ethernet) interface, the system
can drive directly others’ warning device (e.g., load
torque on throttle command).
Alberto Broggi et al. 7
6. CONCLUSION AND FUTURE WORK
This paper presents an easy, fast, and reliable stereo obsta-
cle detection technique for a start-inhibit system. Cameras
mounted on a vehicle are arbitrary aligned, meaning that no
special alignment is required by specialists or IT profession-
als. The choice of using a stereo vision system instead of radar
or ultrasonic devi ces stems from the fact that the driver can
see directly the image and can understand what caused the
alarm.
Tests were made in several environmental conditions
considering different kinds of road and obstacles, even with
different illumination conditions. Low illumination condi-
tions do not affect the system behavior because headlamps
light up only the interesting part of vertical obstacles, eas-
ing the detection. To avoid light reflection, polarizing filters
could be mounted in front of cameras.
Figure 12 shows some examples of the algorithm output
remapped onto the original image. Red circles are used to
mark obstacles positions. On the long tests performed, no
false negatives were found: every single pedestrian and every
tall enoug h obstacle were detected. Some false positives were
generated by reflective road surfaces (water, e.g.).
Taking advantage of the stereo approach, the road tex-
ture, road markings, and shadows are successfully filtered
out. Moreover, the algorithm easily detects large obstacles,
rejecting most of smaller ones, like sidewalk borders. In gen-
eral, due to the particular configuration of the system, verti-
calobjectsarecorrectlydetected,thustheuseofimagetrack-
ing or temporal comparisons seems not mandatory.
Future developments will be centered on providing an
automated algorithm to calibrate the system. A standard grid
with easily recognizable markers will be placed in front of
vehicle and an automated calibration procedure will be en-
gagedbyanoperator.Thisprocedurewillbecomenecessary
only after major vehicle changes and/or maintenance.
ACKNOWLEDGMENT
The work described in this paper has been developed in the
framework of the Integrated Project APALACI-PReVENT,
a research activity funded by the European Commission to
contribute to road safety by developing and demonstrating
preventive safety technologies and applications.
REFERENCES
[1] A. Broggi, C. Caraffi,R.I.Fedriga,andP.Grisleri,“Obstacle
detection with stereo vision for off-road vehicle navigation,” in
Proceedings of IEEE Computer Society Conference on Computer
Vision and Pattern Recognition (CVPR ’05) , p. 65, San Diego,
Calif, USA, June 2005.
[2] M.Bertozzi,A.Broggi,andA.Fascioli,“Stereoinverseperspec-
tive mapping: theory and applications,” Image and Vision Com-
puting, vol. 16, no. 8, pp. 585–590, 1998.
[3] R. Labayrade, D. Aubert, and J P. Tarel, “Real time obstacle de-
tection on non flat road geometry through “v-disparity” rep-
resentation,” in Proceedings of IEEE Intelligent Vehicles Sympo-
sium, vol. 2, pp. 646–651, Versailles, France, June 2002.
[4] D. Claus and A. W. Fitzgibbon, “A rational function lens dis-
tortion model for general cameras,” in Proceedings of the IEEE
Computer Society Conference on Computer Vision and Pattern
Recognition (CVPR ’05), vol. 1, pp. 213–219, San Diego, Calif,
USA, June 2005.
[5] F. Devernay and O. Faugeras, “Straight lines have to be straight,”
Machine Vision and Applications, vol. 13, no. 1, pp. 14–24, 2001.
[6] R. Tsai, “A versatile camera calibration technique for high-
accuracy 3D machine vision metrology using off-the-shelf TV
cameras and lenses,” IEEE Journal of Robotics and Automation,
vol. 3, no. 4, pp. 323–344, 1987.
[7] M. Bertozzi, A. Broggi, P. Medici, P. P. Porta, and A. Sj
¨
ogren,
“Stereo vision-based start-inhibit for heavy goods vehicles,” in
Proceedings of IEEE Intelligent Vehicles Symposium (IVS ’06),pp.
350–355, Tokyo, Japan, June 2006.
[8] M. Bertozzi and A. Broggi, “GOLD: a parallel real-time stereo
vision system for generic obstacle and l ane detection,” IEEE
Transactions on Image Processing, vol. 7, no. 1, pp. 62–81, 1998.
[9] K. Lee and J. Lee, “Generic obstacle detection on roads by dy-
namic programming for remapped stereo images to an over-
head view,” in Proceedings of IEEE International Conference on
Networking, Sensing and Control (ICNSC ’04), vol. 2, pp. 897–
902, Taipei, Taiwan, March 2004.