Báo cáo hóa học: " Research Article Low-Complexity Geometry-Based MIMO Channel Simulation" doc
Bạn đang xem bản rút gọn của tài liệu. Xem và tải ngay bản đầy đủ của tài liệu tại đây (1.56 MB, 17 trang )
Hindawi Publishing Corporation
EURASIP Journal on Advances in Signal Processing
Volume 2007, Article ID 95281, 17 pages
doi:10.1155/2007/95281
Research Article
Low-Complexity Geometry-Based MIMO Channel Simulation
Florian Kaltenberger,
1
Thomas Zemen,
2
and Christoph W. Ueberhuber
3
1
Austrian Research Centers GmbH (ARC), Donau-City-Strasse 1, 1220 Vienna, Austria
2
ftw. Forschungszentrum Telekommunikation Wien, Donau-City-Strasse 1, 1220 Vienna, Austria
3
Institute for Analysis and Scientific Computing, Vienna University of Technology,
Wiedner Hauptstrasse 8-10/101, 1040 Vienna, Austria
Received 30 September 2006; Revised 9 February 2007; Accepted 18 May 2007
Recommended by Marc Moonen
The simulation of electromagnetic wave propagation in time-variant wideband multiple-input multiple-output mobile radio
channels using a geometry-based channel model (GCM) is computationally expensive. Due to multipath propagation, a large
number of complex exponentials must be evaluated and summed up. We present a low-complexity algorithm for the implementa-
tion of a GCM on a hardware channel simulator. Our algorithm takes advantage of the limited numerical precision of the channel
simulator by using a truncated subspace representation of the channel transfer function based on multidimensional discrete pro-
late spheroidal (DPS) sequences. The DPS subspace representation offers two advantages. Firstly, only a small subspace dimension
is required to achieve the numerical accuracy of the hardware channel simulator. Secondly, the computational complexity of the
subspace representation is independent of the number of multipath components (MPCs). Moreover, we present an algorithm for
the projection of each MPC onto the DPS subspace in O(1) operations. Thus the computational complexity of the DPS subspace
algorithm compared to a conventional implementation is reduced by more than one order of magnitude on a hardware channel
simulator with 14-bit precision.
Copyright © 2007 Florian Kaltenberger et al. This is an open access article distributed under the Creative Commons Attribution
License, which permits unrestricted use, distribution, and reproduction in any medium, provided the original work is properly
cited.
1. INTRODUCTION
In mobile radio channels, electromagnetic waves propagate
from the transmitter to the receiver via multiple paths. A
geometry-based channel model (GCM) assumes that ev-
ery multipath component (MPC) can be modeled as a
plane wave, mathematically represented by a complex expo-
nential function. The computer simulation of time-var iant
wideband multiple-input multiple-output (MIMO) chan-
nels based on a GCM is computationally expensive, since
a large number of complex exponential functions must be
evaluatedandsummedup.
This paper presents a novel low-complexity algorithm for
the computation of a GCM on hardware channel simulators.
Hardware channel simulators [1–5]allowonetosimulate
mobile radio channels in real time. They consist of a pow-
erful baseband signal processing unit and radio frequency
frontends for input and output. In the baseband processing
unit, two basic operations are performed. Firstly, the channel
impulse response is calculated according to the GCM. Sec-
ondly, the transmit signal is convolved with the channel im-
pulse response. The processing power of the baseband unit
limits the number of MPCs that can be calculated and hence
the model accuracy. We note that the accuracy of the channel
simulator is limited by the arithmetic precision of the base-
band unit as well as the resolution of the analog/digital con-
verters. On the ARC SmartSim channel simulator [2], for ex-
ample, the baseband processing hardware uses 16-bit fixed-
point processors and an analog/digital converter with 14-bit
precision. This corresponds to a maximum achievable accu-
racy of E
max
= 2
−13
.
The new simulation algorithm presented in this paper
takes advantage of the limited numerical accuracy of hard-
ware channel simulators by using a truncated basis expan-
sion of the channel transfer function. The basis expansion
is based on the fact that wireless fading channels are highly
oversampled. Index-limited snapshots of the sampled fad-
ing process span a subspace of small dimension. The same
subspace is also spanned by index-limited discrete prolate
spheroidal (DPS) sequences [6]. In this paper, we show that
the projection of the channel transfer function onto the DPS
subspace can be calculated approximately but very efficiently
2 EURASIP Journal on Advances in Signal Processing
in O(1) operations from the MPC parameters given by the
model. Furthermore, the subspace representation is indepen-
dent of the number of MPCs. Thus, in the hardware sim-
ulation of wireless communication channels, the number of
paths can be increased and more realistic models can be com-
puted. By adjusting the dimension of the subspace, the ap-
proximation error can be made smaller than the numerical
precision given by the hardware, allowing one to tr ade accu-
racy for efficiency. Using multidimensional DPS sequences,
the DPS subspace representation can also be extended to sim-
ulate t ime-variant wideband MIMO channel models.
One particular application of the new algorithm is the
simulation of Rayleigh fading processes using Clarke’s [7]
channel model. Clarke’s model for time-variant frequency-
flat single-input single-output (SISO) channels assumes that
the angles of arrival (AoAs) of the MPCs are uniformly
distributed. Jakes [8] proposed a simplified version of this
model by assuming that the number of MPCs is a multiple of
four and that the AoAs are spaced equidistantly. Jakes’ model
reduces the computational complexity of Clarke’s model by
a factor of four by exploiting the symmetry of the AoA dis-
tribution. However, the second-order statistics of Jakes’ sim-
plification do not match the ones of Clarke’s model [9]and
Jakes’ model is not wide-sense stationary [10]. Attempts to
improve the second-order statistics while keeping the re-
duced complexity of Jakes’ model are reported in [6, 9–14].
However, due to the equidistant spacing of the AoAs, none of
these models achieves all the desirable statistical properties of
Clarke’s reference model [ 15]. Our new approach presented
in this paper allows us to reduce the complexity of Clarke’s
original model by more than an order of magnitude without
imposing any restrictions on the AoAs.
Contributions of the paper
(i) We apply the DPS subspace representation to derive a
low-complexity algorithm for the computation of the
GCM.
(ii) We introduce approximate DPS wave functions to cal-
culate the projection onto the subspace in O(1) oper-
ations.
(iii) We provide a detailed error and complexity analysis
thatallowsustotradeefficiency for accuracy.
(iv) We extend the DPS subspace projection to multiple di-
mensions and describe a novel way to calculate multi-
dimensional DPS sequences using the Kronecker prod-
uct formalism.
Notation.Let
Z, R,andC denote the set of integers, real
and complex numbers, respectively. Vectors are denoted by
v and mat rices by V. Their elements are denoted by v
i
and
V
i,l
, respectively. Transposition of a vector or a matrix is in-
dicated by
·
T
and conjugate transposition by ·
H
. The Eu-
clidean (
2
) norm of the vector a is denoted by a.The
Kronecker product and the Khatri-Rao product (columnwise
Kronecker product) are denoted by
⊗ and ,respectively.
The inner product of two vectors of length N is defined as
x, y=
N−1
i
=0
x
i
y
∗
i
,where·
∗
denotes complex conjugation.
If X is a discrete index set,
|X| denotes the number of el-
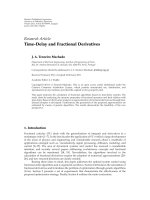
Scatterer
Scatterer
Transm i t ter
Receiver
v
η
1
e
j2πω
1
t
η
2
e
j2πω
2
t
η
0
e
j2πω
0
t
Figure 1: GCM for a time-variant frequency-flat SISO channel. Sig-
nals sent from the transmitter, moving at speed v, arrive at the re-
ceiver via different paths. Each MPC p has complex weight η
p
and
Doppler shift ω
p
[16].
ements of X.IfX is a continuous region, |X| denotes the
Lebesgue measure of X.AnN-dimensional sequence v
m
is a
function from m
∈ Z
N
onto C.ForanN-dimensional, finite
index set I
⊂ Z
N
, the elements of the sequence v
m
, m ∈ I,
may be collected in a vector v. For a parameterizable func-
tion f ,
{ f } denotes the family of functions over the whole
parameter space. The absolute value, the phase, the real part,
and the imaginary part of a complex variable a are denoted
by
|a|, Φ(a), a,anda,respectively.E {·} denotes the ex-
pectation operator.
Organization of the paper
In Section 2, a subspace representation of time-variant
frequency-flat SISO channels based on one-dimensional DPS
sequences is derived. The main result of the paper, that is,
the low-complexity calculation of the basis coefficients of the
DPS subspace representation, is given in Section 3 . Section 4
extends the DPS subspace representation to higher dimen-
sions, enabling the computer simulation of wideband MIMO
channels. A summary and conclusions are given in Section 5 .
Appendix A proposes a novel way to calculate the multidi-
mensional DPS sequences utilizing the Kronecker product.
Appendix B gives a detailed proof of a central theorem. A list
of symbols is defined in Appendix C.
2. THE DPS SUBSPACE REPRESENTATION
2.1. Time-variant frequency-flat S ISO geometry-based
channel model
We start deriving the DPS subspace representation for the
generic GCM for time-variant f requency-flat SISO channels
depicted in Figure 1. The GCM assumes that the channel
transfer function h(t) can be written as a superposition of
P MPCs:
h(t)
=
P−1
p=0
η
p
e
2πjω
p
t
,(1)
where each MPC is characterized by its complex weight η
p
,
which embodies the gain and the phase shift, as well as its
Florian Kaltenberger et al. 3
−ν
Dmax
ν
Dmax
−
1
2
1
2
H(ν)
Figure 2: Doppler spectrum H(ν) of the sampled time-variant
channel transfer f unction h
m
. The maximum normalized Doppler
bandwidth 2ν
Dmax
is much smaller than the available normalized
channel bandwidth.
Doppler shift ω
p
.With1/T
S
denoting the sampling rate of
the system, the sampled channel transfer function can be
written as
h
m
= h
mT
S
=
P−1
p=0
η
p
e
2πjν
p
m
,(2)
where ν
p
= ω
p
T
S
is the normalized Doppler shift of the pth
MPC. We refer to (2) as the sum of complex exponentials
(SoCE) algorithm for computing the channel transfer func-
tion h
m
.
We assume that the normalized Doppler shifts ν
p
are
bounded by the maximum (one-sided) normalized Doppler
bandwidth ν
Dmax
, which is given by the maximum speed v
max
of the transmitter, the carrier frequency f
C
, the speed of light
c, and the sampling rate 1/T
S
,
ν
p
≤
ν
Dmax
=
v
max
f
C
c
T
S
. (3)
In typical wireless communication systems, the maximum
normalized Doppler bandwidth 2ν
Dmax
is much smal ler than
the available normalized channel bandwidth (see Figure 2):
ν
Dmax
1
2
. (4)
Thus, the channel transfer function (1) is highly oversam-
pled.
Clarke’s model [17]isaspecialcaseof(2)andassumes
that the AoAs ψ
p
of the impinging MPCs are distributed uni-
formly on the interval [
−π, π) and that E {|η
p
|
2
}=1/P.The
normalized Doppler shift ν
p
of the pth MPC is related to the
AoA ψ
p
by ν
p
= ν
Dmax
cos(ψ
p
). Jakes’ model [8] and its vari-
ants [9–14] assume that the AoAs ψ
p
are spaced equidistantly
with some (random) offset ϑ:
ψ
p
=
2πp+ ϑ
P
, p
= 0, , P − 1. (5)
If P is a multiple of four, symmetries can be utilized and
only P/4 sinusoids have to be evaluated [8]. However, the
second-order statistics of such models do not match the ones
of Clarke’s original model [9].
In this paper, a truncated subspace representation is used
to reduce the complexity of the GCM (2). The subspace rep-
resentation does not require special assumptions on the AoAs
ψ
p
. It is based on DPS sequences, which are introduced in the
following section.
2.2. DPS sequences
In this section, one-dimensional DPS sequences are re-
viewed. They were introduced in 1978 by Slepian [17]. Their
applications include spectrum estimation [18], approxima-
tion, and prediction of band-limited signals [15, 17]aswell
as channel estimation in wireless communication systems
[6]. DPS sequences can be generalized to multiple dimen-
sions [19]. Multidimensional DPS s equences are reviewed in
Section 4.2, where they are used for wideband MIMO chan-
nel simulation.
Definition 1. The one-dimensional discrete prolate spheroid-
al (DPS) sequences v
(d)
m
(W, I) with band-limit W = [−ν
Dmax
,
ν
Dmax
] and concentration region I ={M
0
, , M
0
+ M − 1}
are defined as the real solutions of
M
0
+M−1
n=M
0
sin
2πν
Dmax
(m − n)
π(n − m)
v
(d)
n
(W, I)
= λ
d
(W, I)v
(d)
m
(W, I).
(6)
They are sorted such that their eigenvalues λ
d
(W, I)arein
descending order:
λ
0
(W, I) >λ
1
(W, I) > ··· >λ
M−1
(W, I). (7)
To ease notation, we drop the explicit dependence of
v
(d)
m
(W, I)onW and I when it is clear from the context. Fur-
ther, we define the DPS vector v
(d)
(W, I) ∈ C
M
as the DPS
sequence v
(d)
m
(W, I) index-limited to I.
The DPS vectors v
(d)
(W, I) are also eigenvectors of the
M
× M matrix K w ith elements K
m,n
= sin(2πν
Dmax
(m−n))/
π(n
− m). The eigenvalues of this matrix decay exponentially
and thus render numerical calculation difficult. Fortunately,
there exists a tridiagonal matrix commuting with K,which
enables fast and numerically stable calculation of DPS se-
quences [17, 20]. Figures 3 and 4 illustrate one-dimensional
DPS sequences and their eigenvalues, respectively.
Some properties of DPS sequences are summarized in the
following theorem.
Theorem 1. (1) The sequences v
(d)
m
(W, I) are band-limited to
W.
(2) The eigenvalue λ
d
(W, I) of the DPS sequence
v
(d)
m
(W, I) denotes the energy concentration of the sequence
w ithin I:
λ
d
(W, I) =
m∈I
v
(d)
m
(W, I)
2
m∈Z
v
(d)
m
(W, I)
2
. (8)
(3) The eigenvalues λ
d
(W, I) satisfy 1 <λ
i
(W, I) < 0.
They are clustered around 1 for d
≤ D
− 1, and decay ex-
ponentially for d
≥ D
,whereD
=|W||I| +1.
(4) The DPS sequences v
(d)
m
(W, I) are orthogonal on the
index set I and on
Z.
(5) Every band-limited sequence h
m
can be decomposed
uniquely as h
m
= h
m
+ g
m
,whereh
m
is a linear combination of
DPS sequences v
(d)
m
(W, I) for some I and g
m
= 0 for all m ∈ I.
4 EURASIP Journal on Advances in Signal Processing
0.15
0.1
0.05
0
−0.05
−0.1
0 50 100 150 200 250
m
v
(0)
m
v
(1)
m
v
(2)
m
Figure 3: The first three one-dimensional DPS sequences v
(0)
m
, v
(1)
m
,
and v
(2)
m
for M
0
= 0, M = 256, and Mν
Dmax
= 2.
10
0
10
−1
10
−2
10
−3
10
−4
10
−5
10
−6
10
−7
Eigenvalue
0123456789
d
Figure 4: The first ten eigenvalues λ
d
, d = 0, ,9, of the one-
dimensional DPS sequences for M
0
= 0, M = 256, and Mν
Dmax
= 2.
The eigenvalues are clustered around 1 for d
≤ D
−1, and decay ex-
ponentially for d
≥ D
, where the essential dimension of the signal
subspace D
=2ν
Dmax
M +1= 5.
Proof. See Slepian [17].
2.3. DPS subspace representation
The time-variant fading process
{h
m
} given by the model in
(2) is band-limited to the region W
= [−ν
Dmax
, ν
Dmax
]. Let
I
={M
0
, , M
0
+ M − 1} denote a finite index set on which
we want to calculate h
m
.Duetoproperty(5)ofTheorem 1,
h
m
can be decomposed into h
m
= h
m
+g
m
,whereh
m
is a linear
combination of the DPS sequences v
(d)
m
(W, I)andh
m
= h
m
for all m ∈ I. Therefore, the vectors
h
=
h
M
0
, h
M
0
+1
, , h
M
0
+M−1
T
∈ C
M
(9)
obtained by index limiting h
m
to I can be represented as a
linear combination of the DPS vectors
v
(d)
(W, I)
=
v
(d)
M
0
(W, I), v
(d)
M
0
+1
(W, I), , v
(d)
M
0
+M−1
(W, I)
T
∈ C
M
.
(10)
Properties (2) and (3) of Theorem 1 show that the first
D
=2ν
Dmax
M + 1 DPS sequences contain almost all of
their energy in the index-set I. Therefore, the vectors
{h}
span a subspace with essential dimension [6]
D
=
2Mν
Dmax
+1. (11)
Due to (4), the time-variant fading process is highly over-
sampled. Thus the maximum number of subspace dimen-
sions M is reduced by 2ν
Dmax
1. In t ypical wireless com-
munication systems, the essential subspace dimension D
is
in the order of two to five only. This fact is exploited in the
following definition.
Definition 2. Let h be a vector obtained by index limiting a
band-limited process with band-limit W to the index set I.
Further, collect the first D DPS vectors v
(d)
(W, I) in the ma-
trix
V
=
v
(0)
(W, I), , v
(D−1)
(W, I)
. (12)
The DPS subspace representation of h with dimension D is
defined as
h
D
= Vα, (13)
where α is the projection of the vector h onto the columns of
V:
α = V
H
h. (14)
For the purpose of channel simulation, it is possible to
use D>D
DPS vectors in order to increase the numerical ac-
curacy of the subspace representation. The subspace dimen-
sion D has to be chosen such that the bias of the subspace
representation is small compared to the machine precision
of the underlying simulation hardware. This is illustrated in
Section 3.2 by numerical examples.
In terms of complexity, the problem of computing the
series (2) was reformulated into the problem of computing
the basis coefficients α of the subspace representation (13). If
they were computed directly using (14), the complexity of the
problem would not be reduced. In the following section, we
derive a novel low-complexity method to calculate the basis
coefficients α approximately.
Florian Kaltenberger et al. 5
3. MAIN RESULT
3.1. Approximate calculation of the basis coefficients
In this section, an approximate method to calculate the basis
coefficients α in (13) with low complexity is presented. Until
now we have only considered the time domain of the channel
and assumed that the band limiting region W is symmetric
around the origin. To make the methods in this section also
applicable to the frequency domain and the spatial domains
(cf. Section 4), we make the more general assumption that
W
=
W
0
− W
max
, W
0
+ W
max
. (15)
The projection of a single complex exponential vector
e
p
= [e
2πjν
p
M
0
, , e
2πjν
p
(M
0
+M−1)
]
T
onto the basis funct ions
v
(d)
(W, I) can be written as a function of the Doppler shift
ν
p
, the band-limit region W, and the index set I,
γ
d
ν
p
; W, I
=
M
0
+M−1
m=M
0
v
(d)
m
(W, I)e
2πjmν
p
. (16)
Since h can be written as
h =
P−1
p=0
η
p
e
p
, (17)
the basis coefficients α (14) can be calculated by
α
=
P−1
p=0
η
p
V
H
e
p
=
P−1
p=0
η
p
γ
p
, (18)
where γ
p
= [γ
0
(ν
p
; W, I), , γ
D−1
(ν
p
; W, I)]
T
denote the
basis coefficients for a single MPC.
To calculate the basis coefficients γ
d
(ν
p
; W, I), we take
advantage of the DPS wave functions U
d
( f ; W,I). For the
special case W
0
= 0andM
0
= 0 the DPS wave functions
are defined in [17]. For the more general case, the DPS wave
functions are defined as the eigenfunct ions of
W
sin
Mπ(ν − ν
)
sin
π(ν − ν
)
U
d
(ν
; W, I)dν
= λ
d
(W, I)U
d
(ν; W, I), ν ∈ W.
(19)
They are normalized such that
W
U
d
(ν; W, I)
2
dν = 1,
U
d
W
0
; W, I
≥
0,
dU
d
(ν; W, I)
df
ν=W
0
≥ 0,
d
= 0, , D − 1.
(20)
The DPS wave functions are closely related to the DPS
sequences. It can be shown that the amplitude spectrum of
a DPS sequence limited to m
∈ I is a scaled version of the
associated DPS wave function (cf. [17, equation (26)])
U
d
(ν; W, I) =
d
M
0
+M−1
m=M
0
v
(d)
m
(W, I)e
− jπ(2M
0
+M−1−2m)ν
,
(21)
where
d
= 1ifd is even, and
d
= j if d is odd.
Comparing (16)with(21) shows that the basis coeffi-
cients can be calculated according to
γ
d
ν
p
; W, I
=
1
d
e
jπ(2M
0
+M−1)ν
p
U
d
ν
p
; W, I
. (22)
The following definition and theorem show that U
d
(ν
p
; W, I)
can be approximately calculated from v
(d)
m
(W, I) by a simple
scaling and shifting operation [21].
Definition 3. Let v
(d)
m
(W, I) be the DPS sequences with band-
limit region W
= [W
0
− W
max
, W
0
+ W
max
] and index set
I
={M
0
, , M
0
+ M − 1}. Further denote by λ
d
(W, I) the
corresponding eigenvalues. For ν
p
∈ W define the index m
p
by
m
p
=
1+
ν
p
− W
0
W
max
M
2
. (23)
Approximate DPS wave functions are defined as
U
d
ν
p
; W, I
:=±e
2πj(M
0
+M−1+m
p
)W
0
λ
d
M
2W
max
v
(d)
m
p
(W, I),
(24)
where the sign is taken such that the following normalization
holds:
U
d
W
0
; W, I
≥
0,
d
U
d
ν
p
; W, I
dν
p
ν
p
=W
0
≥ 0,
d
= 0, , D − 1.
(25)
Theorem 2. Let ψ
d
(c, f ) be the p rolate spheroidal wave func-
tions [22]. Let c>0 be g iven and set
M
=
c
πW
max
. (26)
If W
max
→ 0,
W
max
U
d
W
max
ν
p
; W, I
∼ ψ
d
c, ν
p
,
W
max
U
d
W
max
ν
p
; W, I
∼ ψ
d
c, ν
p
.
(27)
In other words, both the approximate DPS wave functions as
well as the DPS wave functions themselves converge to the pro-
late spheroidal wave functions.
Proof. For W
0
= 0andM
0
= 0, that is, W
= [−W
max
,
W
max
]andI
={0, , M − 1} the proof is given in [17, Sec-
tion 2.6]. The general case follows by using the two identities
v
(d)
m
(W, I) = e
2πj(m+M
0
)W
0
v
(d)
m+M
0
(W
, I
),
U
d
(ν, W, I) = e
πj(2M
0
+M−1)(ν−W
0
)
U
d
ν − W
0
; W
, I
.
(28)
6 EURASIP Journal on Advances in Signal Processing
Theorem 2 suggests that the approximate DPS wave
functions can be used as an approximation to the DPS wave
functions. Therefore, the basis coefficients (22)canbecalcu-
lated approximately by
γ
d
ν
p
; W, I
:=
1
d
e
jπ(2M
0
+M−1)ν
p
U
d
ν
p
; W, I
. (29)
The theorem does not indicate the quality of the approx-
imation. It can only be deduced that the approximation im-
proves as the bandwidth W
max
decreases, while the number
of samples M
=c/πW
max
increases. This fact is exploited
in the following definition.
Definition 4. Let h be a vector obtained by index limiting a
band-limited process of the form (2) with band-limit W
=
[W
0
− W
max
, W
0
+ W
max
] to the index set I ={M
0
, , M
0
+
M
−1}. For a positive integer r—the resolution factor—define
I
r
=
M
0
, M
0
+1, , M
0
+ rM − 1
,
W
r
=
W
0
−
W
max
r
, W
0
+
W
max
r
.
(30)
The approximate DPS subspace representation with dimen-
sion D and resolution factor r is given by
h
D,r
= Vα
r
(31)
whose approximate basis coefficients are
α
r
d
=
P−1
p=0
η
p
γ
d
ν
p
r
, W
r
, I
r
. (32)
Note that the DPS sequences are required in a higher res-
olution only for the calculation of the approximate basis co-
efficients. The resulting
h
D,r
has the same sample rate for any
choice of r.
3.2. Bias of the subspace representation
In this subsection, the square bias of the subspace represen-
tation
bias
2
h
D
= E
1
M
h −
h
D
2
(33)
and the square bias of the approximate subspace representa-
tion
bias
2
h
D,r
= E
1
M
h −
h
D,r
2
(34)
are analyzed.
For ease of notation, we assume ag ain that W
= [−ν
Dmax
,
ν
Dmax
], that is, we set W
0
= 0andW
max
= ν
Dmax
.However,
the results also hold for the general case (15). If the Doppler
shifts ν
p
, p = 0, , P − 1, are distributed independently and
uniformly on W, the DPS subspace representation
h coin-
cides with the Karhunen-Lo
`
eve transform of h [23] and it
can be shown that
bias
2
h
D
=
1
Mν
Dmax
M
−1
d=D
λ
d
(W, I). (35)
Table 1: Simulation parameters for the numerical experiments in
the time domain. The carrier frequency and the sample rate resem-
ble those of a UMTS system [24]. The block length is chosen to be
as long as a UMTS frame.
Parameter Valu e
Carrier frequency f
c
2GHz
Sample rate 1/T
S
3.84 MHz
Block length M
2560 samples
Mobile velocity v
max
100 km/h
Maximum norm. Doppler ν
Dmax
4.82 × 10
−5
If the Doppler shifts ν
p
, p = 0, , P − 1, are not distributed
uniformly, (35) can still be used as an approximation for the
square bias [21].
For the square bias of the approximate DPS subspace rep-
resentation
h
D,r
, no analytical results are available. However,
for the minimum achievable square bias, we conjecture that
bias
2
min,r
= min
D
bias
2
h
D,r
≈
2ν
Dmax
r
2
. (36)
This conjecture is substantiated by numerical Monte-
Carlo simulations using the parameters from Ta ble 1.The
Doppler shifts ν
p
, p = 0, , P − 1, are distributed inde-
pendently and uniformly on W. The results are illustrated in
Figure 5. It can be seen that the square bias of the subspace
representation bias
2
h
D
decays with the subspace dimension.
For D
≥2Mν
Dmax
+1 = 2 this decay is even exponen-
tial. These two properties can also be seen directly from (35)
and the exponential decay of the eigenvalues λ
d
(W, I). The
square bias bias
2
h
D,r
of the approximate subspace representa-
tion is similar to bias
2
h
D
up to a certain subspace dimension.
Thereafter, the square bias of the approximate subspace rep-
resentation levels out at bias
2
min,r
≈ (2ν
Dmax
/r)
2
. Increasing
the resolution fac tor pushes the levels further down.
Let the maximal allowable square error of the simulation
be denoted by E
2
max
. Then, the approximate subspace repre-
sentation can be used without loss of accuracy if D and r are
chosen such that
bias
2
h
D,r
!
≤ E
2
max
. (37)
Good approximations for D and r can be found by
D
= argmin
D
bias
2
h
D
≤ E
2
max
, r = argmin
r
bias
2
min,r
≤ E
2
max
.
(38)
The first expression can be computed using (35). Using con-
jecture (36), the latter evaluates to
r
=
2ν
Dmax
E
max
. (39)
Using a 14-bit fixed-point processor, the maximum
achievable accuracy is E
2
max
= (2
−13
)
2
≈ 1.5 × 10
−8
.For
the example of Figure 5, where the maximum Doppler shift
ν
Dmax
= 4.82 × 10
−5
and the number of samples M = 2560,
the choice D
= 4andr = 2 makes the simulation as accurate
as possible on this hardware. Depending on the application,
a lower accuracy might also be sufficient.
Florian Kaltenberger et al. 7
10
0
10
−5
10
−10
10
−15
Bias
2
12345678910
D
Bias M
= 2560
Bias apx r
= 1
Bias apx r
= 2
Bias apx r
= 4
Bias apx min r
= 1
Bias apx min r
= 2
Bias apx min r
= 4
Figure 5: bias
2
h
D
(denoted by “bias”), bias
2
h
D,r
(denoted by “bias
apx”), and bias
2
min,r
(denoted by “bias apx min”) for ν
Dmax
= 4.82 ×
10
−5
and M = 2560. The factor r denotes the resolution factor.
3.3. Complexity and memory requirements
In this subsection, the computational complexity of the ap-
proximate subspace representation (31) is compared to the
SoCE algorithm (2). The complexity is expressed in num-
ber of complex multiplications (CM) and evaluations of the
complex exponential (CE). Additionally, we compare the
number of memory access (MA) operations, which gives a
better complexity comparison than the actual memory re-
quirements.
We assume that all complex numbers are represented us-
ing their real and imaginary part. A CM thus requires four
multiplication and two addition opera tions. As a reference
for a CE we use a table look-up implementation w ith lin-
ear interpolation for values between table elements [2]. This
implementation needs six addition, four multiplication, and
two memory access operations.
Let the number of operations that are needed to evaluate
h and
h be denoted by C
h
and C
h
, respectively. Using the
SoCE algorithm, for every m
∈ I ={M
0
, , M
0
+M−1} and
every p
= 0, , P − 1,aCEandaCMhavetobeevaluated,
that is,
C
h
= MP CE + MP CM. (40)
For the approximate DPS subspace representation with
dimension D, first the approximate basis coefficients
α have
to be evaluated, requiring
C
α
= DP(CE + 2 CM + MA) + DP CM (41)
10
7
10
6
10
5
10
4
No. operations
10 20 30 40 50 60 70 80 90 100
10
4
10
5
10
6
Memory accesses
P
DPSS no. operations
SoCE no. operations
DPSS memory access
SoCE memory access
Figure 6: Complexity in terms of number of arithmetic operations
(left abscissa) and memory access operations (right abscissa) versus
the number of MPCs P. We show results for the sum of complex
exponentials algorithm (denoted by “SoCE”) and the approximate
subspace representation (denoted by “DPSS”) using M
= 2560,
ν
Dmax
= 4.82 × 10
−5
,andD = 4.
operations where the first term accounts for (29) and the sec-
ond term for (32). In total, for the evaluation of the approxi-
mate subspace representation (31),
C
h
= MD(CM + MA) + C
α
(42)
operations are required. For large P, the approximate DPS
subspace representation reduces the number of arithmetic
operations compared to the SoCE algorithm by
C
h
C
h
−→
M(CE + CM)
D(CE + 3 CM)
. (43)
The memory requirements of the DPS subspace repre-
sentation are determined by the block length M, the sub-
space dimension D and the resolution factor r. If the DPS
sequences are stored with 16-bit precision,
Mem
h
= 2rMD byte (44)
are needed.
In Figure 6, C
h
and C
h
are plotted over the number of
paths P for the parameters given in Tab le 1 . Multiplications
and additions are counted as one operation. Memory access
operations are counted separately. The subspace dimension
is chosen to be D
= 4 according to the observations of the last
subsection. The memory requirements for the DPS subspace
representation are Mem
h
= 80 kbyte.
It can be seen that the complexity of the approximate
DPS subspace representation in terms of number of arith-
metic operations as well as memory access operations in-
creases with slope D, while the complexity of the SoCE al-
gorithm increases with slope M. Since in the given example
8 EURASIP Journal on Advances in Signal Processing
Scatterer
Scatterer
Transm i t ter
Receiver
v
ϕ
0
ϕ
1
ϕ
2
ψ
0
ψ
1
ψ
2
Figure 7: Multipath propagation model for a time-variant wide-
band MIMO radio channel. The signals sent from the transmitter,
moving at speed v, arrive at the receiver. Each path p has complex
weight η
p
,timedelayτ
p
, Doppler shift ω
p
, angle of departure ϕ
p
,
and angle of arrival ψ
p
.
D M, the approximate DPS subspace representation al-
ready enables a complexity reduction by more than one order
of magnitude compared to the SoCE algorithm for P
= 30
paths. Asymptotically, the number of arithmetic operations
can be reduced by a factor of C
h
/C
h
→ 465.
4. WIDEBAND MIMO CHANNEL SIMULATION
4.1. The wideband MIMO geometry-based
channel model
The time-variant GCM described in Section 2.1 can be ex-
tended to describe time-variant wideband MIMO channels.
For simplicity we assume uniform linear arrays (ULA) with
omnidirectional antennas. Then the channel can be de-
scribed by the time-variant wideband MIMO channel trans-
fer function h(t, f , x, y), where t denotes time, f denotes fre-
quency, x the position of the transmit antenna on the ULA,
y the position of the receive antenna on the ULA [25].
The GCM assumes that h(t, f , x, y)canbewrittenasa
superposition of P MPCs,
h(t, f , x, y)
=
P−1
p=0
η
p
e
2πjω
p
t
e
−2πjτ
p
f
e
2πj/λsin ϕ
p
x
e
−2πj/λsin ψ
p
y
,
(45)
where every MPC is characterized by its complex weight η
p
,
its Doppler shift ω
p
, its delay τ
p
, its ang le of departure (AoD)
ϕ
p
, a nd its AoA ψ
p
(see Figure 7)andλ is the wavelength.
More sophisticated models may also include parameters such
as elevation angle, antenna patterns, and polarization.
There exist many models for how to obtain the param-
eters of the MPCs. They can be categorized as determinis-
tic, geometry-based stochastic,andnongeometrical stochast ic
models [26]. The number of MPCs required depends on the
scenario modeled, the system bandwidth, and the number of
antennas used. In this paper, we choose the number of MPCs
such that the channel is Rayleigh fading, except for the line-
of-sight component.
For narrowband frequency-flat systems, approximately
P
0
= 40 MPCs are needed to achieve a Rayleigh fading statis-
tics [13]. If the channel bandw idth is increased, the number
of resolvable MPCs increases also. The ITU channel models
[27], which are used for bandwidths up to 5 MHz in UMTS
systems, specify a power delay profile with up to six delay
bins. The I-METRA channel models for the IEEE 802.11n
wireless LAN standard [28]arevalidforupto40MHzand
specify a power delay profile with up to 18 delay bins. This
requires a total number of MPCs of up to P
1
= 18P
0
= 720.
Diffuse scattering can also be modeled using a GCM by in-
creasing the number of MPCs. In theory, diffuse scattering
results from the superposition of an infinite number of MPCs
[29]. However, good approximations can be achieved by us-
ing a large but finite number of MPCs [30, 31]. In MIMO
channels, the number of MPCs multiplies by N
Tx
N
Rx
, since
every antenna sees every scatterer from a different AoA and
AoD , respectively. For a 4
× 4 system, the total number of
MPCs can thus reach up to P
= 16P
1
= 1.2 × 10
4
.
We now show that the sampled time-variant wideband
MIMO channel transfer function is band-limited in time,
frequency, and space. Let F
S
denote the width of a fre-
quency bin and D
S
the distance between antennas. The sam-
pled channel transfer function can be described as a four-
dimensional sequence h
m,q,r,s
= h(mT
S
, qF
S
, rD
S
, sD
S
), where
m denotes discrete time, q denotes discrete frequency, s de-
notes the index of the transmit antenna, and r denotes the
index of the receive antenna.
1
Further, let ν
p
= ω
p
T
S
denote
the normalized Doppler shift, θ
p
= τ
p
F
S
the normalized de-
lay, ζ
p
= sin(ϕ
p
)D
S
/λ and ξ
p
= sin(ψ
p
)D
S
/λ the normalized
angles of departure and arrival, respectively. If all these in-
dices are collected in the vectors
m
= [m, q, s, r]
T
,
f
p
=
ν
p
, −θ
p
, ζ
p
, −ξ
p
T
,
(46)
h
m
can be written as
h
m
=
P−1
p=0
η
p
e
j2πf
p
,m
, (47)
that is, the multidimensional form of (2).
The band-limitation of h
m
in time, frequency, and space
is defined by the following physical parameters of the chan-
nel.
(1) The maximum normalized Doppler shift of the chan-
nel ν
Dmax
defines the band-limitation in the time do-
main. It is determined by the maximum speed of the
user v
max
, the carrier frequency f
C
, the speed of light c,
and the sampling rate 1/T
S
, that is,
ν
Dmax
=
v
max
f
C
c
T
S
. (48)
1
In the literature, the time-variant wideband MIMO channel is often rep-
resented by the matrix H(m, q), whose elements are related to the sam-
pled time-variant wideband MIMO channel transfer function h
m,q,r,s
by
H
r,s
(m, q) = h
m,q,r,s
.
Florian Kaltenberger et al. 9
(2) The maximum normalized delay of the scenario θ
max
defines the band-limitation in the frequency domain.
It is determined by the maximum delay τ
max
and the
sample rate 1/F
S
in frequency
θ
max
= τ
max
F
S
. (49)
(3) The minimum and maximum normalized AoA, ξ
min
and ξ
max
define the band-limitation in the spatial do-
main at the receiver. They are given by the minimum
and maximum AoA, ψ
min
and ψ
max
, the spatial sam-
pling distance D
S
and the wavelength λ:
ξ
min
= sin
ψ
min
D
S
λ
, ξ
max
= sin
ψ
max
D
S
λ
. (50)
The band-limitation at the transmitter is given simi-
larly by the normalized minimum and maximum nor-
malized AoD, ζ
min
and ζ
max
.
In summary it can be seen that h
m
is band-limited to
W
=
−
ν
Dmax
, ν
Dmax
×
0, θ
max
×
ζ
min
, ζ
max
×
ξ
min
, ξ
max
.
(51)
Thus the discrete time Fourier transform (DTFT)
H(f)
=
m∈Z
N
h
m
e
−2πjf,m
, f ∈ C
N
, (52)
vanishes outside the region W, that is,
H(f)
= 0, f /∈ W. (53)
4.2. Multidimensional DPS sequences
The fact that h
m
is band-limited allows one to extend the con-
cepts of the DPS subspace representation also to time-variant
wideband MIMO channels. Therefore, a generalization of the
one-dimensional DPS sequences to multiple dimensions is
required.
Definition 5. Let I
⊂ Z
N
be an N-dimensional finite index
set with L
=|I| elements, and W ⊂ (−1/2, 1/2)
N
an N-
dimensional band-limiting region. Multidimensional discrete
prolate spheroidal (DPS) sequences v
(d)
m
(W, I)aredefinedas
the solutions of the eigenvalue problem
m
∈I
v
(d)
m
(W, I)K
(W)
(m
− m) = λ
d
(W, I)v
(d)
m
(W, I),
m
∈ Z
N
,
(54)
where
K
(W)
(m
− m) =
W
e
2πjf
,m
−m
df
. (55)
They are sorted such that their eigenvalues λ
d
(W, I)arein
descending order
λ
0
(W, I) >λ
1
(W, I) > ··· >λ
L−1
(W, I). (56)
To ease notation, we drop the explicit dependence of
v
(d)
m
(W, I)onW and I when it is clear from the con-
text. Further, we define the multidimensional DPS vector
v
(d)
(W, I) ∈ C
L
as the multidimensional DPS sequence
v
(d)
m
(W, I) index-limited to I. In particular, if every element
m
∈ I is indexed lexicographically, such that I ={m
l
, l =
0, 1, , L − 1}, then
v
(d)
(W, I) =
v
(d)
m
0
(W, I), , v
(d)
m
L−1
(W, I)
T
. (57)
All the properties of Theorem 1 also apply to multidi-
mensional DPS sequences [19]. The only difference is that
m has to be replaced with m and
Z with Z
N
.
Example 1. In the two-dimensional case N
= 2 with band-
limiting region W and index set I given by
W
=
−
ν
Dmax
, ν
Dmax
×
0, θ
max
,
I
={0, , M − 1}×
−
Q
2
, ,
Q
2
−
1
.
(58)
Equation (54)reducesto
M−1
n=0
Q/2−1
p=−Q/2
sin
2πν
Dmax
(m − n)
π(n − m)
e
2πi(p−q)θ
max
− 1
2πi(p − q)
v
(d)
n,p
= λ
d
v
(d)
m,q
.
(59)
Note that due to the nonsymmetric band-limiting region W,
the solutions of (59) can take complex values. Examples of
two-dimensional DPS sequences and their eigenvalues are
given in Figures 8 and 9, respectively. They have been cal-
culated using the methods described in Appendix A.
4.3. Multidimensional DPS subspace representation
We assume that for hardware implementation, h
m
is calcu-
lated blockwise for M samples in time, Q bins in frequency,
N
Tx
transmit antennas, and N
Rx
receive antennas. Accord-
ingly, the index set is defined by
I
={0, , M − 1}×
−
Q
2
, ,
Q
2
−
1
×
0, , N
Tx
− 1
×
0, , N
Rx
− 1
.
(60)
The DPS subspace representation can easily be extended
to multiple dimensions. Let h be the vector obtained by in-
dex limiting the sequence h
m
(47) to the index set I (60)
and sorting the elements lexicographically. In analogy to the
one-dimensional case, the subspace spanned by
{h} is also
spanned by the multidimensional DPS vectors v
(d)
(W, I)de-
fined in Section 4.2. Due to the common notation of one-
and multidimensional sequences and vectors, the multidi-
mensional DPS subspace representation of h can be defined
similarly to Definition 2.
10 EURASIP Journal on Advances in Signal Processing
−0.1
0
0.1
v
(0)
m,q
10
0
−10
q
0
10
20
m
(a)
−0.1
0
0.1
v
(1)
m,q
10
0
−10
q
0
10
20
m
(b)
−0.1
0
0.1
v
(2)
m,q
10
0
−10
q
0
10
20
m
(c)
−0.1
0
0.1
v
(3)
m,q
10
0
−10
q
0
10
20
m
(d)
Figure 8: The real part of the first four two-dimensional DPS se-
quences v
(d)
m,q
, d = 0, ,3 for M = Q = 25, Mν
Dmax
= 2, and
Qθ
max
= 5.
10
0
10
−1
10
−2
10
−3
10
−4
10
−5
10
−6
10
−7
Eigenvalue
0 20 40 60 80 100
d
Figure 9: First 100 eigenvalues λ
d
, d = 0, , 99, of two-
dimensional DPS sequences for M
= Q = 25, Mν
Dmax
= 2, and
Qθ
max
= 5. The eigenvalues are clustered around 1 for d ≤ D
− 1,
and decay exponentially for d
≥ D
, where the essential dimension
of the signal subspace D
=|W||I| +1= 41.
Definition 6. Let h be a vector obtained by index limiting
a multidimensional band-limited process of the form (47)
with band-limit W to the index set I.Letv
(d)
(W, I)be
the multidimensional DPS vectors for the multidimensional
band-limit region W and the multidimensional index set I.
Further, collect the first D DPS vectors v
(d)
(W, I) in the ma-
trix
V
=
v
(0)
(W, I), , v
(D−1)
(W, I)
. (61)
The multidimensional DPS subspace representation of h with
subspace dimension D is defined as
h
D
= Vα, (62)
where α is the projection of the vector h onto the columns of
V:
α
= V
H
h. (63)
The subspace dimension D has to be chosen such that
the bias of the subspace representation is small compared to
the machine precision of the underlying simulation hard-
ware. The following theorem shows how the multidimen-
sional projection (63) can be reduced to a series of one-
dimensional projections.
Theorem 3. Let
h
D
be the N-dimensional DPS subspace rep-
resentation of h with subspace dimension D,band-limitingre-
gion W,andindexsetI.IfW and I can be written as Cartesian
products
W
= W
0
×···×W
N−1
, (64)
I
= I
0
×···×I
N−1
, (65)
Florian Kaltenberger et al. 11
where W
i
= [W
0,i
− W
max,i
, W
0,i
+ W
max,i
],andI
i
=
{
M
0,i
, , M
0,i
+ M
i
− 1}, then for every d = 0, , D − 1,
there exist d
0
, , d
N−1
such that the N-dimensional DPS basis
vectors v
(d)
(W, I) can be written as
v
(d)
(W, I) = v
(d
0
)
W
0
, I
0
⊗···⊗
v
(d
N−1
)
W
N−1
, I
N−1
.
(66)
Further, the basis coefficients of the approximate DPS subspace
representation
h
D
= Vα (67)
are given by
α =
P−1
p=0
η
p
γ
(0)
p
⊗···⊗γ
(N−1)
p
, (68)
where
γ
(i)
p,d
= γ
d
i
( f
p,i
, W
i
, I
i
) are the one-dimensional approxi-
mate basis coefficients defined in (29). Additionally, resolution
factors r
i
canbeusedtoimprovetheapproximation.
Proof. See Appendix B
The band-limiting region W (51) and the index set I
(60) of the channel model (47) fulfill the prerequisites of
Theorem 3 with
W
0,0
= 0, W
max,0
= ν
Dmax
, M
0,0
= 0, M
0
= M,
W
0,1
= W
max,1
=
θ
max
2
, M
0,1
=−
Q
2
, M
1
= Q,
W
0,2
=
ζ
max
+ ζ
min
2
, W
max,2
=
ζ
max
− ζ
min
2
,
M
0,2
= 0, M
2
= N
Tx
,
W
0,3
=
ξ
max
+ ξ
min
2
, W
max,3
=
ξ
max
− ξ
min
2
,
M
0,3
= 0, M
3
= N
Rx
.
(69)
Thus, Theorem 3 allows us to use the methods of Section 3.1
to calculate the basis coefficients of the multidimensional
DPS subspace representation approximately with low com-
plexity. The resolution factors r
i
, i = 0, , N − 1, have
to be chosen such that the bias of the subspace representa-
tion is small compared to the machine precision E
max
of the
underlying simulation hardware. A necessary but not suffi-
cient condition for this is to use the methods of Section 3.2
for each dimension independently, that is, to choose r
i
=
2W
max,i
/E
max
. However, it has to be verified numerically that
the multidimensional DPS subspace representation achieves
the required numerical accuracy.
4.4. Complexity and memory requirements
In this subsection, we evaluate the complexity and memory
requirements of the N-dimensional SoCE algorithm and the
N-dimensional approximate DPS subspace representation,
given by Theorem 3. These results are a generalization of the
results of Section 3.3. We assume that the one-dimensional
DPS sequences v
(d
i
)
(W
i
, I
i
), i = 0, , N − 1, have been pre-
calculated. Further, we assume that D
= D
0
···D
N−1
,where
D
i
= max d
i
is the maximum number of one-dimensional
DPS vectors in dimension i needed to construct the N-
dimensional vectors v
(d)
(W, I), d = 0, , D − 1.
Let the number of operations that are needed to evaluate
h (47)and
h
D
(67)bedenotedbyC
h
and C
h
D
,respectively.
For the SoCE algorithm,
C
h
=|I|P(CE + CM). (70)
For the approximate DPS subspace representation with
dimension D, firstly the N-dimensional DPS basis vectors
need to be calculated from the one-dimensional DPS vectors
(cf. (66)), requiring
C
V
= (N − 1)|I|D CM. (71)
Secondly, the approximate basis coefficients
α have to be
evaluated according to (68), requiring
C
α
=
N−1
i=0
D
i
(CE + CM + MA) + ND CM
P. (72)
In total, for the evaluation of the approximate subspace rep-
resentation (67),
C
h
D
=|I|D(CM + MA) + C
V
+ C
α
(73)
operations are required.
Asymptotically for P
→∞, the N-dimensional DPS sub-
space representation reduces the number of arithmetic oper-
ations compared to the SoCE algorithm by the factor
C
h
C
h
−→
|
I|(CE + CM)
N−1
i=0
D
i
(CE + CM) + ND CM
. (74)
The memory requirements of the DPS subspace repre-
sentation are determined by the size of the index set I, the
number of DPS vectors D
i
, and the resolution factors r
i
.If
the DPS sequences are stored with 16-bit precision,
Mem
h
=
N−1
i=0
2r
i
I
i
D
i
byte (75)
are needed.
4.5. Numerical examples
Section 3 demonstrated that an application of the approx-
imate DPS subspace representation to the time-domain of
wireless channels may save more than an order of magnitude
in complexity. In this subsection, the multidimensional ap-
proximate DPS subspace representation is applied to an ex-
ample of a time-variant frequency-selective channel as well
as an example of a time-variant frequency-selective MIMO
channel. A comparison of the arithmetic complexity is given.
We assume a 14-bit fixed-point hardware architecture, that
is, a maximum allowable square error of E
2
max
= (2
−13
)
2
≈
1.5 × 10
−8
.
12 EURASIP Journal on Advances in Signal Processing
Table 2: Simulation parameters for the numerical experiments in
the frequency domain.
Parameter Valu e
Width of frequency bin F
S
15 kHz
Number of frequency bins Q
256
Maximum delay τ
max
3.7 μs
Maximum norm. delay θ
max
≈ 1/18
4.5.1. Time and frequency domain
Table 2 contains the simulation parameters of the numerical
experiments in the frequency domain. The parameters in the
time domain are chosen according to Table 1.Weassumea
typical urban environment w ith a maximum delay spread of
τ
max
= 3.7 milliseconds given by the ITU Pedestrian B chan-
nel model [27].
By omitting the spatial domains x and y in (47), we ob-
tain a time-variant frequency-selective GCM
h
m
=
P−1
p=0
η
p
e
j2πf
p
,m
, (76)
where m
= [m, q]
T
and f
p
= [ν
p
, θ
p
]
T
. Since (76) is band-
limited to
W
=
−ν
Dmax
, ν
Dmax
×
0, θ
max
(77)
and we wish to calculate (76) in the index set
I
={0, , M − 1}×
−
Q
2
, ,
Q
2
−
1
, (78)
we can apply a two-dimensional DPS subspace representa-
tion (Definition 6)to(76). Further, we can use Theorem 3 to
calculate the basis coefficients α of the subspace representa-
tion.
For a given maximum allowable square bias E
2
max
=
(2
−13
)
2
, the estimated values of the resolution factors in the
time and frequency domain are r
0
= 2ν
Dmax
/E
max
≈ 2and
r
1
= θ
max
/E
max
≈ 512 (rounded to the next power of two).
The square bias
bias
2
h
D
= E
1
MQ
h
D
− h
D
2
(79)
of the two-dimensional exact and the approximate DPS sub-
space representation is plotted in Figure 10 against the sub-
space dimension D. It can be seen that bias
2
h
D
≈ E
2
max
at a
subspace dimension of approximately D
= 80. The maxi-
mum number of one-dimensional DPS vectors is D
0
= 4and
D
1
= 23.
4.5.2. Time, frequency, and spatial domain
Table 3 contains the simulation parameters of the numerical
experiments in the spatial domain. The remaining parame-
ters are chosen according to Tables 1 and 2.Weassumeuni-
form linear arrays at the transmitter and the receiver with
10
0
10
−2
10
−4
10
−6
10
−8
10
−10
Bias
2
0 20 40 60 80 100
D
Numerical accuracy@14 bit
Bias apx
Bias
Figure 10: bias
2
h
D
for the subspace representation in the time and
frequency domain with ν
Dmax
= 4.82 × 10
−5
, M = 2560, θ
max
=
0.056, and Q = 256. The resolution factors are fixed to r
0
= 2and
r
1
= 512. The thin horizontal line denotes the numeri cal accuracy
of a fixed-point 14-bit processor.
Table 3: Simulation parameters for the numerical experiments in
the spatial domains.
Parameter Valu e
Spacing between antennas D
S
λ/2m
Number of Tx antennas N
Tx
8
Number of Rx antennas N
Rx
8
AoD interval [ϕ
min
, ϕ
max
] [−5
◦
,5
◦
]
AoA interval [ψ
min
, ψ
max
] [−5
◦
,5
◦
]
Normalized AoD bandwidth ζ
max
− ζ
min
0.087
Normalized AoA bandwidth ξ
max
− ξ
min
0.087
spacing D
S
= λ/2andN
Tx
= N
Rx
= 8 antennas each. Fur-
ther we assume that there is only one cluster of scatterers in
the scenario which is not in the vicinity of the transmitter
or receiver (see Figure 11) and we assume no line-of-sight
component. The AoD and AoA are assumed to be limited by
[ϕ
min
, ϕ
max
] = [ψ
min
, ψ
max
] = [−5
◦
,5
◦
], which has been ob-
served in measurements [32].
A four-dimensional DPS subspace representation is ap-
plied to the channel transfer function (47)withW and I de-
fined in (51)and(60). Following the same procedure as in
the previous subsection, for a numerical accuracy of 14 bits
the estimated values of the resolution factors and the num-
ber of one-dimensional DPS vectors in the spatial domains
are r
2
= (ζ
max
− ζ
min
)/E
max
≈ 512, r
3
= (ξ
max
− ξ
min
)/E
max
≈
512 (rounded to the next power of 2), and D
2
= D
3
= 5.
4.5.3. Hybrid DPS subspace representation
Last but not least, we propose a hybrid DPS subspace repre-
sentation that applies a DPS subspace representation in time
Florian Kaltenberger et al. 13
Tx
Rx
Φ
Ψ
Figure 11: Scenario of a mobile radio channel with one cluster of
scatterers. The AoD and the AoA are limited within the intervals
Φ
= [ϕ
min
, ϕ
max
]andΨ = [ψ
min
, ψ
max
], respectively.
and frequency domains, and computes the complex expo-
nentials in the spatial domain directly. Therefore, the four-
dimensional channel transfer function h
m
(47) is split into
N
Tx
N
Rx
two-dimensional transfer functions h
s,r
m
describing
the transfer function between transmit antenna s and receiver
antenna r;
h
s,r
m
:= h
m
,s,r
=
P−1
p=0
η
p
e
− j2πζ
p
s
e
j2πξ
p
r
η
k,l
p
e
j2πf
p
,m
for m
∈ I
, f
p
∈ W
,
(80)
where the band-limit region W
and the index set I
are
the same as in the two-dimensional case (cf. (77)and(78)).
Then, the two-dimensional DPS subspace representation can
be applied to each h
s,r
m
, s = 0, , N
Tx
− 1, r = 0, , N
Rx
− 1,
independently.
4.5.4. Results and discussion
A complexity comparison of the SoCE algorithm and the ap-
proximate DPS subspace representation for one, two, and
four dimensions is given in Figure 12. It was evaluated us-
ing (70)and(73). Also shown is the complexity of the
four-dimensional hybrid DPS subspace representation. It can
be seen that for time-variant frequency-flat SISO channels,
the one-dimensional DPS subspace representation requires
fewer arithmetic operations for P>2 MPCs. The more
MPCs are used in the GCM, the more complexity is saved.
Asymptotically, the number of arithmetic operations is re-
duced by C
h
/C
h
→ 465.
For time-variant frequency-selective SISO channels,
the two-dimensional DPS subspace representation requires
fewer arithmetic operations for P>30 MPCs. However, as
noted in Section 4.1, channel models for systems with the
given parameters require P
= 400 paths or more. For such
a scenario, the DPS subspace representation saves two orders
of magnitude in complexity. Asymptotically, the number of
arithmetic operations is reduced by a factor of C
h
/C
h
→
6.8 × 10
3
(cf. (74)). The memory requirements are Mem
h
=
5.83 Mbyte (cf. (75)).
For time-variant frequency-selective MIMO channels,
the four-dimensional DPS subspace representation requires
fewer arithmetic operations for P>2
× 10
3
MPCs. Since
MIMO channels require the simulation of up to 10
4
MPCs
10
14
10
12
10
10
10
8
10
6
10
4
No. operations
10
0
10
1
10
2
10
3
10
4
P
DPSS time
SoCE time
DPSS time + freq.
SoCE time + freq.
DPSS time + freq. + space
SoCEtime+freq.+space
Hybrid
Figure 12: Complexity in terms of number of arithmetic opera-
tionsversusthenumberofMPCsP. We show results for the SoCE
algorithm (denoted by “SoCE”) and the approximate DPS subspace
representation (denoted by “DPSS”) for one, two, and four dimen-
sions. Also shown is the complexity of the four-dimensional hybrid
DPS subspace representation (denoted by “Hybrid”).
(cf. Section 4.1), complexity savings are still possible. The
asymptotic complexity savings are C
h
/C
h
→ 1.9 × 10
4
.How-
ever, in the region P<2
× 10
3
MPCs, the four-dimensional
DPS subspace representation requires more complex oper-
ations than the corresponding SoCE algorithm. Thus, even
though we choose a “best case” scenario with only one clus-
ter, a small angular spread and a low numerical accuracy,
there is hardly any additional complexity reduction if the
DPS subspace representation is applied in the spatial domain.
The hybrid DPS subspace representation on the other
hand exploits the savings of the DPS subspace representa-
tion in the time and frequency domain only. From Figure 12
it can be seen that it has fewer ar ithmetic operations than the
four-dimensional DPS subspace representation and the four-
dimensional SoCE algorithm for 60 <P<2
× 10
3
MPCs.
Thus the hybrid method is preferable for channel simulations
in this region. Further, this method also allows for an efficient
parallelization on hardware channel simulators [33].
5. CONCLUSIONS
We have presented a low-complexity algorithm for the com-
puter simulation of geometry-based MIMO channel mod-
els. The algorithm exploits the low-dimensional subspace
spanned by multidimensional DPS sequences. By adjusting
the dimension of the subspace, it is possible to trade compu-
tational complexity for accuracy. Thus the algorithm is ide-
ally suited for fixed-point hardware architectures with lim-
ited precision.
14 EURASIP Journal on Advances in Signal Processing
We demonstrated that the complexity reduction depends
mainly on the normalized bandwidth of the underlying fad-
ing process in time, frequency, and space. If the bandwidth
is very small compared to the sampling rate, the essential
subspace dimension of the process is small and the com-
plexity can be reduced substantially. In the time domain, the
maximum Doppler bandwidth of the fading process is much
smaller than the system sampling rate. Compared with the
SoCE algorithm, our new algorithm reduces the complexity
by more than one order of magnitude on 14-bit hardware.
The bandwidth of a frequency-selective fading process
is given by the maximum delay in the channel, which is a
factor of five to ten smaller than the sampling rate in fre-
quency. Therefore, the DPS subspace representation also re-
duces the computational complexity when applied in the fre-
quency domain. To achieve a satisfactory numerical accuracy,
the resolution factor in the approximation of the basis coef-
ficients needs to be large, resulting in high memory require-
ments. On the other hand, it was shown that the number of
memory access operations is small. Since this figure has more
influence on the run-time of the algorithm, the approximate
DPS subspace representation is preferable over the SoCE al-
gorithm for a frequency-selective fading-process.
The bandwidth of the fading process in the spatial do-
main is determined by the angular spread of the channel,
which is almost as large as the spatial sampling rate for most
scenarios in wireless communications. Therefore, applying
the DPS subspace representation in the spatial domain does
not a chieve any additional complexity reduction for the sce-
narios of interest. As a consequence, for the purpose of wide-
band MIMO channel simulation, we propose to use a hybrid
method which computes the complex exponentials in the
spatial domain directly and applies the subspace represen-
tation to the time and frequency domain only. This method
also allows for an efficient parallelization on hardware chan-
nel simulators.
APPENDICES
A. CALCULATION OF MULTIDIMENSIONAL
DPS SEQUENCES
In the one-dimensional case (N
= 1), where W = [W
0
−
W
max
, W
0
+ W
max
]andI ={M
0
, , M
0
+ M − 1}, the DPS
sequences can be calculated efficiently [17, 20]. The efficient
and numerically stable calculation of multidimensional DPS
sequences with arbitrary W and I is not triv ial and has not
been treated satisfactorily in the literature. In this section a
new way of calculating multidimensional DPS sequences is
derived if their passband region can be written as a Cartesian
product of one-dimensional intervals.
Indexing every element m
∈ I lexicographically, such
that I
={m
l
, l = 0, 1, , L − 1}, we define the matrix K
(W)
by
K
(W)
k,l
= K
(W)
m
k
− m
l
, k, l = 0, , L − 1, (A.1)
where the kernel K
(W)
is given by (55). Let v
(d)
(W, I)and
λ
d
(W, I), d = 0, , L− 1, denote the eigenvectors and eigen-
values of K
(W)
:
K
(W)
v
(d)
(W, I) = λ
d
(W, I)v
(d)
(W, I), (A.2)
where
λ
0
(W, I) ≥ λ
1
(W, I) ≥ ···≥ λ
L−1
(W, I). (A.3)
It can be shown that the eigenvectors v
(d)
(W, I) and the
eigenvalues λ
d
(W, I) are exactly the multidimensional DPS
vectors defined in (57) and their corresponding eigenvalues.
If the DPS sequences are required for m /
∈ I, they can be
extended using (54).
The multidimensional DPS vectors can theoretically be
calculated for an arbitr ary passband region W directly from
the eigenproblem (A.2). However, since the matrix K
(W)
has an exponentially decaying eigenvalue distribution, this
method is numerically unstable.
If W can be written as a Cartesian product of one-
dimensional intervals (i.e., W is a hyper-cube),
W
= W
0
×···×W
N−1
,(A.4)
where W
i
= [W
0,i
− W
max,i
, W
0,i
+ W
max,i
], and the index-set
I is written as
I
= I
0
×···×I
N−1
,(A.5)
where I
i
={M
0,i
, , M
0,i
+ M
i
− 1}, the defining kernel K
(W)
for the multidimensional DPS vectors evaluates to
K
(W)
(u) =
W
0,i
+W
max,i
W
0,i
−W
max,i
···
W
0,N−1
+W
max,N−1
W
0,N−1
−W
max,N−1
e
2πjf
0
u
0
···e
2πjf
N−1
u
N−1
df
0
···df
N−1
=
N−1
i=0
K
(W
i
)
u
i
,
(A.6)
where u
= [u
0
, , u
N−1
]
T
∈ I. This means that the kernel
K
(W)
is separable and thus the matrix K
(W)
can be written as
aKroneckerproduct
K
(W)
= K
(W
0
)
⊗···⊗K
(W
N−1
)
,(A.7)
where K
(W
i
)
, i = 0, , N − 1, are the kernel matrices cor-
responding to the one-dimensional DPS vectors. Now let
λ
d
i
(W
i
, I
i
)andv
(d
i
)
(W
i
, I
i
), d
i
= 0, , M
i
− 1, denote the
eigenvalues and the eigenvectors of K
(W
i
)
, i = 0, , N − 1,
respectively. Then the eigenvalues of K
(W)
are given by [34,
Chapter 9]
λ
d
(W, I) = λ
d
0
W
0
, I
0
···λ
d
N−1
W
N−1
, I
N−1
,
d
i
= 0, , M
i
− 1, i = 0, , N − 1
(A.8)
Florian Kaltenberger et al. 15
and the corresponding eigenvectors are given by
v
(d)
(W, I) = v
(d
0
)
W
0
, I
0
⊗···⊗
v
(d
N−1
)
W
N−1
, I
N−1
,
d
i
= 0, , M
i
− 1, i = 0, , N − 1.
(A.9)
The eigenvalues λ
d
(W, I) and the eigenvectors v
(d)
(W, I)
are index by d
= [d
0
, , d
N−1
]
T
∈ I. The multidimen-
sional DPS vectors v
(d)
(W, I) are obtained by reordering the
eigenvectors v
(d)
(W, I)andeigenvaluesλ
d
(W, I) according
to (A.3). Therefore, we define the mapping d
= σ(d), such
that λ
d
(W, I) = λ
σ(d)
(W, I) is the dth largest eigenvalue. Fur-
ther define the inverse mapping d
= δ(d) = σ
−1
(d), such
that for a given order d of the multidimensional DPS vec-
tor v
(d)
(W, I), the corresponding one-dimensional DPS vec-
tors can be found. When a certain multidimensional DPS
sequence of a given order d is needed, the eigenvalues λ
d
,
d
= 0, , L − 1, have to be calculated and sorted first.
Then the one-dimensional DPS sequences corresponding to
d
= δ(d) can be selected.
B. PROOF OF THEOREM 3
For I given by (65), h can be written as
h
=
P−1
p=0
η
p
e
(0)
p
⊗···⊗e
(N−1)
p
,(B.1)
where e
(i)
p
= [e
2πjf
p,i
M
0,i
, , e
2πjf
p,i
(M
0,i
+M
i
−1)
]
T
. Further, since
W is given by (64), the results of Appendix A canbeusedand
V can be written as
V
= V
0
···V
N−1
,(B.2)
where every M
i
× D
i
matrix V
i
contains the one-dimensional
DPS vectors v
d
(W
i
, I
i
) in its columns.
Using the identity
A
0
···A
N−1
b
0
⊗···⊗b
N−1
=
A
0
b
0
⊗···⊗A
N−1
b
N−1
,
(B.3)
the basis coefficients α can be calculated by
α
= V
H
h =
P−1
p=0
η
p
V
H
0
···V
H
N
−1
e
(0)
p
⊗···⊗e
(N−1)
p
=
P−1
p=0
η
p
V
H
0
e
(0)
p
=:γ
(0)
p
⊗···⊗V
H
N
−1
e
(N−1)
p
=:γ
(N−1)
p
.
(B.4)
C. LIST OF SYMBOLS
t, f , x, y:
Time, frequency, antenna location
at transmitter, and antenna location
at receiver
h(t, f , x, y): Channel transfer func tion
T
S
, F
S
, D
S
:
Duration of a sample, width of a
frequency bin, and spacing
between antennas
m, q, s, r:
Discrete time index, frequency index,
antenna index at transmitter, antenna
index at receiver
h
m,q,r,s
: Sampled channel tr ansfer function
M, Q: Number of samples in
time and frequency
N
Tx
, N
Rx
: Number of transmit antennas,
number of receive antennas
h: Vector of index-limited
transfer function
P:NumberofMPCs
η
p
: Complex path weight
ω
p
, ν
p
: Doppler shift and normalized Doppler
shift of the pth MPC
ω
Dmax
, ν
Dmax
: Maximum Doppler shift, maximum
normalized Doppler shift
τ
p
, θ
p
: Delay and normalized delay
of the pth MPC
τ
max
, θ
max
: Maximum delay, maximum
normalized delay
ϕ
p
, ζ
p
: AoD and normalized AoD of
the pth MPC
ϕ
max
, ϕ
min
: Maximum and minimum AoD
ζ
max
, ζ
min
: Maximum and minimum
normalized AoD
ψ
p
, ξ
p
: AoA and normalized AoA of
the pth MPC
ψ
max
, ψ
min
: Maximum and minimum AoD
ξ
max
, ξ
min
: Maximum and minimum
normalized AoD
f
C
, c: Carrier frequency, speed of light
v
max
: Maximum velocity of user
W: Band-limiting region
I: Index set
v
(d)
m
(W, I): dth one-dimensional DPS sequence
v
(d)
m
(W, I): dth multidimensional DPS sequence
v(d)(W, I): One-dimensional or
multidimensional DPS vector
λ
d
(W, I): Eigenvalue of dth DPS sequence
D, D
: Subspace dimension and essential
subspace dimension
U
d
(ν),
U
d
(ν): DPS wave function and approximate
DPSwavefunction
α
d
, α
d
:
dth basis coefficient and
approximate basis coefficient of DPS
subspace representation of h
16 EURASIP Journal on Advances in Signal Processing
γ
p,d
, γ
p,d
:
dth basis coefficient and approximate
basis coefficient of DPS subspace
representation of the pth MPC
r
i
, D
i
: Resolution factor and maximum
number of one-dimensional DPS
vectors in time (i
= 0), frequency
(i
= 1), space at the transmitter
(i
= 2), and space at the receiver
(i
= 3)
E
2
max
: Maximum squared
accuracy of hardware
bias
2
h
D
: Squared bias of the D-dimensional
subspace representation of h
C
h
D
:
Computational complexity of
the D-dimensional subspace
representation of h
ACKNOWLEDGMENTS
This work was funded by the Wiener Wissenschafts-,
Forschungs- und Technologiefonds (WWTF) in the ftw.
project I2 “Future Mobile Communications Systems.” The
authors would like to thank the anonymous reviewers for
their comments, which helped to improve the paper. Part
of this work has been presented at the 5th Vienna Sympo-
sium on Mathematical Modeling (MATHMOD 2006), Vi-
enna, Austria, February 2006, at the 15th IST Mobile and
Wireless Communications Summit, Mykonos, Greece, June
2006, and at the first European Conference on Antennas and
Propagation (EuCAP 2006), Nice, France, November 2006,
as an invited paper.
REFERENCES
[1] L. M. Correia, Ed., Mobile Broadband Multimedia Networks
Techniques, Models and Tools for 4G, Elsevier, New York, NY,
USA, 2006.
[2] F. Kaltenberger, G. Steinb
¨
ock, R. Kloibhofer, R. Lieger, and G.
Humer, “A multi-band development platform for rapid proto-
typing of MIMO systems,” in Proceedings of ITG Workshop on
Smart Antennas, pp. 1–8, Duisburg, Germany, April 2005.
[3] J. Kolu and T. Jamsa, “A real-time simulator for MIMO radio
channels,” in Proceedings of the 5th International Symposium on
Wireless Personal Multimedia Communications (WPMC ’02),
vol. 2, pp. 568–572, Honolulu, Hawaii, USA, October 2002.
[4] Azimuth Systems Inc., “ACE 400NB MIMO channel em-
ulator,” Product Brief, 2006, muthsystems
.com/files/public/PB
Ace400nb final.pdf.
[5] Spirent Communications Inc., “SR5500 wireless channel
emulator,” Data Sheet, 2006, />documents/4247.pdf.
[6]T.ZemenandC.F.Mecklenbr
¨
auker, “Time-variant channel
estimation using discrete prolate spheroidal sequences,” IEEE
Transactions on Signal Processing, vol. 53, no. 9, pp. 3597–3607,
2005.
[7] R. Clarke, “A statistical theory of mobile-radio reception,” The
Bell System Technical Journal, vol. 47, no. 6, pp. 957–1000,
1968.
[8] W. Jakes, Microwave Mobile Communications, John Wiley &
Sons, New York, NY, USA, 1974.
[9] M. P
¨
atzold and F. Laue, “Statistical properties of Jakes’ fading
channel simulator,” in Proceedings of the 48th IEEE Vehicular
Technology Conference (VTC ’98), vol. 2, pp. 712–718, Ottawa,
Canada, May 1998.
[10] M. F. Pop and N. C. Beaulieu, “Limitations of sum-of-
sinusoids fading channel simulators,” IEEE Transactions on
Communications, vol. 49, no. 4, pp. 699–708, 2001.
[11] P. Dent, G. E. Bottomley, and T. Croft, “Jakes fading model
revisited,” Electronics Letters, vol. 29, no. 13, pp. 1162–1163,
1993.
[12] Y. Li and X. Huang, “The simulation of independent Rayleigh
faders,” IEEE Transactions on Communications,vol.50,no.9,
pp. 1503–1514, 2002.
[13] Y. R. Zheng and C. Xiao, “Simulation models with correct sta-
tistical properties for Rayleigh fading channels,” IEEE Transac-
tions on Communications, vol. 51, no. 6, pp. 920–928, 2003.
[14] A. G. Zaji
´
c and G. L. St
¨
uber, “Efficient simulation of Rayleigh
fading with enhanced de-correlation properties,” IEEE Trans-
actions on Wireless Communications, vol. 5, no. 7, pp. 1866–
1875, 2006.
[15] T. Zemen, C. Mecklenbr
¨
auker, F. Kaltenberger, and B. H.
Fleury, “Minimum-energy band-limited predictor with dy-
namic subspace selection for time-variant flat-fading chan-
nels,” to appear in IEEE Transactions on Signal Processing.
[16] T. Zemen, “OFDM multi-user communication over time-
variant channels,” Ph.D. dissertation, Vienna University of
Technology, Vienna, Austria, July 2004.
[17] D. Slepian, “Prolate spheroidal wave functions, Fourier anal-
ysis, and uncertainty—V: the discrete case,” The Bell System
Technical Journal, vol. 57, no. 5, pp. 1371–1430, 1978.
[18] D. J. Thomson, “Spectrum estimation and harmonic analysis,”
Proceedings of the IEEE, vol. 70, no. 9, pp. 1055–1096, 1982.
[19] S. Dharanipragada and K. S. Arun, “Bandlimited extrapola-
tion using time-bandwidth dimension,” IEEE Transactions on
Signal Processing, vol. 45, no. 12, pp. 2951–2966, 1997.
[20] D. B. Percival and A. T. Walden, Spectral Analysis for Physi-
cal Applications, Cambridge University Press, Cambridge, UK,
1963.
[21] F. Kaltenberger, T. Zemen, and C. W. Ueberhuber, “Low com-
plexity simulation of wireless channels using discrete pro-
late spheroidal sequences,” in Proceedings of the 5th Vienna
International Conference on Mathematical Modelling (MATH-
MOD ’06), Vienna, Austria, February 2006.
[22] D. Slepian and H. O. Pollak, “Prolate spheroidal wave func-
tions, Fourier analysis and uncertainty—I,”
The Bell System
Technical Journal, vol. 40, no. 1, pp. 43–64, 1961.
[23] A. Papoulis, Probability, Random Variables and Stochastic Pro-
cesses, McGraw-Hill, New York, NY, USA, 3rd edition, 1991.
[24] H. Holma and A. Tskala, Eds., WCDMA for UMTS,JohnWiley
& Sons, New York, NY, USA, 2nd edition, 2002.
[25]M.Steinbauer,A.F.Molisch,andE.Bonek,“Thedouble-
directional radio channel,” IEEE Antennas and Propagation
Magazine, vol. 43, no. 4, pp. 51–63, 2001.
[26] P. Almers, E. Bonek, A. Burr, et al., “Survey of channel
and radio propagation models for wireless MIMO systems,”
EURASIP Journal on Wireless Communications and Network-
ing, vol. 2007, Article ID 19070, 19 pages, 2007.
[27] Members of 3GPP, “ Technical specification group radio access
network; User Equipment (UE) radio transmission and recep-
tion (FDD),” Tech. Rep. 3GPP TS 25.101 version 6.4.0, 3GPP,
Valbonne, France, March 2004.
Florian Kaltenberger et al. 17
[28] V. Erceg, L. Schumacher, P. Kyritsi, et al., “TGn channel mod-
els,” Tech. Rep. IEEE P802.11, Wireless LANs, Garden Grove,
Calif, USA, May 2004.
[29] V. Degli-Esposti, F. Fuschini, E. M. Vitucci, and G. Falciasecca,
“Measurement and modelling of scattering from buildings,”
IEEE Transactions on Antennas and Propagation,vol.55,no.1,
pp. 143–153, 2007.
[30] T. Pedersen and B. H. Fleury, “A realistic radio channel model
based on stochastic propagation graphs,” in Proceedings of the
5th Vienna International Conference on Mathematical Mod-
elling (MATHMOD ’06), Vienna, Austria, February 2006.
[31] O. Norklit and J. B. Andersen, “Diffuse channel model
and experimental results for array antennas in mobile envi-
ronments,” IEEE Transactions on Antennas and Propagation,
vol. 46, no. 6, pp. 834–840, 1998.
[32] N. Czink, E. Bonek, X. Yin, and B. Fleury, “Cluster angular
spreads in a MIMO indoor propagation environment,” in Pro-
ceedings of the 16th International Symposium on Personal, In-
door and Mobile Radio Communications (PIMRC ’05), vol. 1,
pp. 664–668, Berlin, Germany, September 2005.
[33] F. Kaltenberger, G. Steinb
¨
ock, G. Humer, and T. Zemen, “Low-
complexity geometr y based MIMO channel emulation,” in
Proceedings of European Conference on Antennas and Propaga-
tion (EuCAP ’06), Nice, France, November 2006.
[34] T. K. Moon and W. Stirling, Mathematical Methods and Algo-
rithms, Prentice-Hall, Upper Saddle River, NJ, USA, 2000.
Florian Kaltenberger was born in Vienna,
Austria, in 1978. He received his Diploma
(Dipl Ing. degree) and his Ph.D. degree
both in technical mathematics from the Vi-
enna University of Technology in 2002 and
2007, respectively. During the summer of
2001, he held an internship position with
British Telecom, BT Exact Technologies in
Ipswich, UK, where he was working on mo-
bile video conferencing applications. After
his studies, he started as a Research Assistant at the Vienna Univer-
sity of Technology, Institute for Advanced Scientific Computing,
working on distributed signal processing algorithms. In 2003, he
joined t he wireless communications group at the Austrian Research
Centers GmbH, where he is currently working on the development
of low-complexity smart antenna and MIMO algorithms as well as
on the ARC SmartSim real-time hardware channel simulator. His
research interests include signal processing for wireless communi-
cations, MIMO communication systems, receiver design and im-
plementation, MIMO channel modeling and simulation, and hard-
ware implementation issues.
Thomas Zemen was born in M
¨
odling, Aus-
tria, in 1970. He received the Dipl Ing. de-
gree (with distinction) in electrical engi-
neering from Vienna University of Technol-
ogy in 1998 and the Ph.D. degree (with dis-
tinction) in 2004. He joined Siemens Aus-
tria in 1998, where he worked as Hard-
ware Engineer and Project Manager for the
radio communication devices department.
He was engaged in the development of a ve-
hicular GSM telephone system for a German car manufacturer.
From October 2001 to September 2003, Mr. Zemen was delegated
by Siemens Austria as a Researcher to the mobile communications
group at the Telecommunications Research Center Vienna (ftw.).
Since October 2003, Thomas Zemen has been with the Telecom-
munications Research Center, Vienna, working as a Researcher
in the strategic I0 project. His research interests include orthog-
onal frequency division multiplexing (OFDM), multiuser detec-
tion, time-variant channel estimation, iterative MIMO receiver
structures, and distributed signal processing. Since May 2005,
Thomas Zemen leads the project “Future Mobile Communica-
tions Systems-Mathematical Modeling, Analysis, and Algorithms
for Multi Antenna Systems” which is funded by the Vienna Science
and Technology Fund (Wiener Wissenschafts-, Forschungs- und
Technologiefonds—WWTF). Dr. Zemen teaches “MIMO Commu-
nications” as external lecturer at Vienna University of Technology.
Christoph W. Ueberhuber received the
Dipl Ing. and Ph.D. degrees in technical
mathematics and the Venia Docendi Ha-
bilitation degree in numerical mathematics
from the Vienna University of Technology,
Vienna, Austria, in 1973, 1976, and 1979,
respectively. He has been with the Vienna
University of Technology since 1973 and is
currently a Professor of numerical math-
ematics. He has published 15 books and
more than 100 papers in journals, books, and conference pro-
ceedings. His research interests include numerical analysis, high-
performance numerical computing, and advanced scientific com-
puting.