Báo cáo hóa học: " Research Article On the Use of Complementary Spectral Features for Speaker Recognition" pot
Bạn đang xem bản rút gọn của tài liệu. Xem và tải ngay bản đầy đủ của tài liệu tại đây (767.39 KB, 10 trang )
Hindawi Publishing Corporation
EURASIP Journal on Advances in Signal Processing
Volume 2008, Article ID 258184, 10 pages
doi:10.1155/2008/258184
Research Article
On the Use of Complementary Spectral Features
for Speaker Recognition
Danoush Hosseinzadeh and Sridhar Krishnan
Department of Electrical and Computer Engineering, Ryerson University, 350 Victoria St reet, Toronto, ON, Canada M5B 2K3
Correspondence should be addressed to Sridhar Krishnan,
Received 29 November 2006; Revised 7 May 2007; Accepted 29 September 2007
Recommended by Tan Lee
The most popular features for speaker recognition are Mel frequency cepstral coefficients (MFCCs) and linear prediction cepstral
coefficients (LPCCs). These features are used extensively because they characterize the vocal tract configuration which is known
to be highly speaker-dependent. In this work, several features are introduced that can characterize the vocal system in order to
complement the traditional features and produce better speaker recognition models. The spectral centroid (SC), spectral band-
width (SBW), spectral band energy (SBE), spectral crest factor (SCF), spectral flatness measure (SFM), Shannon entropy (SE), and
Renyi entropy (RE) were utilized for this purpose. This work demonstrates that these features are robust in noisy conditions by
simulating some common distortions that are found in the speakers’ environment and a typical telephone channel. Babble noise,
additive white Gaussian noise (AWGN), and a bandpass channel with 1 dB of ripple were used to simulate these noisy conditions.
The results show significant improvements in classification performance for all noise conditions when these features were used to
complement the MFCC and ΔMFCC features. In particular, the SC and SCF improved performance in almost all noise conditions
within the examined SNR range (10–40 dB). For example, in cases where there was only one source of distortion, classification
improvements of up to 8% and 10% were achieved under babble noise and AWGN, respectively, using the SCF feature.
Copyright © 2008 D. Hosseinzadeh and S. Krishnan. This is an open access article distributed under the Creative Commons
Attribution License, which permits unrestricted use, distribution, and reproduction in any medium, provided the original work is
properly cited.
1. INTRODUCTION
Speaker recognition has many potential applications as a bio-
metric tool since there are many tasks that can be performed
remotely using speech. Especially for telephone-based appli-
cations (i.e., banking or customer service), there are many
costly crimes such as identity theft or fraud that can be pre-
vented by enhanced security protocols. In these applications,
the identity of users cannot be verified because there is no
direct contact between the user and the service provider.
Hence, speaker recognition is a viable and practical next step
for enhanced security.
Speaker recognition is performed by extracting some
speaker-dependent characteristics from speech signals. For
this purpose, the speaker’s vocal tract configuration has been
recognized to be extremely speaker-dependent because of
the anatomical and behavioral differences between subjects.
Over the years, many techniques have been proposed for
characterizing the vocal tract configuration from speech sig-
nals; a good review of these techniques is provided in [1].
In general, however, the Mel frequency cepstral coefficients
(MFCCs) and linear prediction cepstral coefficients (LPCCs)
have been the two most popular features used in previ-
ous works [2–5]. These features can characterize the highly
speaker-dependent vocal tract transfer function from the
convoluted speech signal (s(t)) by assuming a linear model
of speech production as
s(t)
= x(t)∗h(t), (1)
where x(t) is a periodic excitation (for voiced speech) or
white noise (for unvoiced speech) and h(t) is a time-varying
filter which constantly changes to produce different sounds.
Although h(t) is time-varying, it can be considered stable
over short-time intervals of approximately 10–30 millisec-
onds [1]. This convenient short-time stationary behavior is
exploited by many speaker recognition systems in order to
characterize the vocal tract transfer function given by h(t),
which is known to be a unique speaker-dependent charac-
teristic for a given sound. While assuming a linear model,
2 EURASIP Journal on Advances in Signal Processing
this information can be easily extracted from speech signals
using well-established deconvolution techniques such as ho-
momorphic filtering or linear prediction methods.
Recent works have demonstrated that the linear model
assumed in MFCC and LPCC is not entirely correct because
there is some nonlinear coupling between the vocal source
and the vocal tract [6, 7]. Therefore, when assuming a linear
speech production model, the vocal tract and vocal source in-
formation is not completely separable. For example, MFCCs
are calculated from the power spectrum of the speech sig-
nal and hence they is affected by the harmonic structure and
the fundamental frequency of speech [8]. Similarly, the lin-
ear prediction (LP) residual is known to be an approxima-
tion of the vocal source signal [9], which implies that the
LPCCs are influenced by the vocal source to some extent.
NIST evaluations have also shown that the performance of
speaker recognition systems is affected by changes in pitch
[10], which indicates that vocal source information can be
useful for speaker recognition.
These concerns motivated the use of features that can
complement the traditional vocal tract features for a bet-
ter characterization of the vocal system. This has been at-
tempted before and it has been shown that the vocal source,
for example, contains some speaker-dependent information.
Plumpe et al. [7] combined MFCCs with features obtained
by estimating glottal flow and obtained a 5% improvement
in classification performance. Chan et al. [11] have shown
that vocal source features derived from the LP residual can
be more discriminative than MFCC features for short speech
segments. Zheng and Ching [9]havereportedimprovedper-
formance by combining vocal source features derived from
the LP residual with LPCC features.
This work attempts to extract several features from the
speech spectrum that can complement the traditional vocal
tract features. These features are the spectral centroid (SC),
spectral bandwidth (SBW), spectral band energy (SBE),
spectral crest factor (SCF), spectral flatness measure (SFM),
Shannon entropy (SE), and Renyi entropy (RE). We have
shown that these novel features can be used for speaker
recognition in undistorted conditions [12]. This work ex-
amines the performance characteristics of these spectral fea-
tures under noisy conditions. By combining several com-
mon distortions such as babble noise, additive white Gaus-
sian noise (AWGN), and a nonlinear bandpass channel to
simulate the telephone pathway, these features can be tested
under more realistic conditions. In fact, these distortions
can simulate the speakers’ environment as well as a prac-
tical telephone channel. The proposed testing method will
combine these spectral features with the traditional MFCC-
based features in order to develop more robust speaker mod-
els for noisy conditions. To evaluate the performance of
the feature set, a text-independent cohort Gaussian mixture
model (GMM) classifier will be used since it has been exten-
sively used in previous speaker recognition works, and there-
fore its characteristics and performance capabilities are well
known.
The paper is organized as follows. Section 2 describes in
detail the proposed features and Section 3 describes the clas-
sification scheme used. Section 4 presents the experimental
conditions, results, and discussions, and lastly Section 5 con-
cludes the paper.
2. SPECTRAL FEATURES
The information embedded in the speech spectrum contains
speaker-dependent information such as pitch frequency, har-
monic structure, spectral energy distribution, and aspiration
[7, 13, 14]. Therefore, this section proposes several spec-
tral features that can quantify some of these characteristics
from the convoluted speech signal. These features are ex-
pected to provide additional speaker-dependent information
which can complement the vocal tract information for better
speaker models.
Similar to MFCCs, spectral features should be calculated
from short-time frames so that they can add information to
the vocal tract features. Frame synchronization is expected to
be important for achieving enhanced performance with the
spectral features. In addition, for a given frame, the spectral
features should be extracted from multiple subbands in order
to better discriminate between speakers. Capturing the spec-
tral trend, via subbands, for a given frame will provide more
information than obtaining one global value from the speech
spectrum. The latter option is not likely to show significant
speaker-dependent characteristics.
Spectral features are extracted from framed speech seg-
mentsasfollows.Lets
i
[n], for n ∈ [0, N], represent the ith
speech frame and let S
i
[ f ] represent the spectrum of this
frame. Then, S
i
[ f ] can be divided into M nonoverlapping
subbands, where each subband (b) is defined by a lower fre-
quency edge (l
b
)andanupperfrequencyedge(u
b
). Now,
each of the seven proposed spectral features can be calculated
from S
i
[ f ] as shown below.
(1) Spectral centroid (SC) as given below is the weighted
average frequency for a given subband, where the
weights are the normalized energy of each frequency
component in that subband. Since this measure cap-
tures the center of gravity of each subband, it can de-
tect the approximate location of formants which are
large peaks in a subband [15]. However, the center
ofgravityofasubbandiseffected by the harmonic
structure and pitch frequencies produced by the vocal
source. Hence, the SC feature is effected by changes in
pitch and harmonic structure:
SC
i,b
=
u
b
f =l
b
f
S
i
[ f ]
2
u
b
f =l
b
S
i
[ f ]
2
. (2)
(2) Spectral bandwidth (SBW) as given below is the
weighted average distance from each frequency com-
ponent in a subband to the spectral centroid of that
subband. Here, the weights are the normalized energy
of each frequency component in that subband. This
measure quantifies the relative spread of each subband
for a given sound. This measure is a good indication of
D. Hosseinzadeh and S. Krishnan 3
the range of frequencies that are produced by the vocal
system in a subband for a given sound:
SBW
i,b
=
u
b
f =l
b
f −SC
i,b
2
S
i
[ f ]
2
u
b
f =l
b
S
i
[ f ]
2
. (3)
(3) Spectral band energy (SBE) as given below is the energy
of each subband normalized with the combined energy
of the spectrum. The SBE gives the trend of energy dis-
tribution for a given sound, and therefore it describes
the dominant subband (or the frequency range) that is
emphasized by the speaker for a given sound. Since the
SBE is energy normalized, it is insensitive to the inten-
sity or loudness of the vocal source:
SBE
i,b
=
u
b
f =l
b
S
i
[ f ]
2
f
S
i
[ f ]
2
. (4)
(4) Spectral flatness measure (SFM) as given below is a
measure of the flatness of the spectrum, where white
noise has a perfectly flat spectrum. This measure
is useful for discriminating between voiced and un-
voiced components of speech [16]. This is also intu-
itive since structured speech (voiced components) will
have a narrower bandwidth than nonstructured speech
(unvoiced components) which can be modeled with
AWGN, and therefore it will have a larger bandwidth:
SFM
i,b
=
u
b
f =l
b
S
i
[ f ]
2
1/(u
b
−l
b
+1)
1/
u
b
−l
b
+1
u
b
f =l
b
S
i
[ f ]
2
. (5)
(5) Spectral crest factor (SCF)asgivenbelowprovidesa
measure for quantifying the tonality of the signal. This
measure is useful for discriminating between wide-
band and narrowband signals by indicating the nor-
malized strength of the dominant peak in each sub-
band. These peaks correspond to the dominant pitch
frequency harmonic in each subband:
SCF
i,b
=
max
S
i
[ f ]
2
1/
u
b
−l
b
+1
u
b
f =l
b
S
i
[ f ]
2
. (6)
(6) Renyi entropy (RE)asgivenbelowisaninformation
theoretic measure that quantifies the randomness of
the subband. Here, the normalized energy of the sub-
band can be treated as a probability distribution for
calculating entropy and α is set to 3, as commonly
found in literature [17, 18]. This RE trend is useful
for detecting the voiced and unvoiced components of
speech since it can detect the degree of randomness
in the signal (i.e., structured speech corresponds to
voiced speech and has a lower entropy compared to
nonstructured speech which corresponds to unvoiced
speechwithahigherentropyvalue):
RE
i,b
=
1
1 −α
log
2
u
b
f =l
b
S
i
[ f ]
u
b
f =l
b
S
i
[ f ]
α
. (7)
(7) Shannon entropy (SE) as given below is also an infor-
mation theoretic measure that quantifies the random-
ness of the subband. Here, the normalized energy of
the subband can be treated as a probability distribu-
tion for calculating entropy. Similar to the RE trend,
the SE trend is also useful for detecting the voiced and
unvoiced components of speech:
SE
i,b
=−
u
b
f =l
b
S
i
[ f ]
u
b
f =l
b
S
i
[ f ]
·
log
2
S
i
[ f ]
u
b
f =l
b
S
i
[ f ]
. (8)
Although these features are novel for speaker recognition,
they have been used in other fields such as multimedia fin-
gerprinting [19]. For speaker recognition, these features may
enhance recognition performance when used to complement
the vocal tract transfer function since the vocal tract transfer
function significantly alters the spectral shape of the speech
signal, and hence it is the dominant feature.
Among the spectral features, there may be some correla-
tion between the SC and the SCF features because they both
quantify information about the peaks (locations of energy
concentration) of each subband. The difference is that the
SCF feature describes the normalized strength of the largest
peak in each subband, while the SC feature describes the
center of gravity of each subband. Therefore, these features
will perform well if the largest peak in a given subband is
much larger than all other peaks in that subband. The RE and
SE features are also correlated since they are both entropy
measures. However, the RE feature is much more sensitive
to small changes in the spectrum because of the exponent
term α. Therefore, although these features quantify the same
type of information, their performance may be different for
speech signals.
2.1. Subband allocation
Features derived from the speech spectrum (i.e., Fourier do-
main) are more discriminative than those derived from sev-
eral distinct subbands. Due to the effects of averaging and
normalization, the proposed spectral features are not likely
to perform well if they are calculated from the entire spec-
trum. Furthermore, by adopting nonoverlapping subbands,
the spectral trend can be obtained for each of the proposed
features.
In order to calculate the subband boundaries, several fac-
tors were considered: incorporation of the human auditory
perception model (Mel scale), the frequency resolution of
the spectrum, and the bandwidth of typical telephone chan-
nel. In order to let the experiments simulate practical condi-
tions, all of the features are extracted from a typical telephone
channel bandwidth (300 Hz–3.4 kHz). With this considera-
tion in mind, the 5 subbands were defined according to the
Mel scale, which is consistent with the nonlinearities of hu-
man auditory perception. The boundaries for the 5 subbands
are shown in Ta ble 1.
The number of subbands was governed by the frequency
resolution of the spectrum. With a 30-millisecond speech
4 EURASIP Journal on Advances in Signal Processing
Table 1: The subband allocation used to obtain spectral features.
Subband Lower edge (Hz) Upper edge (Hz)
1 300 627
2 628 1060
3 1061 1633
4 1634 2393
5 2394 3400
frame, sampled at 8 kHz, a maximum frequency resolution of
approximately 33.3 Hz can be obtained. Therefore, the first
subband (i.e., the narrowest subband), which contributes
to the intelligibility and contains a significant percentage
of the speech signals’ energy, should contain sufficient fre-
quency samples for calculating the proposed features. There-
fore, the first subband was set to have 10 frequency sam-
ples starting at 300 Hz. This condition determines the band-
width of the first subband. The remainder of the bound-
aries were linearly allocated on the Mel scale with equal
bandwidth as the first subband, as shown in Tab le 1 . Using
the proposed subband allocation, each spectral feature will
generate a 5-dimensional feature vector from each speech
frame.
3. PROPOSED METHOD
To compare the effectiveness of the proposed spectral fea-
tures with the that of commonly used MFCC-based features,
a cohort GMM identification scheme will be used. The pro-
posed method is a speaker identification system since it uses
the log-likelihood function to find the best speaker model for
agivenutterance.
GMMs are the most popular statistical tool for speaker
recognition because of their ability to accurately capture
speech phenomena [2, 13, 21]. In fact, some GMM clus-
ters have been found to be highly correlated with particular
phonemes [22]. And the overall GMM can capture a broad
range of phonetic events or acoustic classes within a speaker’s
utterances [2] when used with MFCC features. These are
very useful characteristics that can lead to very good speaker
recognition models if a comprehensive training set is used. A
good training set would include multiple instances of a wide
range of phonemes and phoneme combinations.
Since GMMs characterize acoustic classes of speech and
not specific words or phrases, they can be effectively used for
text-independent identification. Text-independent systems
are much more secure than text-dependent systems because
text-independent systems can prompt the user to say any
phrase during identification. Conversely, a major drawback
of text-dependent speaker recognition systems is that they
use predetermined phrases for authentication; so it is possi-
ble to use a recorded utterance of a valid user to “fool” the
system. This issue is particularly important for telephone-
based applications since there is no physical contact with
the person requesting access, and therefore text-independent
systems are required.
3.1. Training and GMM estimation
The expectation maximization (EM) algorithm [23]was
used to estimate the parameters of the GMM. Although the
EM algorithm is an unsupervised clustering algorithm, it
cannot estimate the model order and it also requires an ini-
tial estimate for each cluster. In previous speaker recognition
works, models of orders 8–32 have been commonly used for
cohort GMM systems. In many cases, good results have been
obtained with as few as 16 clusters [2, 8, 24]. In these exper-
iments, however, a higher model order can be used because
of the larger feature set. Preliminary experimental results in-
dicated that a model order of 24 was the optimal order for
the proposed feature set given models of orders 16, 20, 24,
28, and 32. It has also been shown that the initial grouping of
data does not significantly affect the performance of GMM-
based recognition systems [2]. Hence, the k-means algorithm
was used for the initial parameter estimates.
A diagonal covariance matrix was used to estimate the
variances of each cluster in the models since they are much
more computationally efficient than full covariance matrices.
In fact, diagonal covariance matrices can provide the same
level of performance as full covariance matrices because they
can capture the correlation between the features if a larger
model order is used [2, 21]. For these reasons, diagonal co-
variance matrices have almost been exclusively used in pre-
vious speaker recognition works. Each element of these ma-
trices is limited to a minimum value of 0.01 during the EM
estimation process to prevent singularities in the matrix, as
recommended by [2].
3.2. Feature set
The spectral features along with the MFCC and ΔMFCC fea-
tures will be extracted from each speech frame and appended
together to form a combined feature vector for each speech
frame. Equation (9) shows the feature matrix that can be ex-
tracted based on only one spectral feature, say, the SC fea-
ture, from i frames, where the bracketed number is the length
of the feature. It should be noted that any other spectral
feature can be substituted for the SC feature in the feature
matrix. Furthermore, all features will be extracted from the
bandwidth of a typical telephone channel, which is 300 HZ–
3.4 kHz [2]:
F
=
⎡
⎢
⎢
⎣
MFCC
1
(14) ΔMFCC
1
(14) SC
1
(5)
.
.
.
.
.
.
.
.
.
MFCC
i
(14) ΔMFCC
i
(14) SC
i
(5)
⎤
⎥
⎥
⎦
. (9)
MFCC coefficients are calculated from the speech signal
after it has been transmitted through a channel. It has been
shown that linear time-invariant channels, such as telephone
channels, result in additive distortion on the output cepstral
coefficients. To reduce this additive distortion, cepstral mean
normalization (CMN) was used [1, 24]. CMN also mini-
mizes intraspeaker biases introduced over different sessions
from the intensity (i.e., loudness) of speech [2].
Cepstral difference coefficients such as ΔMFCC are less
affected by time-invariant channel distortions because they
D. Hosseinzadeh and S. Krishnan 5
rely on the difference between samples and not on the ab-
solute value of the samples [2]. Furthermore, the ΔMFCC
feature has been shown to improve the performance of the
MFCC feature in speaker recognition. As a result, the MFCC
and ΔMFCC features have been extensively used in previous
works with good results. Here, these two features will be used
to train the baseline system which is then used to judge the
effectiveness of the proposed spectral features.
4. EXPERIMENTAL RESULTS
This section will present the experimental conditions as well
as the results. Section 4.1 explains the details of the experi-
mental procedures and the data collection procedures, while
Section 4.2 provides a detailed discussion about the results.
4.1. Experimental conditions
All speech samples used in these experiments were obtained
from the well-known TIMIT speech corpus [25]. 623 speak-
ers (438 males and 192 females) from the corpus were used,
which include speakers from 8 different dialect regions in the
United States. Each user provided 10 recordings with a wide
range of phonetic sounds suitable for training the classifier.
However, the recordings are made in an acoustically quiet
environment using a high-quality microphone, and there-
fore some distortions were added to simulate a practical tele-
phone channel. These distortions included bandpass filter-
ing (300 Hz–3.4kHz) to simulate the characteristics of a tele-
phone channel, babble noise to simulate background speak-
ers that might be found in some environments, and AWGN
to simulate normal background noise found in many envi-
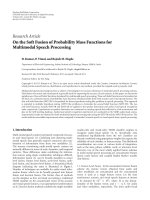
ronments. The simulation model is shown in Figure 1.
Each GMM was trained with 20 seconds of silence-
removed clean speech. The remaining speech was segmented
into 7 s utterances and used to test the speaker models un-
der noisy and noise-free conditions. A total of 298 test sam-
ples was available since some of the speakers only had enough
data for training. The sampling frequency of the recordings
was reduced from 16 kHz to 8 kHz which is the standard for
telephone applications. Features were then extracted from
30-millisecond long frames with 15 milliseconds of overlap
with the previous frames, and a Hamming window was ap-
plied to each frame to ensure a smooth frequency transition
between frames. From each frame, the feature matrix (
F )
extracted was a concatenation of a 14-dimensional MFCC
vector, 14-dimensional ΔMFCC, and 5-dimensional spectral
feature vector as shown in (9). In cases where multiple spec-
tral features are used, all features are appended together to
form the feature matrix as shown in the example below:
F
=
⎡
⎢
⎢
⎣
MFCC
1
(14) ΔMFCC
1
(14) SC
1
(5) SCF
1
(5) SBE
1
(5)
.
.
.
.
.
.
.
.
.
.
.
.
.
.
.
MFCC
i
(14) ΔMFCC
i
(14) SC
i
(5) SCF
i
(5) SBE
i
(5)
⎤
⎥
⎥
⎦
,
(10)
where i represents the frame number and the bracketed num-
ber represents the length of the feature. The MFCC features
Table 2: Experimental results using 7 s test utterances (298 tests).
Feature Accuracy (%)
MFCC & ΔMFCC (baseline system) 95.30
MFCC & ΔMFCC & SC 97.32
MFCC & ΔMFCC & SBE 97.32
MFCC & ΔMFCC & SBW 96.98
MFCC & ΔMFCC & SCF 96.31
MFCC & ΔMFCC & SFM 81.55
MFCC & ΔMFCC & SE 90.27
MFCC & ΔMFCC & RE 98.32
MFCC & ΔMFCC & SBE & SC 96.98
MFCC & ΔMFCC & SBE & RE 96.98
MFCC & ΔMFCC & SC & RE 99.33
were processed with the CMN technique to remove the ef-
fects of additive distortion caused by the bandpass channel
(i.e., the telephone channel).
4.2. Results and discussions
MFCC-based features are well suited for characterizing the
vocal tract transfer function. Although this is the main rea-
son for their success, MFCCs do not provide a complete de-
scription of the speaker’s speech production system. By com-
plementing the MFCC features with additional information,
the proposed spectral features are expected to increase iden-
tification accuracy of MFCC-based systems. Furthermore,
these experiments aim to demonstrate the effectiveness of the
proposed features under noisy and noise-free conditions.
(1) Results with undistorted speech
Ta ble 2 demonstrates the identification accuracy of the sys-
tem when using spectral features in addition to MFCC-based
features with undistorted speech sampled at 8 kHz. The re-
ported accuracy represents the percentage of tests that were
correctly identified by the system, as shown below:
Accuracy (%)
=
Utterances Correctly Identified
Total Number of Utterances
×100.
(11)
It is evident from these results that there is some speaker-
dependent information captured by the SC, SBE, SBW,
SCF, SBE, and RE features as they improved identification
rates when combined with the standard MFCC-based fea-
tures. In fact, when two of the best performing spectral fea-
tures (SC and RE) were simultaneously combined with the
MFCC-based features, an identification error of 99.33% was
achieved, which represents a 4.03% improvement over the
baseline system. These results suggest that the spectral fea-
tures provide enough speaker-dependent information about
the speaker’s vocal system to enhance the performance of the
baseline system which is based on the MFCC and ΔMFCC
features.
6 EURASIP Journal on Advances in Signal Processing
Babble noise
+
AWG N
Non-linear
telephone channel
(300 Hz–3.4kHz)
Speaker
identification
Identification
decision
Figure 1: Simulation model.
The best performing features set was the combination of
the MFCC-based features and the RE feature. The RE fea-
ture is very effective at quantifying voiced speech which is
quasi-periodic (relatively low entropy) and unvoiced speech
which is often represented by AWGN (relatively high en-
tropy). However, we suspect that the RE feature may also be
characterizing another phenomenon other than voiced and
unvoiced speeches. This is likely since the SE feature did not
show any performance benefits, and it is too an entropy mea-
sure capable of discriminating between voiced and unvoiced
speeches. One possibility is that the exponential term α in the
RE definition is contributing to this performance improve-
ment. Since the spectrum is normalized in the range of [0, 1]
before calculating these features, the exponent term α has the
effect of significantly reducing the contributions of the low-
energy components relative to the high-energy components.
Therefore, the RE feature is likely to produce a more reli-
able measure since it heavily relies on the high-energy com-
ponents of each subband. However, we show later that this
improvement is not sustainable under noisy conditions.
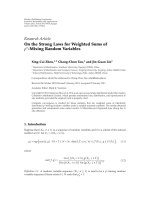
Figure 2(a) shows that the SC feature can capture the cen-
ter of gravity of each subband. Since the subband’s center of
gravity is related to the spectral shape of the speech signal, it
implies that the SC feature can also detect changes in pitch
and harmonic structure since they fundamentally affect the
spectrum. Pitch and harmonic structure are well known to
be speaker-dependent and complementary to the vocal tract
transfer function for speaker recognition. In addition, the SC
feature can also locate the approximate location of the dom-
inant formant in each of the subbands since formants will
tend towards the subband’s center of gravity in some cases.
These properties of the SC feature provide complementary
information and lead to the improved performance of the
MFCC-based classifier.
The SCF feature shown in Figure 2(b) quantifies the nor-
malized strength of the dominant peak in each subband.
The fact that the dominant peak in each subband corre-
sponds to a particular pitch frequency harmonic shows that
the SCF feature is pitch-dependent, and therefore it is also
speaker-dependent for a given sound. This dependence on
pitch frequency is useful when the vocal tract configura-
tion (i.e., MFCC) is known as seen by the enhanced perfor-
mance. Moreover, the SCF feature is a normalized measure
and should not be significantly affected by the intensity of
speech from different sessions.
0.15
0.1
0.05
Mag.
0 500 1000 1500 2000 2500 3000 3500 4000
Frequency (Hz)
(a) Location of SC
0.15
0.1
0.05
Mag.
0 500 1000 1500 2000 2500 3000 3500 4000
Frequency (Hz)
(b) Location of SCF
0.2
0.1
0
Mag.
8% 18% 2% 33% 38%
0 500 1000 1500 2000 2500 3000 3500 4000
Frequency (Hz)
(c) Percentage of SBW
0.2
0.1
0
Mag.
46% 5% 3% 2% 2%
0 500 1000 1500 2000 2500 3000 3500 4000
Frequency (Hz)
(d) Percentage of SBE
Figure 2: Plot of the spectral features. Subband boundaries are in-
dicated with dark solid lines and feature location is indicated with
dashed lines. (a) Location of the SC, (b) location of the SCF, (c)
SBW as a percentage of the five subbands, (d) SBE as a percentage
of the whole spectrum.
The SBE feature, shown in Figure 2(d), also performed
well in the experiments. This feature provides the distribu-
tion of energy in each subband as a percentage of the entire
spectrum. The SBE is therefore related to the harmonic struc-
ture of the signal as well as the formant locations. Therefore,
the SBE trend can detect changes in the harmonic structure
for a given vocal tract configuration. This is useful because
the SBE trend, when used in conjunction with the vocal tract
information (i.e., the MFCCs), can provide complementary
information. The SBE feature is also a normalized energy
D. Hosseinzadeh and S. Krishnan 7
100
90
80
70
60
50
40
30
20
10
Accuracy (%)
10 15 20 25 30 35 40
SNR (dB)
MFCC+ΔMFCC (baseline)
MFCC+ΔMFCC+SC
MFCC+ΔMFCC+SCF
(a)
100
90
80
70
60
50
40
30
20
10
0
Accuracy (%)
10 15 20 25 30 35 40
SNR (dB)
MFCC+ΔMFCC (baseline)
MFCC+ΔMFCC+SBW
MFCC+ΔMFCC+SBE
MFCC+ΔMFCC+RE
(b)
100
95
90
85
80
75
70
Accuracy (%)
10 15 20 25 30 35 40
SNR (dB)
MFCC+ΔMFCC (baseline)
MFCC+ΔMFCC+SC
MFCC+ΔMFCC+SCF
(c)
100
95
90
85
80
75
70
65
60
55
50
Accuracy (%)
10 15 20 25 30 35 40
SNR (dB)
MFCC+ΔMFCC (baseline)
MFCC+ΔMFCC+SBW
MFCC+ΔMFCC+SBE
MFCC+ΔMFCC+RE
(d)
Figure 3: Performance of spectral features with noise, (a)-(b) with AWGN, (c)-(d) with babble noise.
measure and should not be significantly affected by the inten-
sity (or relative loudness) of speech from different sessions.
The results in Tab le 2 suggestthatforagivenvocaltractcon-
figuration the SBE trend is predictable and complementary
for speaker recognition.
The SBW feature is largely dependent on the SC fea-
ture and the energy distribution of each subband; therefore
it has also performed well for the reasons mentioned above.
Figure 2(c) shows the SBW for each subband as a percentage
of all subbands.
The SFM feature did not perform well because it quan-
tifies characteristics that are not well defined in speech sig-
nals. For example, the SFM feature measures the tonality of
the subband—a characteristic that is difficult to define in the
speech spectrum since its energy is distributed across many
frequencies.
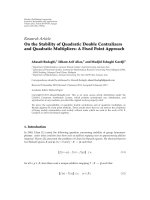
(2) Robustness to distortions
Figure 3 shows the performance of the spectral features with
AWGN and babble noise. It can be seen that most of the pro-
posed features are robust to these types of noise since they
outperform the baseline system. In fact, many of the spectral
features that showed good performance in undistorted con-
ditions also outperformed the baseline system in noisy con-
ditions with the exception of the RE feature. The RE feature
does not perform well under noisy conditions because the
the entropy of noise tends to be greater than the entropy of
8 EURASIP Journal on Advances in Signal Processing
100
90
80
70
60
50
40
30
20
10
0
Accuracy (%)
10 15 20 25 30 35 40
SNR (dB)
MFCC+ΔMFCC (baseline)
MFCC+ΔMFCC+SC
MFCC+ΔMFCC+SCF
(a)
100
90
80
70
60
50
40
30
20
10
0
Accuracy (%)
10 15 20 25 30 35 40
SNR (dB)
MFCC+ΔMFCC (baseline)
MFCC+ΔMFCC+SBW
MFCC+ΔMFCC+SBE
MFCC+ΔMFCC+RE
(b)
100
90
80
70
60
50
40
30
20
10
Accuracy (%)
10 15 20 25 30 35 40
SNR (dB)
MFCC+ΔMFCC (baseline)
MFCC+ΔMFCC+SBW+SC
(c)
0
−1
−2
−3
−4
−5
−6
−7
−8
−9
−10
Magnitude (dB)
0 500 1000 1500 2000 2500 3000 3500 4000
Frequency (Hz)
(d)
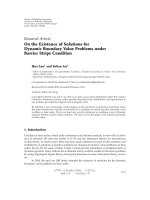
Figure 4: (a), (b), (c) Performance of spectral features in a bandpass channel with AWGN and babble noise (see Figure 1). (d) shows the
frequency response of channel used with 1 dB ripple in the passband (300 Hz–3.4 kHz).
speech signals. Particularly in the case of AWGN, which has
a relatively high entropy, the RE feature effectively character-
izes the amount of noise rather than vocal source activity due
to increased signal variability. Therefore, entropy measures
become less discriminative and lead to poorer performance
under these conditions. Under babble noise, the RE feature
outperformed the baseline system only at high SNR values,
which also indicates that the RE feature is sensitive to the ef-
fects of other speakers.
The best performing feature under both AWGN and bab-
ble noise was the SCF feature which significantly improved
performance under all SNR conditions tested. Since the SCF
feature relies on the peak of each subband, it is very robust
to low SNR conditions. Under babble noise, the SCF shows
an 8.4% improvement over the baseline system at an SNR of
10 dB. A significant improvement can also be seen at other
SNR levels for both babble noise and AWGN.
The SC also improved performance under all of the SNR
conditions tested, while the SBW feature provided improved
performance under most conditions. The SC and SBW fea-
tures rely on the center of gravity of each subband, and there-
fore they are not severely affected by wideband noise such
as AWGN and babble noise. The SC feature showed maxi-
mum improvements of 5.1% (@15 dB) and 3.2% (@20 dB)
for AWGN and babble noise, respectively. The SBW feature
also performed significantly better than the baseline system
under babble noise and generally better than the baseline sys-
tem under AWGN as shown in Figure 3.
D. Hosseinzadeh and S. Krishnan 9
As expected, the SBE feature tends to perform better than
the baseline system only at higher SNR cases. The SBE fea-
ture does not perform well at low SNR conditions because
the energy trend of the spectrum is significantly disturbed at
low SNR conditions.
(3) Robustness to channel effects
Figure 4 shows the system performance when bandpass dis-
tortion has been used to simulate the telephone channel,
and babble noise and AWGN have also been added in equal
amounts to the test utterances. Figure 4(d) shows the fre-
quency response of the channel used, which has a band-
pass range of 300 Hz–3.4 kHz with 1 dB of ripple in the pass-
band. These conditions result in significant amounts of non-
linear distortion in the test utterances which are not found
in the training data. Therefore, these results are the most
convincing because three of the most common distortions
have been simultaneously added in order to simulate a typi-
cal telephone channel and the speaker’s environment. As can
be seen from Figure 4, the same feature sets (SCF, SBW, SC)
still outperform the baseline system. The SCF feature is still
the best performing feature, providing improved results of
up to 4.6%. It should be noted that the MFCC features were
adjusted for the channel effects using the CMN technique,
while the spectral features were used in their distorted form.
5. CONCLUSION
Speaker identification has been traditionally performed by
extracting MFCC or LPCC features from speech. These fea-
tures characterize the anatomical configuration of the vocal
tract, and therefore they are highly speaker-dependent. How-
ever, these features do not provide a complete description
of the vocal system. Capturing additional speaker-dependent
information such as pitch, harmonic structure, and energy
distribution can complement the traditional features and
lead to better speaker models.
To capture additional speaker-dependent information,
several novel spectral features were used. These features
includeSC,SCF,SBW,SBE,SFM,RE,andSE.Atext-
independent cohort GMM-based speaker identification
method was used to compare the performance of the pro-
posed spectral features with the baseline system in noisy and
noise-free conditions.
To show the robustness of the proposed spectral features
in practical conditions, three different distortions were used.
More specifically, AWGN, babble noise, and bandpass fil-
tering (300 Hz–3.4 kHz with a 1 dB bandpass ripple) were
individually and simultaneously applied to the speech sig-
nals to simulate the identification rate of the proposed fea-
tures for a practical telephone channel. Experimental results
show that the spectral features improve the performance of
MFCC-based features. In particular, the SCF feature com-
bined with the MFCC and the ΔMFCC features significantly
outperformed all other feature combinations in almost all
conditions and SNR levels. Other spectral features such as
SC and SBW also performed better than the baseline system
in many of the simulated conditions.
These features improved the overall identification per-
formance because they complement the MFCC-based fea-
tures with additional vocal system characteristics not found
in MFCC or LPCC features. As a result, these features led
to better speaker models. The spectral features are also en-
ergy normalized measures, and hence they are robust to in-
traspeaker biases stemming from the effort or intensity of
speech in different sessions.
The good performance of spectral features for speaker
recognition in this simple speaker identification system is
very promising. These features should also produce good
results if used with more sophisticated speaker recognition
techniques such as universal background model- (UBM-)
based approaches. Furthermore, in this work, the identifi-
cation tests were limited to 7 s utterances due to the size of
the database. Preliminary results show that the identification
performance may be improved significantly for lengthier ut-
terances.
REFERENCES
[1] J. P. Campbell Jr., “Speaker recognition: a tutorial,” Proceedings
of the IEEE, vol. 85, no. 9, pp. 1437–1462, 1997.
[2] D. A. Reynolds and R. C. Rose, “Robust text-independent
speaker identification using Gaussian mixture speaker mod-
els,” IEEE Transactions on Speech and Audio Processing, vol. 3,
no. 1, pp. 72–83, 1995.
[3] R. Vergin, D. O’Shaughnessy, and A. Farhat, “Generalized Mel
frequency cepstral coefficients for large-vocabulary speaker in-
dependent continuous-speech recognition,” IEEE Transactions
on Speech and Audio Processing, vol. 7, no. 5, pp. 525–532,
1999.
[4] A. Teoh, S. A. Samad, and A. Hussain, “An internet based
speech biometric verification system,” in Proceedings of the 9th
Asia-Pacific Conference on Communications (APCC ’03), vol. 2,
pp. 47–51, Penang, Malaysia, September 2003.
[5] K. K. Ang and A. C. Kot, “Speaker verification for home secu-
rity system,” in Proceedings of IEEE International Symposium
on Consumer Electronics (ISCE ’97), pp. 27–30, Singapore, De-
cember 1997.
[6] D. G. Childers and C F. Wong, “Measuring and modeling vo-
cal source-tract interaction,” IEEE Transactions on Biomedical
Engineering, vol. 41, no. 7, pp. 663–671, 1994.
[7] M. D. Plumpe, T. F. Quatieri, and D. A. Reynolds, “Model-
ing of the glottal flow derivative waveform with application to
speaker identification,” IEEE Transactions on Speech and Audio
Processing, vol. 7, no. 5, pp. 569–586, 1999.
[8] R.D.Zilca,J.Navratil,andG.N.Ramaswamy,“Depitchand
the role of fundamental frequency in speaker recognition,” in
Proceedings of the IEEE International Conference on Acoustics,
Speech, and Signal Processing (ICASSP ’03), vol. 2, pp. 81–84,
Hong Kong, April 2003.
[9] N. Zheng and P. C. Ching, “Using haar transformed vocal
source information for automatic speaker recognition,” in
Proceedings of the IEEE International Conference on Acoustics,
Speech, and Signal Processing (ICASSP ’04), vol. 1, pp. 77–80,
Montreal, Canada, May 2004.
[10] A. Martin and M. Przybocki, “The NlST 1999 speaker recog-
nition evaluation—an overview,” Digital Signal Processing,
vol. 10, no. 1–3, pp. 1–18, 2000.
[11] W. N. Chan, T. Lee, N. Zheng, and H. Ouyang, “Use of vocal
source features in speaker segmentation,” in Proceedings of the
10 EURASIP Journal on Advances in Signal Processing
IEEE International Conference on Acoustics, Speech and Signal
Processing (ICASSP ’06), vol. 1, pp. 14–19, Toulouse, France,
May 2006.
[12] D. Hosseinzadeh and S. Krishnan, “Combining vocal source
and MFCC features for enhanced speaker recognition perfor-
mance using GMMs,” in Proceedings of the 9th IEEE Interna-
tional Workshop on Multimedia Signal Processing (MMSP ’07),
Chania, Crete, Greece, October 2007, in press.
[13] M. Faundez-Zanuy and E. Monte-Moreno, “State-of-the-art
in speaker recognition,” IEEE Aerospace and Electronic Systems
Magazine, vol. 20, no. 5, pp. 7–12, 2005.
[14] J. M. Naik, “Speaker verification: a tutorial,” IEEE Communi-
cations Magazine, vol. 28, no. 1, pp. 42–48, 1990.
[15] K. K. Paliwal, “Spectral subband centroid features for speech
recognition,” in Proceedings of the IEEE International Confer-
ence on Acoustics, Speech and Signal Processing (ICASSP ’98),
vol. 2, pp. 617–620, Seattle, Wash, USA, May 1998.
[16] R. E. Yantorno, K. R. Krishnamachari, J. M. Lovekin, D. S. Ben-
incasa, and S. J. Wenndt, “The spectral autocorrelation peak
valley ratio (SAPVR)—a usable speech measure employed as a
co-channel detection system,” in Proceedings of the IEEE Inter-
national Workshop on Intelligent Signal Processing (WISP ’01),
Budapest, Hungary, May 2001.
[17] P. Flandrin, R. G. Baraniuk, and O. Michel, “Time-frequency
complexity and information,” in Proceedings of the IEEE In-
ternational Conference on Acoustics, Speech, and Signal Process-
ing (ICASSP ’94), vol. 3, pp. 329–332, Adelaide, SA, Australia,
April 1994.
[18] S. Aviyente and W. J. Williams, “Information bounds for ran-
dom signals in time-frequency plane,” in Proceedings of the
IEEE International Conference on Acoustics, Speech, and Signal
Processing (ICASSP ’01), vol. 6, pp. 3549–3552, Salt Lake City,
Utah, USA, May 2001.
[19] A. Ramalingam and S. Krishnan, “Gaussian mixture model-
ing of short-time Fourier transform features for audio finger-
printing,” IEEE Transactions on Information Forensics and Se-
curit y, vol. 1, no. 4, pp. 457–463, 2006.
[20] S. Davis and P. Mermelstein, “Comparison of parametric
representations for monosyllabic word recognition in con-
tinuously spoken sentences,” IEEE Transactions on Acoustics,
Speech, and Signal Processing, vol. 28, no. 4, pp. 357–366, 1980.
[21] D. A. Reynolds, T. F. Quatieri, and R. B. Dunn, “Speaker verifi-
cation using adapted Gaussian mixture models,” Digital Signal
Processing, vol. 10, no. 1–3, pp. 19–41, 2000.
[22] R. Auckenthaler, E. S. Parris, and M. J. Carey, “Improving a
GMM speaker verification system by phonetic weighting,” in
Proceedings of the IEEE International Conference on Acoustics,
Speech, and Signal Processing (ICASSP ’99), vol. 1, pp. 313–316,
Phoenix, Ariz, USA, 1999.
[23] A. Dempster, N. Laird, and D. Rubin, “Maximum likelihood
from incomplete data via the em algorithm,” Journalofthe
Royal Statistical Society. Series B (Methodological), vol. 39,
no. 1, pp. 1–38, 1977.
[24] J. Gonzalez-Rodriguez, S. Cruz-Llanas, and J. Ortega-Garcia,
“Biometric identification through speaker verification over
telephonelines,”inProceedings of the 33rd IEEE Annual Inter-
national Carnahan Conference on Security Technology (CCST
’99), pp. 238–242, Madrid, Spain, October 1999.
[25] N. I. of Standards T. (NIST), “The DARPA TIMIT acoustic-
phonetic continuous speech corpus,” speech Disc CD1-1.1,
October 1990.