Báo cáo hóa học: " Research Article Multitarget Identification and Localization Using Bistatic MIMO Radar Systems" pot
Bạn đang xem bản rút gọn của tài liệu. Xem và tải ngay bản đầy đủ của tài liệu tại đây (1.91 MB, 8 trang )
Hindawi Publishing Corporation
EURASIP Journal on Advances in Signal Processing
Volume 2008, Article ID 283483, 8 pages
doi:10.1155/2008/283483
Research Article
Multitarget Identification and Localization Using
Bistatic MIMO Radar Systems
Haidong Yan, Jun Li, and Guisheng Liao
National Lab of Radar Signal Processing, Xidian University, Xi’an 710071, China
Correspondence should be addressed to Jun Li,
Received 19 April 2007; Revised 19 September 2007; Accepted 12 November 2007
Recommended by Arden Huang
A scheme for multitarget identification and localization using bistatic MIMO radar systems is proposed. Multitarget can be dis-
tinguished by Capon method, as well as the targets angles with respect to transmitter and receiver can be synthesized using the
received signals. Thus, the locations of the multiple targets are obtained and spatial synchronization problem in traditional bistatic
radars is avoided. The maximum number of targets that can be uniquely identified by proposed method is also analyzed. It is
indicated that the product of the numbers of receive and transmit elements minus-one targets can be identified by exploiting the
fluctuating of the radar cross section (RCS) of the targets. Cramer-Rao bounds (CRB) are derived to obtain more insights of this
scheme. Simulation results demonstrate the performances of the proposed method using Swerling II target model in various sce-
narios.
Copyright © 2008 Haidong Yan et al. This is an open access article distributed under the Creative Commons Attribution License,
which permits unrestricted use, distribution, and reproduction in any medium, provided the original work is properly cited.
1. INTRODUCTION
Multiple-input multiple-output (MIMO) radar has been re-
cently become a hot research area for its potential advan-
tages. MIMO radar uses multiple antennas to simultaneously
transmit several independent waveforms and exploit multi-
ple antennas to receive the reflected signals. The echo signals
are independent of each other [1–7]. Unlike conventional
phased-array radar, MIMO radar systems transmit different
signals from different transmit elements. Thus, the whole
space can be covered by the electromagnetic waves which
are transmitted by the transmit array. Recently, many MIMO
radar schemes have been proposed to resist the fluctuations
of the target radar cross section (RCS) with the spatial diver-
sity of target scatters to get superiority with waveform diver-
sity in MIMO radar [1], to improve detection performance
[2], to create spatial beampatterns ranging from the high di-
rectionality of phased-array system to the omnidirectional-
lity of MIMO system with orthogonal signals through the
choice of a signal cross-correlation matrix [3], or to achieve
high resolution and excellent interference rejection capability
with the direct application of many adaptive techniques [4].
In [5, 6], additional array freedom and super-resolution pro-
cessing have been achieved by exploiting virtual array sensors
in monostatic MIMO radar system. The synthetic impulse
and aperture radar (SIAR) is also a monostatic MIMO radar
scheme [8]. In conventional bistatic radar, it is required that
the transmitting beam and the receiving beam illuminate to
the same target simultaneously to solve space synchroniza-
tion problem [9]. A bistatic MIMO radar scheme of transmit
spatial diversity had been proposed in [7], and the estima-
tion performance is analyzed. However, only the angles with
respect to the receiver can be determined in this scheme.
A bistatic MIMO radar scheme is proposed to identify
and locate multiple targets in this paper. Two-dimensional
spatial spectrum estimation is carried out at the receiver. Spe-
cially, the method proposed in this paper can parry auto-
matically the spatial 2D angles of targets, which solves the
space synchronization problem in conventional bistatic radar
system. Maximum number of targets that can be uniquely
identified by proposed method is also analyzed in this pa-
per. It is indicated that the product of the number of receive
and transmit elements minus-one targets can be identified
in the case of independently distributed targets by exploiting
the uncorrelation of the reflection coefficients of the targets.
Our scheme can be viewed as an extension of the scheme in
[5, 10].
This paper is organized as follows. The bistatic MIMO
radar signal model is presented in Section 2.InSection 3, the
sufficient statistic and the Capon estimator for identification
2 EURASIP Journal on Advances in Signal Processing
123
M
Transmit arrays
Ta rg e t
θ
t
θ
r
123 N
···
.
.
.
Receive arrays
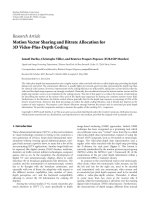
Figure 1: Bistatic MIMO radar scenario.
and location are proposed. The maximum number of iden-
tified targets and Cramer-Rao bounds (CRB) for target lo-
cation are analyzed in Section 4 to obtain more insights of
the proposed scheme. The proposed scheme is tested via a
few cases and simulations, which appear in Section 5. Finally,
Section 6 concludes the paper.
2. BISTATIC MIMO RADAR SIGNAL MODEL
The array structure used in this paper is illustrated in
Figure 1. For clarity and mathematical tractability, we use a
simple model that ignores Doppler effects and clutters, and
the range of the target is assumed much larger than the aper-
ture of transmit array and receive array. Considering the RCS
which is constant during a pulse period and varying inde-
pendently pulse to pulse, our target model is a classical Swer-
ling Case II [11]. The transmit and receive arrays are uni-
form linear arrays (ULA) with M elements at the transmitter
and N elements at the receiver. The elements at the transmit-
ter are omnidirectional. d
t
is the interelement space at the
transmitter and d
r
is the interelement space at the receiver.
Assume that the target is at angles (θ
t
,θ
r
), where θ
t
is the an-
gle of the target with respect to the transmit array and θ
r
is
the angle with respect to the receive array. λ denotes the car-
rier wavelength. s
i
= [s
i
(1), , s
i
(L)]
T
, i = 1···M,denotes
the coded pulse of the ith transmitter, where L represents the
number of codes in one pulse period. In the case of a sin-
gletargetatlocation(θ
t
,θ
r
), the received signal vector of one
pulse period is given by
r(n)
= αa
θ
r
b
T
θ
t
S(n)+w(n), (1)
where (
·)
T
denotes the vector/matrix transpose. r(n) =
[r
1
(n) r
2
(n) ··· r
2
(n)]
T
, S(n) = [s
1
(n) s
2
(n) ··· s
M
(n)]
T
with n = 1 ···L. α denotes the coefficient involving the
reflection coefficients and path loses of the target and we
call it reflection coefficient for short in this paper. a(θ
r
) =
[1 e
j(2π/λ)d
r
sin θ
r
e
j(2π/λ)2d
r
sin θ
r
··· e
j(2π/λ)(N−1)d
r
sin θ
r
]
T
is an
N
×1 vector, usually referred to as the receiver steering vector.
b(θ
r
)=[1 e
j(2π/λ)d
t
sin θ
t
e
j(2π/λ)2d
t
sin θ
t
···e
j(2π/λ)(M−1)d
t
sin θ
t
]
T
is an M × 1 vector, which is usually described as the trans-
mitter steering vector. The noise vectors
{w(n)}
N
n
=1
are as-
sumed to be independent, zero-mean complex Gaussian dis-
tribution with w
∼N
c
(0, σ
2
w
I
N
).
In the case of P targets, (1) is modified to
r(n)
= A
θ
r
diag(α)B
T
θ
t
S(n)+w(n), (2)
where A(θ
r
) = [a(θ
r
1
) a(θ
r
2
) ··· a(θ
r
p
)] is the re-
ceive steering matrix, and θ
r
1
···θ
r
p
denote the an-
gles of the targets with respect to the receive array.
B(θ
t
) = [b(θ
t
1
) b(θ
t
2
) ··· b(θ
t
p
)] is the transmit steering
matrix, and θ
t
1
···θ
t
p
denote the angles of the targets with
respect to the transmit array. diag(v) denotes a diagonal ma-
trix constructed by the vector v. α
= [α
1
···α
p
]
T
,where
α
1
···α
p
are the reflection coefficients of each target.
3. CAPON-BASED TARGETS IDENTIFICATION
AND LOCATION
For simplicity, we assume first that there is only one target
in the space and the signal of one pulse period is transmit-
ted from each transmit element. For orthogonal-transmitted
waveforms such that s
i
s
∗
j
= 0, s
i
s
i
=|s
i
|
2
i/= j = 1 ···M,
where s
i
, s
j
stand for the signals transmitted from the ith
and jth transmit elements. The received signal r(n)canbe
matched by the transmitted waveform to yield a sufficient
static matrix as follows:
Y
=
1
L
L
n=1
r(n)S(n)
H
,(3)
where (
·)
H
denotes the Hermitian operation.
Substitution of (1) into (3), the independent sufficient
statistic vector can be expressed as
η
= row(Y) = row
1
L
L
n=1
r(n)S(n)
H
=
row
1
L
L
n=1
αa
θ
r
b
T
θ
t
S(n)S
H
(n)+w(n)S
H
(n)
=
row
α
L
n=1
a
θ
r
b
T
θ
t
1
L
S(n)S
H
(n)+
1
L
L
n=1
w(n)S
H
(n)
=
row
αa
θ
r
b
T
θ
t
R
s
+row
1
L
L
n=1
w(n)S
H
(n)
=
ακ
θ
r
, θ
t
+ v,
(4)
where R
s
= (1/L)
L
n
=1
S(n)S
H
(n), and R
s
is the identify ma-
trix when transmitted signals are orthogonal. κ(θ
r
, θ
t
) =
row(a(θ
r
)b
T
(θ
t
)R
s
) = row(a(θ
r
)b
T
(θ
t
)) is a vector with the
size of MN
× 1andv = row((1/L)
L
n
=1
w(n)S
H
(n)) is zero-
mean complex Gaussian with v
∼ N
c
(0, σ
2
w
I
NM
). row(·)de-
notes the operator that stacks the rows of a matrix in a col-
umn vector.
When the number of the targets is P and the signals of Q
pulses period are transmitted, (4) can be expressed as follows:
Y
η
= K
θ
r
, θ
t
H + v,(5)
Haidong Yan et al. 3
r
1
r
2
··· r
N
s
∗
1
s
∗
2
s
∗
M
s
∗
1
s
∗
2
s
∗
M
s
∗
1
s
∗
2
s
∗
M
··· ··· ······
Y
η
= [η
1
···η
Q
]
Identification & location algorithms
Figure 2: Sufficient statistic extraction and identification and local-
ization algorithms.
where Y
η
= [η
1
···η
Q
], and η
1
···η
Q
are the suffi-
cient statistic vectors obtained from Q transmitting pulses.
K(θ
r
, θ
t
) = [κ(θ
r
1
, θ
t
1
) ···κ(θ
r
p
, θ
t
p
)] is a matrix of size
MN
× P,
H
=
⎡
⎢
⎢
⎢
⎢
⎣
α
11
α
12
··· α
1Q
α
21
α
22
··· α
2Q
.
.
.
.
.
.
.
.
.
.
.
.
α
P1
α
P2
··· α
PQ
⎤
⎥
⎥
⎥
⎥
⎦
P×Q
(6)
where α
ij
, i = 1 ···P, j = 1 ···Q is the reflection coeffi-
cient of the ith target in the jth transmit pulse period. The
configuration for obtaining the sufficient static from the data
is described in Figure 2.
In practice, different targets have different reflections and
path losses. Considering Swerling Case II target model [11],
we assume that α
i
obeys the complex Gaussian distribution
with zero mean and variance σ
2
α
i
,namelyα
i
∼
c
(0, σ
2
α
i
), i =
1 ···P. The Capon estimator [12]ofθ
t
, θ
r
can be written in
the form
P
Capon
θ
t
,
θ
r
=
1
κ
H
θ
r
, θ
t
R
−1
η
κ
θ
r
, θ
t
,(7)
where R
η
= (1/Q)Y
η
Y
H
η
.
The true targets locations will result in the peaks at the
Capon estimator outputs.
4. PROPERTY ANALYSIS
4.1. Maximum number of target analysis
From (5), the coherence matrix R
η
can be expressed as
R
η
=
1
Q
Y
η
Y
H
η
= K
θ
r
, θ
t
R
H
K
H
θ
r
, θ
t
+ σ
2
w
I
NM
,(8)
where R
H
= (1/Q)HH
H
. We can configure the array struc-
ture to ensure the column full rank of K(θ
r
, θ
t
). If K(θ
r
, θ
t
)is
column full rank, the maximum number of targets that can
be identified depends on the rank of R
η
. It is clear that the
maximum rank of R
η
is NM. So the maximum number of
the targets that can be identified by this scheme is (NM
− 1).
To ensure the maximum number of targets identification, the
matrix R
H
should be full rank. The uncorrelation of the tar-
gets reflection coefficients may guarantee the full rank of R
H
.
Accordingly, the maximum number of identification should
be achieved by making use of the uncorrelation of the re-
flection coefficients of the targets. Our target model in the
simulations of the next section is a classical Swerling case
II with RCS fluctuations fixing during a transmitting pulse
and varying independently pulse to pulse. The targets which
are assumed independent of each other in the space and the
reflection coefficients of different targets are independent in
one pulse period.
4.2. Cramer-Rao bound
Following the approach in [13,Chapter3]and[14], the
stochastic CRB for location parameters of multiple targets
is calculated here to obtain more insights of the proposed
scheme. The Fisher information matrix (FIM) can be calcu-
lated as follows:
J(ξ)
=
1
2
tr
R
−1
η
(ξ)
∂R
η
(ξ)
∂ξ
R
−1
η
(ξ)
∂R
η
(ξ)
∂ξ
=
⎡
⎢
⎢
⎢
⎢
⎢
⎢
⎣
J
θ
r
θ
r
J
θ
r
θ
t
J
θ
r
σ
α
J
θ
r
σ
w
J
T
θ
r
θ
t
J
θ
t
θ
t
J
θ
t
σ
α
J
θ
t
σ
w
J
T
θ
r
σ
α
J
T
θ
t
σ
α
J
σ
α
σ
α
J
σ
α
σ
w
J
T
θ
r
σ
w
J
T
θ
t
σ
w
J
T
σ
α
σ
w
J
σ
w
σ
w
⎤
⎥
⎥
⎥
⎥
⎥
⎥
⎦
,
(9)
where ξ
= [θ
T
r
θ
T
t
σ
α
σ
w
]
T
and σ
α
= [σ
α
1
···σ
α
p
]
T
.The
derivation of the submatrices of FIM in (9) is given in the
appendix. We can calculate the variance of an individual es-
timated parameter by inverting the FIM, namely,
CRB(ξ)
= diag
J
−1
ξ
, (10)
where diag(
·) denotes a vector constructed by the diagonal
elements of the matrix (
·).
In (10), the first P elements of CRB(ξ) are the CRB
for θ
r
1
···θ
r
p
and the second P elements are the ones for
θ
t
1
···θ
t
p
.
4.3. Analysis of the CRB
The transmit signals used in this subsection are as follows.
Hadamard code pulse signals (HCP): each transmitter
transmits the different Hadamard code with the same carrier
frequency.
The step-frequency Hadamard code pulse signals
(FHCP): each transmitter transmits different Hadamard
code with different carrier frequency.
Random Binary-phased Code Pulse signals (RBCP)—the
transmit signals are pseudorandom binary code with same
carrier frequency.
3-transmitter/3-receiver system is considered and the ar-
ray structure is shown in Figure 1. The element space is
selected as half wavelength (for FHCP, the element space
4 EURASIP Journal on Advances in Signal Processing
10
−4
10
−3
10
−2
10
−1
10
0
(CRB)
Transmit angle of target
Receive angle of target
100
0
−100
−50
0
50
100
(a)
10
−4
10
−3
10
−2
10
−1
10
0
(CRB)
Transmit angle of target
Receive angle of target
100
50
0
−50
−100
−50
0
50
100
(b)
Figure 3: The CRB for bistatic MIMO radar, M = N = 3, L = 256, SNR = 8dB,σ
2
α
= 0.1. (a) The CRB for receive angle of range [−80
◦
,80
◦
]
with transmit angle varying from
−80
◦
to 80
◦
; (b) the CRB for transmit angle of range [−80
◦
,80
◦
] with receive angle varying from −80
◦
to
80
◦
.
10
−3
10
−2
10
−1
10
0
CRB for receive
angle of target
CRB
0246810
SNR
HCP
RBCP
FHCP
(a)
10
−3
10
−2
10
−1
10
0
CRB for transmit
angle of target
CRB
0246810
SNR
HCP
RBCP
FHCP
(b)
Figure 4: The CRB for MIMO radar of a single target with different
signals; θ
t
= 0
◦
, θ
r
= 0
◦
, σ
2
α
= 0.1.
is the half-wavelength of the maximum carrier frequency).
Figure 3 shows respectively the variation of CRB of the trans-
mit angle and receive angle with the location of one target.
The transmit signal is selected as RBCP. In Figure 3(a),we
can observe that the far the target angles depart from norm
of receiver, the worse the estimation performance of receive
angle is. While the CRB of receive angle is kept constant with
varying transmit angles. It means that the performance of re-
ceive angle is not related to transmit angle of the target. The
similar conclusion for the CRB of transmit angle can also be
obtained from Figure 3(b).
We compare the CRBs of location parameters for single
target with different transmit signals in Figure 4.TheFHCP
10
−4
10
−2
10
0
10
2
10
4
10
6
10
8
CRB
12345678 9
P
Receive angle of the first target
Transmit angle of the first target
Figure 5: CRB of the first target located at θ
r
1
= 0
◦
, θ
t
1
= 0
◦
versus
the number of target P, SNR
= 8dB.
signals, RBCP signals, and HCP signals are used, respectively.
Although the correlation matrix of both FHCP signals and
HCP signals is the identify matrix, it can be observed that the
CRB of the former is lower than the latter. The reason is that
they have different array manifolds. As the cross correlation
of RBCP signals is not zero, its CRB is the worst among three
transmit signals.
In Figures 5 and 6, we investigate the CRB in the case of
multitarget. The transmit signal is RBCP. The CRB of Target
1 as a function of the number targets is plotted in Figure 5.
The simulation parameters of the targets are given in Tab le 1 .
It is shown that the curve is almost flat when the number of
the targets is less than 9. As the number of targets is nine,
Haidong Yan et al. 5
Table 1: Locations of the nine targets.
Targets123456789
θ
r
0 −40 −50 10 −20 40 20 50 −30
θ
t
0 −20 50 −10 −50 −40 60 30 30
σ
2
α
0.1 0.15 0.2 0.25 0.3 0.35 0.4 0.45 0.5
10
−3
10
−2
10
−1
10
0
10
1
CRB
123456
Receive angle of target2
Receive angle of target1
Receive angle of target3
(a)
10
−3
10
−2
10
−1
10
0
10
1
CRB
123456
Transmit angle of target2
Transmit angle of target1
Transmit angle of target3
(b)
Figure 6: CRB of Target 1 and Target 3 as a function of Target 2’s
angles, where Target 1 locates at θ
t1
= 0
◦
, θ
r1
= 0
◦
,Target3locates
at θ
t3
= 50
◦
, θ
r3
= 50
◦
, σ
2
α
1
= 0.7, σ
2
α
2
= 0.75, σ
2
α
3
= 0.8 SNR = 8dB.
the value of CRB is infinite. It is consistent with the result
discussed previously in Section 4.1.
Figure 6 shows the interaction of the adjacent targets.
Two targets are fixed at [θ
t1
, θ
r1
] = [0
◦
,0
◦
](Target1)and
[θ
t3
, θ
r3
] = [50
◦
,50
◦
](Target3)withσ
2
α
1
= 0.7, σ
2
α
3
= 0.8.
The location of another target (Target 2) is varying from
[θ
t2
, θ
r2
] = [0.6
◦
,0.6
◦
]to[6
◦
,6
◦
]withσ
2
α
2
= 0.75, which
is very close to Target 1 and far from Target 3. It is shown
that the CRB of Target 1 increases when the angles of Target
2 are close to Target 1. However, the adjacency of Target 1 and
Target 2 does not almost influence the performance of Target
3.
5. SIMULATION RESULTS
In this section, we demonstrate via simulations the identifi-
cation and localization performance of the scheme proposed
in this paper. Three transmit antennas and three receive an-
tennas are considered, that is, M
= N = 3. The array struc-
ture is the same as Figure 1, and with half-wavelength space
between adjacent elements used both for transmitter and re-
ceiver. Signal-to-noise ratio (SNR) is 8 dB and L
= 256 is the
number of code in one pulse period. The number of trans-
mitted pulses is Q
= 500.
Table 2: Locations of the six targets.
Ta rge ts 1 2 3 4 5 6
θ
t
40 −20 0 25 −50 10
θ
r
−45 −35 0 20 30 40
σ
2
α
0.6 0.65 0.7 0.75 0.8 0.85
Table 3:Locationsoftheeighttargets.
Targets12345678
θ
t
50 −20 −50 −10 −40 60 30 10
θ
r
−50 −40 −20 10 40 20 50 −10
σ
2
α
0.5 0.55 0.6 0.65 0.7 0.75 0.8 0.85
5.1. The influence of the transmitted signals
We demonstrate the influence of the transmitted signals with
three transmitted signal cases: HCP signals, FHCP signals,
and RBCP signals. The performances of these three different
transmitted signal cases are plotted in Figures 7(a), 7(b),and
7(c). The target locates at θ
t
= 0
◦
, θ
r
= 0
◦
with σ
2
α
= 0.8. It
is shown that the identification performance with HCP sig-
nals and FHCP signals is superior to the performance ob-
tained with RBCP signals. The correlation of transmit wave-
form would degrade the performance.
The cases of multitarget are plotted in Figures 8(a), 8(b),
and 8(c). Six targets are identified and localized effectively.
It is shown that all the three signals cases can identify and
locate the targets. However, HCP signals and FHCP signals
have better identifibility than RBCP signals.
In Figure 9, localization and identification of eight dif-
ferent targets (maximum target number) are plotted in the
case of three different transmitted signals. The locations of
the targets are given in Tab le 3 . It is shown that eight differ-
ent targets can be identified and located in the three cases.
We can see that the performance of identification in HCP
signals and FHCP signals is much better than that of the case
in RBCP signals. It can be observed from Figures 9(a) and
9(b) that when the target number reach the maximum iden-
tifiable number, the peak sidelobes level is much higher (ap-
proximately 10 dB) than that of the one in Figure 9(c).Itcan
be concluded that the identification performance of FHCP
signals is superior to the performance obtained by HCP sig-
nals and RBCP signals. Accordingly, the performance of tar-
get identification and location is closely related to the trans-
mitted signals.
From Figures 7, 8,and9, we can also observe that the tar-
gets’ 2D angles can be paired automatically in our scheme.
And the maximum number of targets can be identified is
(NM
− 1) = (3 × 3 − 1) = 8, which is consistent with the
conclusion in Section 4.
5.2. Identifiability of adjacent targets
In this subsection, we investigate the identifiability of two
adjacent targets and its influence on another target by sim-
ulations in RBCP signals. In Figure 10(a), Target 1 is located
6 EURASIP Journal on Advances in Signal Processing
−50
−40
−30
−20
−10
0
(dB)
100
50
0
−50
−100
100
−100
−50
0
50
Transmit angles of target
Receive angles of target
(a) RBCP signals case
−50
−40
−30
−20
−10
0
(dB)
100
50
0
−50
−100
100
−100
−50
0
50
Transmit angles of target
Receive angles of target
(b) HCP signals case
−50
−40
−30
−20
−10
0
(dB)
100
50
0
−50
−100
100
−100
−50
0
50
Transmit angles of target
Receive angles of target
(c) FHCP signals case
Figure 7: Performance of one target locates at θ
t
= 0
◦
, θ
r
= 0
◦
, σ
2
α
= 0.8.
−30
−25
−20
−15
−10
−5
0
(dB)
100
50
0
−50
−100
100
−50
0
50
Transmit angles
of target
Receive angles of target
(a) RBCP signals case
−40
−30
−20
−10
0
(dB)
100
50
0
−50
−100
100
−100
−50
50
0
Transmit angles
of target
Receive angles of target
(b) HCP signals case
−40
−30
−20
−10
0
(dB)
100
50
0
−50
−100
100
−100
−50
0
50
Transmit angles
of target
Receive angles of target
(c) FHCP signals case
Figure 8: Identification and localization for six targets, SNR = 8dB.
−25
−20
−15
−10
−5
0
(dB)
100
50
0
−50
−100
100
−50
0
50
Transmit angles
of target
Receive angles of target
(a) RBCP signals case
−40
−30
−20
−10
0
(dB)
100
0
−100
−100
100
−50
0
50
Transmit angles
of target
Receive angles of target
(b) HCP signals case
−40
−30
−20
−10
0
(dB)
100
0
−100
−100
100
−50
0
50
Transmit angles
of target
Receive angles of target
(c) FHCP signals case
Figure 9: Identification and localization for six targets, SNR = 8dB.
at [0
◦
,0
◦
]withσ
2
α
1
= 0.7 and Target 2 is located at [2
◦
,2
◦
]
with σ
2
α
2
= 0.75. It is shown that they are too close to sep-
arate. But they do not affect the location and identification
performance of Target 3 which is located at [50
◦
,50
◦
]with
σ
2
α
3
= 0.8. In Figure 10(b), the Target 2 is moved to be lo-
cated at [6
◦
,6
◦
].NowitisfarenoughtoseparateTarget1
and Target 2. These simulation results are consistent with the
results from the analysis of CRB in Section 4.3.
6. CONCLUSIONS
In this paper, anew scheme of multitarget resolution and lo-
calization using bistatic MIMO radar systems is presented.
Multitarget can be distinguished, as well as the targets an-
gles with respect to transmitter and receiver can be synthe-
sized using the received signals. Accordingly, the locations
of the multiple targets are obtained and spatial synchroniza-
tion problem in traditional bistatic radars is avoided. The
maximum number of targets that can be uniquely identi-
fied by proposed method is also analyzed. It is indicated that
the product of the number of receive and transmit elements
minus-one targets can be identified in the case of indepen-
dently distributed targets by exploiting the spatial and tem-
poral uncorrelation of the reflection coefficient of the targets.
From Section 5, it is seen that the performance of the targets
identification and localization is closely related to the form
Haidong Yan et al. 7
−50
−40
−30
−20
−10
0
(dB)
Transmit angles of target
Receive angles of target
100
0
−100
−50
−50
0
50
100
(a) Target2islocatedat[2
◦
,2
◦
]
−40
−30
−20
−10
0
(dB)
Transmit angles of target
Receive angles of target
100
0
−100
−50
0
50
100
(b) Target 2 is located at [6
◦
,6
◦
]
Figure 10: Identifiability of the adjacent targets (Target 1 [0
◦
,0
◦
]; Target 3 [50
◦
,50
◦
]; SNR = 8dB,σ
2
α
1
= 0.7, σ
2
α
2
= 0.75, σ
2
α
3
= 0.8).
of the transmit signal. How to design good transmit signals
for bistatic MIMO radar is the focus of our future work.
APPENDIX
A. FISHER INFORMATION MATRIX DERIVATION
In this appendix, we derive the elements of the submatrices
in (9).
From (5) we can see that the observations satisfy the
stochastic model Y
∼ N
c
(0, R
η
)(see[15]), where R
η
=
E{YY
H
}≈(1/Q)Y
η
Y
H
η
= K(θ
r
, θ
t
)R
H
K
H
(θ
r
, θ
t
)+σ
2
w
I
NM
is the NM × NM array data covariance matrix.
Let us consider the following matrix:
R
H
σ
α
=
⎡
⎢
⎢
⎣
σ
2
α
1
.
.
.
σ
2
α
p
⎤
⎥
⎥
⎦
,(A.1)
where σ
α
= [σ
α
1
···σ
α
p
]
T
is the vector of the unknown pa-
rameters which are used to parameterize the reflection coef-
ficients covariance matrix. Thus, the (3P+1)
×1vectorofun-
known parameters can be written as ξ
= [θ
T
r
θ
T
t
σ
α
T
σ
w
]
T
.
Under the previous assumptions, the Fisher information
matrix (FIM) [13, Chapter 3] for the parameter vector ξ is
given by
J(ξ)
=
1
2
tr
R
−1
η
(ξ)
∂R
η
(ξ)
∂ξ
R
−1
η
(ξ)
∂R
η
(ξ)
∂ξ
. (A.2)
And here we rewrite the expression of the submatrices
with their elements as J
θ
r
θ
r
={J
θ
r
l
θ
r
k
}
P×P
, J
θ
r
θ
t
={J
θ
r
l
θ
t
k
}
P×P
,
J
θ
t
θ
t
={J
θ
t
l
θ
t
k
}
P×P
, J
θ
r
σ
α
={J
θ
r
l
σ
α
k
}
P×P
, J
θ
t
σ
α
={J
θ
t
l
σ
α
k
}
P×P
,
J
σ
α
σ
α
={J
σ
α
l
σ
α
k
}
P×P
, J
θ
r
σ
w
={J
θ
r
l
σ
w
}
P×1
, J
θ
t
σ
w
={J
θ
t
l
σ
w
}
P×1
,
J
σ
α
σ
w
={J
σ
α
l
σ
w
}
P×1
, J
σ
w
σ
w
={J
σ
w
σ
w
}
1×1
,forl, k = 1 ···P.
The following derivatives are calculated firstly:
∂K
θ
r
, θ
t
∂θ
r
l
=
0 ···
∂k
θ
r
l
, θ
t
l
∂θ
r
l
···0
NM×P
,
∂R
H
∂σ
α
l
= 2
⎡
⎢
⎢
⎢
⎢
⎢
⎢
⎢
⎢
⎣
0
.
.
.
σ
α
l
.
.
.
0
⎤
⎥
⎥
⎥
⎥
⎥
⎥
⎥
⎥
⎦
P×P
,
∂
σ
2
w
I
NM
∂σ
w
= 2σ
w
I
NM
(A.3)
for l
= 1 ···P.
For succinctness, we only give the detail derivation of
J
θ
r
l
θ
r
k
here:
J
θ
r
l
θ
r
k
=
1
2
tr
R
−1
η
(ξ)
∂R
η
(ξ)
∂θ
r
l
R
−1
η
(ξ)
∂R
η
(ξ)
∂θ
r
k
=
1
2
tr
R
−1
η
(ξ)
∂
K
θ
r
, θ
t
R
H
K
H
θ
r
, θ
t
+ σ
2
w
I
NM
∂θ
r
l
× R
−1
η
(ξ)
∂K
θ
r
, θ
t
R
H
K
H
θ
r
, θ
t
+ σ
2
w
I
NM
∂θ
r
k
=
1
2
tr
R
−1
η
(ξ)
∂
K
θ
r
, θ
t
∂θ
r
l
R
H
K
H
θ
r
, θ
t
+ K
θ
r
, θ
t
R
H
∂
K
H
θ
r
, θ
t
∂θ
r
l
×
R
−1
η
(ξ)
∂
K
θ
r
, θ
t
∂θ
r
k
R
H
K
H
θ
r
, θ
t
+ K
θ
r
, θ
t
R
H
∂
K
H
θ
r
, θ
t
∂θ
r
k
8 EURASIP Journal on Advances in Signal Processing
=
1
2
σ
2
α
l
σ
2
α
k
tr
R
−1
η
(ξ)
∂k
θ
r
l
, θ
t
l
∂θ
r
l
k
H
θ
r
l
, θ
t
l
+ k
θ
r
l
, θ
t
l
∂k
H
θ
r
l
, θ
t
l
∂θ
r
l
×
R
−1
η
(ξ)
∂k
θ
r
k
, θ
t
k
∂θ
r
k
k
H
θ
r
k
, θ
t
k
+ k
θ
r
k
, θ
t
k
∂k
H
θ
r
k
, θ
t
k
∂θ
r
k
=
1
2
σ
2
α
l
σ
2
α
k
tr
R
−1
η
(ξ)
∂k
θ
r
l
, θ
t
l
k
H
θ
r
l
, θ
t
l
∂θ
r
l
× R
−1
η
(ξ)
∂k
θ
r
k
, θ
t
k
k
H
θ
r
k
, θ
t
k
∂θ
r
k
.
(A.4)
Making use of the derivation approach of (A.4)along
with (A.2)and(A.3), we can also derive the other elements
of the FIM as follows:
J
θ
r
l
θ
t
k
=
1
2
σ
2
α
l
σ
2
α
k
tr
R
−1
η
(ξ)
∂k
θ
r
l
, θ
t
l
k
H
θ
r
l
, θ
t
l
∂θ
r
l
× R
−1
η
(ξ)
∂k
θ
r
k
, θ
t
k
k
H
θ
r
k
, θ
t
k
∂θ
t
k
,
J
θ
t
l
θ
t
k
=
1
2
σ
2
α
l
σ
2
α
k
tr
R
−1
η
(ξ)
∂k
θ
r
l
, θ
t
l
k
H
θ
r
l
, θ
t
l
∂θ
t
l
× R
−1
η
(ξ)
∂k
θ
r
k
, θ
t
k
k
H
θ
r
k
, θ
t
k
∂θ
t
k
,
J
θ
r
l
σ
α
k
= σ
2
α
l
σ
α
k
tr
R
−1
η
(ξ)
∂k
θ
r
l
, θ
t
l
k
H
θ
r
l
, θ
t
l
∂θ
r
l
× R
−1
η
(ξ)k
θ
r
k
, θ
t
k
k
H
θ
r
k
, θ
t
k
,
J
θ
t
l
σ
α
k
= σ
2
α
l
σ
α
k
tr
R
−1
η
(ξ)
∂k
θ
r
l
, θ
t
l
k
H
θ
r
l
, θ
t
l
∂θ
t
l
× R
−1
η
(ξ)k
θ
r
k
, θ
t
k
k
H
θ
r
k
, θ
t
k
,
J
σ
α
l
σ
α
k
= 2σ
α
l
σ
α
k
tr
R
−1
η
(ξ)k
θ
r
l
, θ
t
l
k
H
θ
r
l
, θ
t
l
×
R
−1
η
(ξ)k
θ
r
k
, θ
t
k
k
H
θ
r
k
, θ
t
k
,
J
θ
r
l
σ
w
= σ
2
α
l
σ
w
tr
R
−1
η
(ξ)
∂k
θ
r
l
, θ
t
l
k
H
θ
r
l
, θ
t
l
∂θ
r
l
R
−1
η
(ξ)
,
J
θ
t
l
σ
w
= σ
2
α
l
σ
w
tr
R
−1
η
(ξ)
∂k
θ
r
l
, θ
t
l
k
H
θ
r
l
, θ
t
l
∂θ
t
l
R
−1
η
(ξ)
,
J
σ
α
l
σ
w
= 2σ
α
l
σ
w
tr
R
−1
η
(ξ)k
θ
r
l
, θ
t
l
k
H
θ
r
l
, θ
t
l
R
−1
η
(ξ)
,
J
σ
w
σ
w
= 2σ
2
w
tr
R
−1
η
(ξ)R
−1
η
(ξ)
.
(A.5)
ACKNOWLEDGMENTS
This research is supported by Key Project of Ministry of Ed-
ucation of China under Contract no. 107102. The authors
are grateful to the anonymous referees for their constructive
comments and suggestions in improving the quality of this
paper.
REFERENCES
[1] J. Li and P. Stoic, “MIMO radar—diversity means superior-
ity,” in Proceedings of the 14th Adaptive Sensor Array Process-
ing Workshop (ASAP ’06), Lincoln Lab, Mass, USA, December
2006.
[2] E. Fishler, A. Haimovich, R. S. Blum, L. J. Cimini Jr., D.
Chizhik, and R. A. Valenzuela, “Spatial diversity in radars-
models and detection performance,” IEEE Transactions on Sig-
nal Processing, vol. 54, no. 3, pp. 823–838, 2006.
[3] D. R. Fuhrmann and G. S. Antonio, “Transmit beamforming
for MIMO radar systems using partial signal correlation,” in
Proceedings of the 38th Asilomar Conference on Signals, Systems
and Computers (ACSSC ’04), vol. 1, pp. 295–299, Pacific Grove,
Calif, USA, November 2004.
[4] L. Xu, J. Li, and P. Stoica, “Adaptive techniques for mimo
radar,” in Proceedings of the 4th Workshop on Sensor Array
and Multichannel Signal Processing (SAM ’06), pp. 258–262,
Waltham, Mass, USA, July 2006.
[5] I. Bekkerman and J. Tabrikian, “Target detection and local-
ization using MIMO radars and sonars,” IEEE Transactions on
Signal Processing, vol. 54, no. 10, pp. 3873–3883, 2006.
[6]F.C.Robey,S.Coutts,D.D.Weikle,J.C.McHarg,andK.
Cuomo, “MIMO radar theory and exprimental results,” in
Proceedings of the 38th Asilomar Conference on Signals, Systems
and Computers (ACSSC ’04), vol. 1, pp. 300–304, Pacific Grove,
Calif, USA, November 2004.
[7] E. Fishler, A. Haimovich, R. S. Blum, L. J. Cimini, D. Chizhik,
and R. A. Valenzuela, “MIMO radar: an idea whose time has
come,” in Proceedings of the IEEE Radar Conference, pp. 71–78,
Philadelphia, Pa, USA, April 2004.
[8] C. Baixiao, Z. Hongliang, W. Yajun, and W. Jun, “Analysis and
experimental results on sparse array synthetic impulse and
aperture radar,” in Proceeding of CIE International Conference
Radar, pp. 76–80, Beijing, China, October 2001.
[9] M. I. Skolnik, Radar Handbook, McGraw-Hill, New York, NY,
USA, 1990.
[10] I. Bekkerman and J. Tabrikian, “Spatially coded signal model
for active arrays,” in Proceedings of IEEE International Confer-
ence on Acoustics, Speech, and Signal Processing (ICASSP ’04),
vol. 2, pp. 209–212, Montreal, Quebec, Canada, May 2004.
[11] M. I. Skolnik, Introduction to Radar System 3E, McGraw-Hill,
New York, NY, USA, 2001.
[12] L. Deshu, Spatial Spectrum Estimation and Application, Uni-
versity of Science and Technology of China Press, BeiJing,
China, 1997.
[13] S. M. Kay, Fundamentals of Statistical Signal Processing: Estima-
tion Theory, Prentice-Hall, Englewood Cliffs, NJ, USA, 1998.
[14] P. Stoica and A. Nehorai, “Performance study of condi-
tional and unconditional direction-of-arrival estimation,”
IEEE Transactions on Acoustics, Speech, and Signal Processing,
vol. 38, no. 10, pp. 1783–1795, 1990.
[15] P. Stoica, E. G. Larsson, and A. B. Gershman, “The stochastic
CRB for array processing: a textbook derivation,” IEEE Signal
Processing Letters, vol. 8, no. 5, pp. 148–150, 2001.