Báo cáo hóa học: " Research Article Face Recognition Incorporating Ancillary Information" pptx
Bạn đang xem bản rút gọn của tài liệu. Xem và tải ngay bản đầy đủ của tài liệu tại đây (3.18 MB, 11 trang )
Hindawi Publishing Corporation
EURASIP Journal on Advances in Signal Processing
Volume 2008, Article ID 312849, 11 pages
doi:10.1155/2008/312849
Research Article
Face Recognition Incorporating Ancillary Information
Sang-Ki Kim, Kar-Ann Toh, and Sangyoun Lee
School of Electrical and Electronic Engineering, Yonsei University, Seoul 120-749, South Korea
Correspondence should be addressed to Sangyoun Lee,
Received 1 May 2007; Revised 26 July 2007; Accepted 16 September 2007
Recommended by Juwei Lu
Due to vast variations of extrinsic and intrinsic imaging conditions, face recognition remained to be a challenging computer vision
problem even today. This is particularly true when the passive imaging approach is considered for robust applications. To advance
existing recognition systems for face, numerous techniques and methods have been proposed to overcome the almost inevitable
performance degradation due to external factors such as pose, expression, occlusion, and illumination. In particular, the recent
part-based method has provided noticeable room for verification performance improvement based on the localized features which
have good tolerance to variation of external conditions. The part-based method, however, does not really stretch the performance
without incorporation of global information from the holistic method. In view of the need to fuse the local information and the
global information in an adaptive manner for reliable recognition, in this paper we investigate whether such external factors can
be explicitly estimated and be used to boost the verification performance during fusion of the holistic and part-based methods.
Our empirical evaluations show noticeable performance improvement adopting the proposed method.
Copyright © 2008 Sang-Ki Kim et al. This is an open access article distributed under the Creative Commons Attribution License,
which permits unrestricted use, distribution, and reproduction in any medium, provided the original work is properly cited.
1. INTRODUCTION
Over the past few decades, face recognition has emerged to
be among the most active and challenging research problems
in computer vision and image analysis. Particularly, the sub-
space projection-based face representation techniques such
as PCA [1], LDA [2], ICA [3], and LFA [4]haveachieved
remarkable progress in terms of recognition performance.
However, the performance of current systems is still limited
by external conditions such as illumination, head pose, facial
expression, and occlusion [5–8].
A lot of research efforts have been spent to overcome the
deteriorating effects of these external factors. Particularly, the
part-based face representation methods, such as independent
component analysis (ICA) and local feature analysis (LFA),
have shown promising performance under certain facial con-
ditions. As the performance of projection-based methods
(such as PCA) relies heavily on accurate face normalization,
the sensitivity to normalization inherently imposes the re-
quirement of good image quality. The part-based methods
relax much of this image quality constraint. The advantage of
these part-based methods over the projection-based methods
comes from their spatially localized basis vectors. Since face
is a nonrigid object, these part-based face representations are
less sensitive to facial variations due to partial occlusions and
local distortions.
However, the part-based method alone loses the global
relationship information among various face features. As
such, holistic methods, such as PCA, still show better perfor-
mance for minor distorted face images as in simple duplica-
tions or images with slight facial expressions than that of the
part-based method. Based on this viewpoint, it has been ar-
gued that practical systems should adopt a combination of
global and local part-based methods to stretch the overall
system’s verification performance [4, 5]. This point of view
is also encouraged by those studies on human nature in psy-
chology community which insists that people should utilize
both local and global features of faces for recognition [9].
To realize this paradigm, an efficient fusion strategy is
needed. There have been much research efforts set forth to
fuse the local and global information in score level [10].
Sum-rule fusion, voting fusion, or other classifiers such as
support vector machines (SVM) have been adopted for the
score-level fusion. However, most fusion strategies seek to
locate a fixed set of weights between both pieces of informa-
tion. This is quite different from the behavior of human cog-
nition where the global features have been utilized for recog-
nizing a remote face and the local features have been utilized
2 EURASIP Journal on Advances in Signal Processing
to recognize an occluded face such as one wearing sunglasses.
This shows that fusion of the holistic and the part-based
methods should be adaptive to external conditions of the in-
put face image.
In this paper, we propose a method to isolate the external
factors for efficient fusion of holistic (global) and part-based
(local) information. We will investigate whether the external
factors can be explicitly estimated and be used to boost the
verification performance or not. Essentially, the problem is
treated as an estimation and classification problem. Encod-
ing and estimation schemes are proposed to handle the com-
plex situations whereby individual external factor (such as
pose, illumination, expression, and occlusion) contains vary-
ing conditions (such as directions of illumination and pose,
and location of occlusion). A classification framework is then
employed to deal with these multiple external factors and
face features. Empirical experiments were performed to ob-
serve the effectiveness of the proposed method using the AR
database [11].
The rest of this paper is organized as follows. In Section 2,
the proposed methodology is described and illustrated. Es-
sentially, a coding system is formulated to provide an explicit
descriptor of the external conditions. The estimated codes
which represented the environmental information are sub-
sequently fused with local and global face feature informa-
tion for identity verification. In Section 3, the database and
the details of our experimental observations are presented.
Finally, some concluding remarks are drawn in Section 4.
2. PROPOSED METHODOLOGY
2.1. Dealing with external factors
2.1.1. Segregating different factors using code words
We present a fundamental strategy to deal with external fac-
tors in this section. The basic idea is to encode the various ex-
ternal factors so that these codes can be utilized to segregate
the different factors where an adaptive fusion of all informa-
tion for verification can be performed. Similar to normal-
ization techniques, we can anticipate that good verification
performance will be achieved whereby the identities from
face images can be easier distinguished or matched under ho-
mogenous conditions than that under a flood of different ex-
ternal factors which make the appearance different even for
the same identity.
This method is motivated by our experimental observa-
tion. Figure 1 shows an exemplary case. Each dot in this fig-
ure represents the measured face similarities between a probe
and a gallery in terms of the PCA output space (i.e., Eu-
clidean distance from comparison of two points in PCA sub-
space which corresponds to the horizontal axis of plots in
Figure 1) and the ICA output space (i.e., Euclidean distance
from comparison of two points in ICA subspace which cor-
responds to the vertical axis of plots in Figure 1). Since each
dot contains two (or more, for more than two modalities)
distance components, we will call it a face distance vector.
The grey tone and the dark tone dots denote the face dis-
tance vectors from genuine and imposter matches, respec-
To t a l
With glasses Without glasses
Without glasses Without glasses
&
With glasses With glasses
Figure 1: Distribution of genuine (grey tone) and imposter (dark
tone) face distance vectors.
tively. According to the prior information regarding whether
the subject in each image is wearing glasses or not, every
match can be divided into two cases as shown on the right
side of Figure 1: the top panel indicates that only one sub-
ject in either the probe image or the gallery image is wearing
glasses, and the bottom panel indicates that either both ob-
jectsarewearingglassesorbotharenot.Itcanbeseenfrom
this figure that the distributions of genuine and imposter dis-
tance vectors are more separable when they are divided than
when they are mixed together. Hence, when a certain amount
of prior information regarding the glasses of the subject is
known, we postulate that a higher verification performance
can be achieved by introducing two distinct classifiers for the
two better segregated cases than that attempting to classify
the mixed case using a single classifier.
Apart from the information on wearing glasses, the above
matching data (distance vectors) can be extended to various
cases using information from other external factors such as
illumination, pose, and facial expression. Although the data
distribution of a case of external factor is different from that
of another case, the information on the external factors is
homogenous within each case. Hence, a group of matching
data under a single case can be treated as a band.Inorder
to effectively separate the genuine and the imposter distribu-
tions in a manner similar to that in Figure 1, a local classifier
is required for each pair of conditions within and between
the bands. Since the entire combinatorial pairs within and
between the external factors should be considered, this will
result in an explosion of the number of local classifiers re-
quired.
Here, we devise a solution which integrates multiple lo-
cal classifiers into a single classification framework. Firstly,
wedefineanaxis,whichwecalledacode distance axis (this
terminology will be explained in greater detail in next sec-
tion) in addition to the axes of the face distance vector. With
this definition of a new axis, we can then assign a certain
coordinate value to each band, and we will call this value a
code distance. The code distance of one band should be dif-
ferent from another band indicating difference among those
Sang-Ki Kim et al. 3
ICA
output space
PCA
output space
Code
distance axis
Figure 2: Separating hyperplanes in a newly defined higher-
dimensional space (here, e.g., three dimensions). The black curved
lines represent the decision hyperplanes ordered according to dif-
ferent code distances.
external factors. As illustrated in Figure 2, the mass of data
can be divided into different bands in the space along the
code distance axis when all the various external factors are
considered. Since the code distance axis can cater for vari-
ous external factors, a single classifier can thus be designed
to fuse the diverse information within a single classification
framework. Here, we note that the prior information regard-
ing external factors is unknown in real-word applications,
and it has to be estimated. An estimation-classifier will be de-
signed for individual external factor estimation and a fusion-
classifier will be designed for information fusion after esti-
mation. We will employ the well-known SVM classifier for
both external factors estimation and information fusion, and
pay particular attention to illumination variations, facial ex-
pressions, and partial occlusions in this study.
2.1.2. Code design
As mentioned above, in order to sort and segregate the en-
tire set of face distance vectors according to the external vari-
ables, a new axis is defined. This code distance axis needs to
satisfy the following two conditions for effective information
segregation. Firstly, the coordinates within the code distance
axis should vary according to the difference among the exter-
nal factors. This is obvious, because the objective of this new
axis is to separate each band such that a large difference be-
tween two external factors results in a large matching error.
Secondly, within each band, the symmetry between external
factors of the probe and the gallery should be satisfied. This
is because the objective of a verification system is merely to
measure the similarity between two input face images regard-
less of whether it is probe or gallery. Hence, a matching data
should remain within the same band when the external fac-
tors of its probe and gallery are reversed.
Considering these requirements, we decided to repre-
sent each external condition with appropriate code words,
such that each matching coordinate (from comparison of
two code words) along the code distance axis is determined
by the Euclidean distance between the code words of probe
and gallery. This is the main reason that the new axis is called
a code distance axis. In the rest of this section, we will discuss
the design of our code word system.
We begin with an intuitive code assignment which as-
signs a 2-digit binary code for the illumination condition ac-
cording to the lighting sources. There are four different il-
lumination conditions in AR database namely, interior light
(IL) where the subject is illuminated only by the interior
lights, left light (LL) where an additional light source on the
left is turned on, right light (RL) where an additional light
source on the right is turned on, and bidirectional light (BL)
where additional light sources on the left and on the right are
both turned on. Here, the following codes are assigned:
{0, 0}
for IL, {1, 0}for LL, {0,1}for RL, and {1, 1}for BL. Although
this intuitive encoding appears to give a clear representation
of external conditions, it causes problems which eventually
degrade the recognition performance. These problems are
enumerated as follows.
Firstly, the integer value encoding causes an overlap of
different bands which should have been separated. In other
words, there exist different bands which share the same code
distance. For example, the code distance between IL and LL
and that between LL and BL are both equal to 1, while the ac-
tual distributions of these two bands are quite different from
each other.
Secondly, this method cannot guarantee appropriate or-
dering of data distribution along the code distance axis.
Let us give an example using the illumination factor. Con-
sider a band where IL images and RL images are matched
within, and another band where IL images and BL images
are matched within (for convenience sake, we will call them
IL-RL band and IL-BL band, resp.). Since the BL (bidirec-
tionally illuminated) face images are more uniformly illumi-
nated than the RL faces images, the contrasting effect is less
severe for IL-BL than that for IL-RL. Consequently, the de-
sired threshold of the IL-BL band should be smaller than that
of the IL-RL band. However, the computed code distances
are
√
2(=[0 0]−[1 1])and1(=[0 0]−[0 1]), respec-
tively for IL-BL and IL-RL. This shows the ordering effect of
code distance with respect to amount of difference among
the conditional pairs.
Figure 3 illustrates this ordering problem with simplified
examples. Here, the genuine and the imposter matches are
plotted on coordinates according to their image distances
(e.g., PCA, ICA, or LFA output space) and code distances.
Unlike Figures 1 and 2, this figure shows only one face feature
with code distance for simplicity. From Figure 3(a), which il-
lustrates the match data distribution according to the intu-
itive code design, it follows that the trained separating hy-
perplane would be too curvy and the margin could be very
narrow due to the unordered distributions. For such case, it
would be difficult for SVM to converge to a separating hyper-
plane which generalizes well.
In order to circumvent the above problems, we assign
floating point numbers for code words and define a code dis-
tance axis for each of the modalities being fused to reflect
the distributions of corresponding data groups under con-
ditional variations. Here, we establish a principle of design-
ing code word in which the code distance varies according to
the mean of the distribution of corresponding genuine-user
matched distances of each modality from training data. Sat-
isfying this principle, we postulate that the coded data would
4 EURASIP Journal on Advances in Signal Processing
Code distance
Margin
Image distance
A
B
C
D
(a)
Code distance
Margin
Image distance
C
A
B
D
(b)
Figure 3: Variation of match distributions: the black and the grey circles denote the genuine and the imposter matches, respectively, and
the white circle denotes a new sample match. The grey line between the circles indicates an optimal separating hyperplane of SVM. (a)
Intuitive code design leads to a curvy optimal separating hyperplane and narrow margin. (b) Our final code design leads to an almost
straight hyperplane and wider magin.
then be distributed as illustrated in Figure 3(b), where we ob-
tain a nearly straight separating hyperplane and wide margin.
According to the above principle of code design based on
the mean of genuine-user distance distribution, the following
procedure is established to compute an ordered set of vertices
which reveals the intrarelationship among the step differ-
ences within each external factor (e.g., for the external factor
on illumination, those left, right, frontal, and bidirectional
illumination step differences should occupy vertices which
show connections among each other as seen in Figure 4).
(1) Order the conditions within the external factor from
1ton,wheren is the total number of the conditions
(e.g., illumination: 1. frontal, 2. left, 3. right, and 4.
bidirectional lighting).
(2) Find the entire combinatorial set of code distances
from the available face distances. Each of the code dis-
tances is computed based on the mean of genuine-user
face distances of corresponding band which matches
images from ith condition with images from jth con-
dition D
i,j
(0 ≤ i< j≤ n).
(3) Assign an n
− 1 dimensional zero vector to the first of
the ordered conditions as its code.
(4) Initialize the code of the next (say kth) condition as
C
k
= [c
1
k
c
2
k
···c
k−1
k
0 ···0]. Then calculate C
k
from
the solution of the following simultaneous equations:
C
1
−C
k
=
D
1,k
,
C
2
−C
k
=
D
2,k
,
.
.
.
C
k−1
−C
k
=
D
k−1,k
.
(1)
(5) Repeat procedure 4 until the nth condition.
We will walk through an example of encoding the PCA
feature based on the four conditions within the illumina-
tion factor (for fusion of multiple modalities, this proce-
dure should be repeated for those other modalities to be
fused with PCA in order to find their code words). From
the four kinds of known illumination conditions, the geo-
Left
(32.5, 0, 0)
Front
(0, 0, 0)
Right
(
−0.66, 38.7, 0)
Bidirection
(10.8, 22.5, 28.6)
Figure 4: An example code assignment for illumination.
metric relationship among the codes of illumination is the
shape of a tetrahedron as shown in Figure 4. The bits length
of the code word for illumination would be at least 3 since
the tetrahedron is of 3-dimensional shape. The only prereq-
uisite condition for the code word design is the distances
among code words for different conditions where these dis-
tances should reveal the relationships among the conditions.
In other words, we care only about the shape of the tetra-
hedron (lengths of its 6 edges) in Figure 4, and we do not
care about its absolute position or rotation in the three-
dimensional code word space.
Starting with IL (interior light), we assign a code word
C
IL
={0,0,0} for IL. Then we calculate the code distance
between the codes of IL and LL (left light), D
IL,LL
by taking
the average of face distances of genuine-user matchings when
the illumination conditions of their galleries are IL and those
of their probes are LL. Now, we can calculate the code of LL,
C
LL
={c
1
LL
, c
2
LL
, c
3
LL
}, using the equation (C
IL
−C
LL
)
2
=
(D
IL,LL
)
2
. Here, we arbitrarily initialize the code of LL as
C
LL
={c
1
LL
,0,0} wherein c
2
LL
and c
3
LL
aresettozerosbe-
cause C
LL
can be any point when the distance from C
IL
sat-
isfies D
IL,LL
. From our experimental data, D
IL,LL
is found to
be 32.5, and hence the resulting C
LL
is {32.5, 0, 0}.Inasim-
ilar manner, we can find the code for RL (right light) C
RL
using D
IL,RL
, D
LL,RL
, C
IL
,andC
LL
. Also, the code for BL (bidi-
rectional light) C
BL
can be calculated. This procedure can be
Sang-Ki Kim et al. 5
80
70
60
50
40
30
20
10
0
0 1020304050607080
(a)
80
70
60
50
40
30
20
10
0
0 1020304050607080
(b)
80
70
60
50
40
30
20
10
0
0 1020304050607080
(c)
80
70
60
50
40
30
20
10
0
0 1020304050607080
(d)
Figure 5: Face distance vector distribution comparing smiling faces with frowning faces under different illuminations. (x-axisisPCAoutput
space, y-axis is ICA output space.) The illumination conditions of probe and gallery are (a) interior light, (b) left light, (c) right light, and
(d) bidirectional lights.
summarized as solving the following second-order simulta-
neous equations:
(i) initialization: C
IL
={0, 0, 0} C
LL
={c
1
LL
,0,0} C
RL
=
{
c
1
RL
, c
2
RL
,0} C
BL
={c
1
BL
, c
2
BL
, c
3
BL
},
(ii) simultaneous code distance equations (six combina-
tions from the four conditions):
C
IL
−C
LL
2
=
D
IL,LL
2
,
C
IL
−C
RL
2
=
D
IL,RL
2
,
C
LL
−C
RL
2
=
D
LL,RL
2
,
C
IL
−C
BL
2
=
D
IL,BL
2
,
C
LL
−C
BL
2
=
D
LL,BL
2
,
C
RL
−C
BL
2
=
D
RL,BL
2
,
(2)
(iii) the resulting code words for illumination conditions
are shown in Figure 4.
Theoretically, when we design the code word by the above
method, we have to consider the entire set of all possible
combinations of conditions among the external factors of
the database. However, excessively long code words would
then be required and we have to solve complex simultane-
ous equations. Instead, we assume that each kind of external
factor affects the face distances independently. This assump-
tion is justifiable from our empirical observations as shown
in Figure 5. The four plots in Figure 5 show the distribution
of face distance vectors (in PCA and ICA output spaces) from
a comparison of images of smiling face with images of frown-
ing face. The difference among these plots is the illumination
condition of both probe and gallery images. The illumina-
tion condition for both the probe and the gallery is IL in
Figure 5(a),LLinFigure 5(b),RLinFigure 5(c), and BL in
Figure 5(d). Here we find that the distribution of face dis-
tances between images of two different expressions is quite
similar regardless of the illumination condition. Hence, we
can postulate that facial expressions and illuminations are
nearly independent in terms of their resultant matching ef-
fects. Based on this observation and assumption, we then
consider each external factor separately. For illumination, as
mentioned, since there are four kinds of illumination con-
ditions in our database, we assigned 3 digits. Our final code
Illumination Expression Sunglass Scarf
Il1 Il2 Il3
Exp1 Exp2 Exp3
Gls Scf
Code with eight elements
Figure 6: The organization of total eight code words.
design has 3 digits for expression, 1 digit for sunglasses, and
1 digit for scarf, all according to the available experimented
conditions from AR database. The total eight code words are
organized as shown in Figure 6. Finally, we consolidate the
code words for each factor and build a mapping table which
is filled with these code words.
2.1.3. Estimation of external factors
Thus far, we have discussed combining the face similarity
information and external factor information with the as-
sumption that we already know the external factors of each
image. However, in real-life applications, no prior knowl-
edge about the external factors is provided, and an estima-
tion of the external conditions is essential in order to imple-
ment this method. To estimate the external conditions, we
adopted the training-based approach. In [12], Huang et al.
reported excellent pose estimation result in their work and
this inspired us to estimate the external conditions by ex-
tending their SVM-based approach. An SVM (we called it
code-estimation-SVM which is differentiated from the clas-
sification or fusion-SVM for identity verification) is deployed
to learn and then estimate the external conditions for unseen
data.
The PCA feature was used as the main input of these
code-estimation-SVMs since it has high sensitivity to the ex-
ternal factors. As a result, the PCA feature will always be
used for code estimation, no matter what face representation
method is being encoded. As shown in Figure 7, the PCA co-
efficients of the face images were fed into the SVMs which
have been trained under different conditions. Four distinct
multiclass SVMs were trained to estimate the conditions of
each external factor from the AR database. Based on the esti-
mated information, we encoded the final external conditions
6 EURASIP Journal on Advances in Signal Processing
Table 1: Condition code mapping for each method.
Condition (symbol : label) PCA code ICA code LFA code
Illumination
Interior (IL : 1) (0, 0, 0) (0, 0, 0) (0, 0, 0)
Left (LL : 2) (32.5, 0, 0) (1.21, 0, 0) (0.72, 0, 0)
Right (RL : 3) (
−0.66, 38.7, 0) (0.21, 1.31, 0) (0.33, 0.67, 0)
Bidirection (BL : 4) (10.8, 22.5, 28.6) (0.55, 0.67, 0.98) (0.42, 0.36, 0.61)
Expression
Neutral (NE : 1) (0, 0, 0) (0, 0, 0) (0, 0, 0)
Smile (SE : 2) (26.3, 0, 0) (1.03, 0, 0) (0.67, 0, 0)
Anger (AE : 3) (2.89, 26.1, 0) (0.24, 1.13, 0) (0.16, 0.75, 0)
Scream (SE : 4) (12.8, 23.9, 24.3) (0.49, 0.89, 0.98) (0.31, 0.62, 0.65)
Sunglasses
Without (NG : 0) 0 0 0
With (WG :1) 41.1 16.3 1.39
Scarf
Without (NS : 0) 0 0 0
With (WS : 1) 51.1 15.1 1.92
PCA
projection
Condition
code
SVM
illumination
SVM
pose
SVM
expression
SVM
glasses
Code
mapping
Code estimation
Figure 7: The process of code estimation.
by mapping the code words from a code mapping table. Since
the code words provide information about distribution of the
face distances of a given modality, the code words of the map-
ping table should be obtained based on the face representa-
tion method which is being encoded. In other words, even
when the ICA face feature is combined with its code (coded-
ICA), the estimation-SVM still takes PCA coefficients as its
input, except that the code mapping table is determined by
ICA features (an example of the code mapping table is shown
in Ta ble 1).
2.2. Information fusion
With the main idea of the proposed method, in this section
we will specify the entire system flow. Two different scenarios
will be considered: the first is to combine different facial in-
formation of a single face feature (either PCA, ICA, or LFA)
with its corresponding code information; and the second is to
combine all information including the global (PCA), the lo-
cal (ICA or LFA), and their corresponding code information.
Through these two scenarios, we can empirically verify the
advantages of our system in terms of performance enhance-
ment in aspects of isolation of effects of external factors and
fusion efficiency. We will call the first a coded-feature (e.g.,
either coded-PCA, coded-ICA, and coded-LFA) and call the
second a coded-fusion system.
2.2.1. Coded-feature: combining face
data and condition codes
As described in the previous section, the information from
external factors estimation will be fused with the face infor-
mation using SVM (fusion-SVM). Given a probe image, its
environmental/conditional factors are first estimated and en-
coded by the estimation-SVM which takes the PCA coeffi-
cients of the image. The code distance is calculated by com-
paring the estimated code of the probe image with that of the
gallery image. The face distance is next computed in a similar
way by comparing the face templates from the probe and the
gallery. Eventually the feature vector, which consists of the
code distance and the face distance, is fed into the SVM clas-
sifier which decides whether the probe is a genuine-user or
an imposter. Figure 8(a) shows a system which combines the
code output distance and the original feature output distance
from, for example, the ICA feature.
2.2.2. Coded-fusion: fusion of coded global
and local face features
We will work on both the holistic (PCA) and part-based (ei-
ther ICA or LFA) feature extraction methods in this study.
Apart from the conditional code, both holistic and part-
based face features are important direct information for
identity discrimination. Thus, fusion of all these data will
widen the between-class variation at the higher dimensional
space.
Combining two face features with the codes is a rather
straightforward procedure. For each and every probe and
gallery match, we feed the face distances and the code dis-
tances into the fusion-SVM directly. Figure 8(b) shows an
entire system fusing PCA and ICA feature distances with esti-
mated conditional code distances. The output of the fusion-
SVM is a score indicating whether the matching belongs
to a genuine-user match or an imposter match. Certainly,
apart from combining PCA with ICA features, other fea-
tures such as LFA can also be incorporated into the system
in Figure 8(b) by replacing the position of ICA to extend the
recognition capability.
Sang-Ki Kim et al. 7
PCA
ICA
PCA
ICA
Probe
Gallery
Genuine
or
imposter?
ICA code
estimation
ICA code
estimation
SVM
+
−
+
−
(a)
PCA
ICA
PCA
ICA
Probe
Gallery
Genuine
or
imposter?
PCA code
estimation
PCA code
estimation
ICA code
estimation
ICA code
estimation
SVM
+
−
+
−
+
−
+
−
(b)
Figure 8: Diagram for (a) coded-ICA and (b) coded-fusion.
(1) (2) (3) (4) (5) (6) (7)
(8) (9) (10) (11) (12) (13)
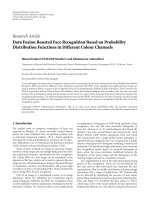
Figure 9: The conditions of AR database: (1) neutral, (2) smile, (3) anger, (4) scream, (5) left light on, (6) right light on, (7) both lights on,
(8) sunglasses, (9) sunglasses/left light, (10) sunglasses/right light, (11) scarf, (12) scarf/left light, (13) scarf/right light.
3. EXPERIMENTS
3.1. Data set: AR database
To evaluate the proposed method, we adopted a publicly
available database, the AR database from [11]. The AR
database contains 3315 images from 116 individuals. Each
person participated in two sessions (some of them only par-
ticipated in one session), which are separated by a two-week
time interval. For each session, 13 images were captured un-
der different states by varying illumination, facial expression,
and occlusion using sunglasses and scarf. Figure 9 shows a
sample set of 13 images from one session. The face of each
image was located manually by clicking a mouse at the cen-
ter of each eye. All images were normalized to 56
× 46 pixels
according to the eye centers, by rotating and subsampling.
Then, the images were histogram-equalized, and the pixels
were normalized to have zero mean and unit variations. The
training set and the test set are not composed to have any
common person, for example the training set consists of im-
ages of people whose ID number is odd and the test set con-
sists of the remaining images.
3.2. Experimental design
In this section, we explain the specifications regarding our
experiments. All the experiments were performed under the
identity verification scenario. Utilizing all images from the
AR database, the sizes of genuine-user and imposter popula-
tions generated for verification are, respectively, 20 124 and
1 363 492 for training and 20 046 and 1 342 029 for test. For
each face feature extraction method, we used different num-
ber of features which shows the best verification performance
(for PCA, 275 features were used; for ICA, 225 features were
used; and for LFA, 20 features were used). The receiver op-
erating characteristic (ROC) curve and the equal error rate
(EER) will be used to compare the performances.
3.2.1. Condition code estimation
Our first experiment is to observe the accuracy of condi-
tion code estimation. The code estimator is composed of two
parts: the first part is to estimate the external condition of an
input image (condition estimator), and the second part is to
map proper code words based on the estimated external con-
ditions (code mapping table). The condition estimator takes
the PCA features of the input image and then outputs a la-
bel indicating the external condition of the input. We first
labeled each of training images based on the ground truth of
external conditions. For example, image (9) of Figure 9 is la-
beled as 2-1-1-0 (illumination-expression-sunglasses-scarf)
which means that the subject is illuminated by left light, with
neutral expression, wearing sunglasses, and wearing no scarf.
Then, we trained the condition estimators using these labels
and PCA coefficients of the training set. A total of four SVMs
were trained to estimate illumination, pose, expression, and
glasses, respectively.
Unlike the condition estimators, the code mapping part
is determined based on the adopted face feature. This means
that for coded-ICA, the code words should be determined
based on means of ICA projected data. For coded-LFA,
the code words should be determined based on means of
LFA data, and for coded-PCA, the code words should be
8 EURASIP Journal on Advances in Signal Processing
(a) (b)
(c)
(d)
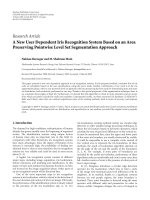
Figure 10: (a) Mean images; (b) leading PCA bases; (c) leading ICA bases; (d) leading LFA bases.
Table 2: Composition of AR database subsets for experiment 2.
Subset names Included image numbers of AR database
Illumination variation {1, 5, 6, 7}
Expression variation {1, 2, 3, 4}
Sunglasses variation {1, 8}
Scarf variation {1, 11}
determined based on means of PCA data. Figure 10 shows
the mean vector and leading basis images of each face repre-
sentation method. To summarize, using the projected data,
we obtain the face distances of all possible genuine-user
matches within each of the training set. Then, using the dis-
tribution of these face distances, we build the code mapping
table for each method following the procedure in section
2.2.1. The resulting code mapping table is shown in Tab le 1.
Putting the condition estimators and the code mapping
table together, we then complete the code estimation pro-
cess. The process of the code estimator for coded LFA, for
example, is as follows. Firstly, the PCA coefficients of a given
input image are fed into the condition estimators. Assume
that the estimated result is 4-1-0-1. Then the corresponding
code word for the external factor is picked:
{(0.42, 0.36,0.61)
(0,0,0) (1.39) (0)
}. Finally, these code words are concate-
nated in a code word
{0.42, 0.36, 0.61, 0.,0,0,1.39, 0} for the
given input image. With the estimated code word, the accu-
racy of code estimation is finally computed by comparing it
with the ground truth from the test set.
3.2.2. Fusion of single face feature with condition code
In the next experiment, we integrate our encoding scheme
to each face feature (individually for PCA, ICA, and LFA).
Our purpose is to validate whether the proposed method can
isolate the effects of external factors and to observe which
face feature can incorporate the encoding scheme more ef-
Table 3: Results of code estimation.
Condition Estimation accuracy (%)
Illumination 99.33
Expression 94.37
Sunglasses 100.00
Scarf 99.94
fectively. Using the projected feature data, we obtain the face
distances of all possible matches within each of the training
and the test set. Each of these distances is labeled as either
a “genuine-user” or an “imposter” according to the known
comparisons. Based on the ground truth of conditions from
the training data set, we encoded the external conditions us-
ing the codes from the code mapping table. Then, we calcu-
lated the code distances of the training data set in a similar
way to that we did for face distances.
Eventually, we have the face distances and the code dis-
tances computed for feeding into fusion-SVM for identity
verification. We trained the fusion-SVM using these face and
code distances obtained from the training data set. These
inputs for the SVM were in the form of two-dimensional
vectors and labeled as 0 or 1 according to whether they are
from the genuine or the imposter matching. For test, the code
words of the probe and the gallery are estimated by the code
estimator, and their code distance is fed into fusion-SVM
with corresponding face distance. Finally, the fusion-SVM
outputs a value predicting whether they are genuine match
(close to 0) or imposter match (close to 1).
3.2.3. Fusion of coded-PCA with part-based features
In this experiment, we test the proposed method for fusing
the holistic and the part-based methods (coded PCA+ICA
or coded PCA+LFA). Here we employ a similar code assign-
ment as described in the previous section. The fusion-SVM
Sang-Ki Kim et al. 9
1
0.9
0.8
0.7
0.6
0.5
0.4
0.3
0.2
Genuine accept rate
00.20.40.60.8
False accept rate
PCA
Coded-PCA
PCA
(a)
1
0.9
0.8
0.7
0.6
0.5
0.4
0.3
0.2
Genuine accept rate
00.20.40.60.8
False accept rate
ICA
Coded-ICA
ICA
(b)
LFA
1
0.9
0.8
0.7
0.6
0.5
0.4
0.3
0.2
Genuine accept rate
00.20.40.60.8
False accept rate
LFA
Coded-LFA
(c)
Figure 11: Test results of experiment 1 in ROC curves. The horizontal and the vertical axes indicate FAR (false accept rate) and GAR (genuine
accept rate), respectively: (a) PCA and coded-PCA, (b) ICA and coded-ICA, (c) LFA and coded-LFA.
Table 4: Results of experiments.
Experiment Methods EER (%)
Coded-feature
PCA 32.76
Coded-PCA 26.45
ICA 29.48
Coded-ICA 25.50
LFA 27.62
Coded-LFA 26.84
Coded-fusion
PCA+ICA 28.83
Coded-PCA+ICA 24.94
PCA+LFA 26.14
Coded-PCA+LFA 21.25
takes the face distances and the code distances of each of
both methods being fused as inputs in the form of a four-
dimensional feature vector. For performance comparison
purpose, we performed an additional experiment on simple
fusion without inclusion of conditional codes.
Several subsets of test data as well as an entire one were
experimented, in order to compare the performance of pro-
posed method with that of PCA [1], ICA [3], and LFA [4]
under variations of different external factors. The subsets are
composed so that only one kind of external factor is varied
within each subset. Those images which are included in each
subset are tabulated in Tab le 2 , and the labels of images are
indicated in Figure 9.
3.3. Results
Condition code estimation
Ta ble 3 shows the accuracy of code estimation using PCA co-
efficients test data. The estimation accuracy is the percentage
of correctly estimated external condition with respect to the
ground truth for the entire test set. It is seen here that for all
external factors, the estimation rates are quite high. This re-
sult shows that the PCA coefficients contain rich information
of external factors which can be useful for identity discrimi-
nation.
Fusion of condition code with single face feature
The resulting verification performances of the coded-feature
experiments are shown in the form of ROC curves in
Figure 11, and the corresponding EERs are shown in Tabl e 4 .
Here we see that by applying the proposed method, we could
improve the verification performances of all three face rep-
resentations from the original PCA [1], ICA [3], and LFA
[4]. These results show that the proposed method success-
fully isolates the effects of external factors. Particularly, the
best improvement margin has been achieved using PCA fea-
tures. On the other hand, there is only 1% of performance
improvement from coded-LFA over LFA. This shows that
PCA contains much information on external factors in ad-
dition to those identity discriminative features.
Fusion of coded-PCA with part-based features
The results from the final set of experiments are shown in
Figure 12 and Tab le 5. Here, we achieved respectively 3.89%
and 4.89% of performance improvements using coded-
PCA+ICA and coded-PCA+LFA with respect to their corre-
sponding simple-fusion. These results are seen to be higher
than any of those singly coded-PCA, -ICA, and –LFA, hence
suggesting the efficiency of our method for multiple fea-
tures fusion. The experimental results on data subsets are
also shown in Ta bl e 5. Among PCA, ICA, and LFA, the best
method for each subset is different, but coded-PCA+ICA and
coded-PCA+LFA outperform others for every external fac-
tor variation. These results reflect the adaptation of coded-
method to various external conditions.
From Ta bl e 5, we can see that both PCA [1]andICA
[3] by themselves are severely weak for scarf variation. How-
ever, with coded-PCA+ICA, the situation improves signifi-
cantly in this scenario of scarf variation. As for sunglasses
10 EURASIP Journal on Advances in Signal Processing
1
0.9
0.8
0.7
0.6
0.5
0.4
0.3
0.2
Genuine accept rate
00.20.40.60.8
False accept rate
PCA
ICA
Coded-PCA + ICA
(a)
1
0.9
0.8
0.7
0.6
0.5
0.4
0.3
0.2
Genuine accept rate
00.20.40.60.8
False accept rate
PCA
LFA
Coded-PCA + LFA
(b)
Figure 12: Test results of experiment 2 in ROC curves: (a) PCA, ICA, and coded-PCA+ICA, (b) PCA, LFA, and coded-PCA+LFA.
Table 5: Results of experiment on subsets of AR database in terms of EER.
Method Total
Data subset
Illumination variation Expression variation Sunglasses variation Scarf variation
Coded-(PCA+ICA) 24.94 13.02 12.00 17.26 29.24
Coded-(PCA+LFA) 21.25 11.32 12.29 16.43 21.32
PCA [1] 32.76 21.45 12.67 21.40 42.38
ICA [3] 29.48 15.82 14.68 20.30 39.58
LFA [4] 27.62 16.40 20.76 29.01 25.88
and other variations, the coded-PCA+ICA show consistent
improvements over the relatively good verification perfor-
mances. When comparing coded-PCA+LFA with the origi-
nal LFA [4], similar improvements are seen for all external
factor variations. These results support our claim that the
proposed method isolates the effect of external factors.
4. CONCLUSION
In this paper, we proposed a code-based method which iso-
lates the effects of external conditions from the feature data
for effective identity verification. Main attention was paid
to a robust classification scheme under considerable vari-
ation of environmental conditions. With deliberate design
of a conditional code scheme, the code information was
shown to aid the SVM to improve the verification perfor-
mance than one without the code. Our empirical results
show that the conditional code significantly contributes to
SVM classification under a wide range of varying external
conditions.
One major technical contribution of this paper is the in-
troduction of a novel approach to deal with data variation in
pattern recognition. In this application on face verification,
we attempted to quantify the original cause of data variation
and included these quantitative values for robust verification.
ACKNOWLEDGMENTS
This work was supported by the Korea Science and Engineer-
ing Foundation (KOSEF) through the Biometrics Engineer-
ing Research Center (BERC) at Yonsei University.
REFERENCES
[1] M. Turk and A. Pentland, “Eigenfaces for recognition,” Journal
of Cognitive Neuroscience, vol. 3, no. 1, pp. 71–86, 1991.
[2] W. Zhao, R. Chellappa, and A. Krishnaswamy, “Discriminant
analysis of principal components for face recognition,” in Pro-
ceedings of the 3rd International Conference on Automatic Face
and Gesture Recognition (AFGR ’98), pp. 336–341, Nara, Japan,
April 1998.
[3] M. S. Bartlett, J. R. Movellan, and T. J. Sejnowski, “Face recog-
nition by independent component analysis,” IEEE Transactions
on Neural Networks, vol. 13, no. 6, pp. 1450–1464, 2002.
[4]P.S.PenevandJ.J.Atick,“Localfeatureanalysis:ageneral
statistical theory for object representation,” Network: Compu-
tation in Neural Systems, vol. 7, no. 3, pp. 477–500, 1996.
[5] W. Zhao, R. Chellappa, P. J. Phillips, and A. Rosenfeld, “Face
recognition: a literature survey,” ACM Computing Surveys,
vol. 35, no. 4, pp. 399–458, 2003.
[6] S. Z. Li and A. K. Jain, Eds., Handbook of Face Recognition,
Springer, New York, NY, USA, 2004.
Sang-Ki Kim et al. 11
[7] R. Gross, S. Baker, I. Matthews, and T. Kanade, “Face recogni-
tion across pose and illumination,” in Handbook of Face Recog-
nition, S. Z. Li and A. K. Jain, Eds., pp. 193–216, Springer, New
York, NY, USA, 2004.
[8] J. Lu, K. N. Plataniotis, and A. N. Venetsanopoulos, “Face
recognition using kernel direct discriminant analysis algo-
rithms,” IEEE Transactions on Neural Networks, vol. 14, no. 1,
pp. 117–126, 2003.
[9] B. Bruce, Recognizing Faces, Lawrence Erlbaum Associates,
London, UK, 1998.
[10] J. Kittler and F. M. Alkoot, “Sum versus vote fusion in multiple
classifier systems,” IEEE Transactions on Pattern Analysis and
Machine Intelligence, vol. 25, no. 1, pp. 110–115, 2003.
[11] A. R. Mart
´
ınez and R. Benavente, “The AR face database,”
Tech. Rep. 24, Computer Vision Center (CVC), Barcelona,
Spain, June 1998.
[12] J. Huang, X. Shao, and H. Wechsler, “Face pose discrimina-
tion using support vector machines (SVM),” in Proceedings
of the 14th International Conference on Pattern Recognition
(ICPR ’98), vol. 1, pp. 154–156, Brisbane, Australia, August
1998.