Báo cáo hóa học: " Research Article Splitting the BLOSUM Score into Numbers of Biological Significance" ppt
Bạn đang xem bản rút gọn của tài liệu. Xem và tải ngay bản đầy đủ của tài liệu tại đây (701.3 KB, 18 trang )
Hindawi Publishing Corporation
EURASIP Journal on Bioinformatics and Systems Biology
Volume 2007, Article ID 31450, 18 pages
doi:10.1155/2007/31450
Research Article
Splitting the BLOSUM Score into Numbers of
Biological Significance
Francesco Fabris,
1, 2
Andrea Sgarro,
1, 2
and Alessandro Tossi
3
1
Dipartimento di Matematica e Informatica, Universit
`
a degli Studi di Trieste, via Valerio 12b, 34127 Trieste, Italy
2
Centro di Biomedicina Molecolare, AREA Science Park, Strada Statale 14, Basovizza, 34012 Trieste, Italy
3
Dipartimento di Biochimica, Biofisica, e Chimica delle Macromolecole, Universit
`
a degli Studi di Trieste,
via Licio Giorgieri 1, 34127 Trieste, Italy
Received 2 October 2006; Accepted 30 March 2007
Recommended by Juho Rousu
Mathematical tools developed in the context of Shannon information theory were used to analyze the meaning of the BLOSUM
score, which was split into three components termed as the BLOSUM spectrum (or BLOSpectrum). These relate respectively to the
sequence convergence (the stochastic similarity of the two protein sequences), to the background frequency divergence (typicality
of the amino acid probability distribution in each sequence), and to the target frequency divergence (compliance of the amino acid
variations between the two sequences to the protein model implicit in the BLOCKS database). This treatment sharpens the pro-
tein sequence comparison, providing a rationale for the biological significance of the obtained score, and helps to identify weakly
related sequences. Moreover, the BLOSpectrum can guide the choice of the most appropriate scoring matrix, tailoring it to the
evolutionary divergence associated with the two sequences, or indicate if a compositionally adjusted matrix could perform better.
Copyright © 2007 Francesco Fabris et al. This is an open access article distributed under the Creative Commons Attribution
License, which permits unrestricted use, distribution, and reproduction in any medium, provided the original work is properly
cited.
1. INTRODUCTION
Substitution matrices have been in use since the introduc-
tion of the Needleman and Wunsch algorithm [1], and are
referred to, either implicitly or explicitly, in several other pa-
pers from the seventies, McLachlan [2], Sankoff [3], Sellers
[4], Waterman et al. [5], Dayhoff et al. [6]. These are the
conceptual tools at the basis of several methods for attribut-
ing a similarity score to two aligned protein sequences. Any
amino acid substitution matrix, which is a 20
∗ 20 table, has
a scoring method that is implicitly associated with a set of
target frequencies p(i, j)[7, 8], pertaining to the pair i, j of
amino acids that are paired in the alignment. An important
approach to obtaining the score associated with the paired
amino acids i, j, was that suggested by Dayhoff et al. [6],
who developed a stochastic model of protein evolution called
PAM (points of accepted mutations). In this model, the fre-
quencies m(i, j) indicate the probability of change from one
amino acid i to another amino acid j, in homologous protein
sequences with at least 85% identity, during short-term evo-
lution. The matrix M, relating each amino acid to each of the
other 19, w ith an evolutionary distance of 1, would have en-
tries m(i, j) close to 1 on the main diagonal (i
= j)andclose
to 0 out of the main diagonal (i
= j). An M
k
matrix, which
estimates the expec ted probability of changes at a distance of
k evolutionary units, is then obtained by multiplying the M
matrix by itself k times. Each M
k
matrix is then associated to
the scoring matrix PAM
k
, whose entries are obtained on the
basis of the log ratio
s(i, j)
= log
m
k
(i, j)
p(i)p( j)
,(1)
where p(i)andp( j) are the observed frequencies of the ami-
no acids.
S. Henikoff and J. G. Henikoff introduce the BLOck SUb-
stitution Matrix (BLOSUM) [9]. While the scoring method
is always based on a log odds ratio, as seems natural in any
kind of substitution matrices [7], the method for deriving
the target frequencies is quite different from PAM; one needs
evaluating the joint target frequencies p(i, j) of finding the
amino acids i and j paired in alignments among homologous
proteins with a controlled rate of percent identity. This joint
probability is compared w ith p(i)p( j), the product of the
background frequencies of amino acids i and j,derivedfrom
amino acids probability distribution P
={p
1
, p
2
, , p
20
}.
2 EURASIP Journal on Bioinformatics and Systems Biology
The target and background frequencies are tied by the equal-
ity p(i)
=
20
j
=1
p(i, j) so that the background probability
distribution is the marginal of the joint target frequencies
[10]. The product p(i)p(j) reflects the likelihood of the in-
dependence setting, namely that the amino acids i and j are
paired by pure chance. If p(i, j) >p(i)p(j), then the presence
of i stochastically induces the presence of j,andviceversa(i
and j are “attractive”), while if p(i, j) <p(i)p(j), then the
presence of i stochastically prevents the presence of j,and
vice versa (i and j are “repulsive”). The log ratio (taken to
the base 2)
s(i, j)
= log
p(i, j)
p(i)p( j)
(2)
furnishes the score associated with the pair of amino acids i,
j, when these are found in a cer tain position h of an assigned
protein alignment; it is positive when p(i, j) >p(i)p(j),
and negative when the opposite occurs. The i, j entry of
the BLOSUM matrix is the score of the pair i, j (or j, i,
which is the same since the sequences are not ordered; for
adifferent approach see Yu e t al. [11]) multiplied by a suit-
able scale factor (4 for BLOSUM-35 and BLOSUM-40, 3 for
BLOSUM-50, and 2 for the remaining). The value so ob-
tained is then rounded to the nearest integer, and the (un-
scaled) global score of two sequences X
= x
1
,x
2
, , x
n
and
Y
= y
1
, y
2
, , y
n
of length n is given by summing up the
scores relative to each position
S(X,Y)
=
n
h=1
s
x
h
, y
h
=
i, j
n(i, j)log
p(i, j)
p(i)p( j)
,(3)
where n(i, j) is the number of occurrences of the pair i, j in-
side the aligned sequences. This equation weighs the log ratio
associated to the i, j entry of the BLOSUM matrix with the
occurrences of the pair i, j, and seems intuitive following a
heuristic approach, as any reasonable substitution matrix is
implicitly of this form [7]. In order to compute the neces-
sary target and background frequencies p(i, j)andp(i)p(j),
S. Henikoff andJ.G.Henikoff used the database BLOCKS
( which contains sets of
proteins with a controlled maximum rate of percent identity
“θ” that defines the BLOSUM matrix, so that BLOSUM-62
refers θ
= 62%, and so forth.
Scoring substitution matrices, such as PAM or BLOSUM,
are used in modern web tools (BLAST, PSI-BLAST, and oth-
ers) for performing database searches; the search is accom-
plished by finding all sequences that, when compared to a
given query sequence, sum up a score over a certain thresh-
old. The aim is usually that of discovering biological correla-
tion among different sequences, often belonging to different
organisms, which may be associated with a similar biolog-
ical function. In most cases, this correlation is quite evident
when proteins are associated with genes that have duplicated,
or organisms that have diverged from one another relatively
recently, and leads to high values of the BLOSUM (or PAM)
score. But in some cases, a relevant biological correlation may
be obscured by phenomena that reduce the score, making
it difficult to capture. Those that limit the efficiency of the
scoring method in finding concealed or weakly correlated se-
quences are well documented in the literature, the most rele-
vant being:
(1) Gaps: insertions or deletions (of one or more residue)
in one or both the aligned sequence cause loss of syn-
chronization, significantly decreasing the score;
(2) Bad θ: using a BLOSUM-θ matrix tailored for a partic-
ular evolutionary distance on sequences with a differ-
ent evolutionary distance leads to a misleading score
[7, 12, 13];
(3) divergence in background distribution: standard substi-
tution matrices, such as BLOSUM-θ, are truly appro-
priate only for comparison of proteins with standard
background frequency distributions of amino acids
[11].
We have set out to inspect, in more depth and by use of
mathematical tools, what the BLOSUM score really measures
from a biological point of view; the aim was to split the score
into components, the BLOSpecrum, that provide insight on
the above described phenomena and other biological infor-
mation regarding the compared sequences, once the align-
ment has been made using the classical methods (BLAST,
FASTA, etc.). We do not propose an alternative alignment al-
gorithm or a method for increasing the performance of the
available ones; nor do we suggest new methods for inserting
gaps so as to maximize the score (see, e.g ., [14, 15]). Ours is
simply a diagnostic tool to reveal the following:
(1) if, for an available algorithm, the chosen scoring ma-
trix is correct;
(2) whether the aligned sequences are typical protein se-
quences or not;
(3) whether the alignment itself is typical with respect to
BLOCKS database; and
(4) the possible presence of a weak or concealed correla-
tion also for alignments resulting in a relatively low
BLOSUM score, that mig ht otherw ise be neglected.
The method is associated with the use of a BLOSUM
matrix that has been developed within the context of local
(ungapped) alignment statistics [7, 8, 11]. To allow a crit-
ical evaluation of our method, we furnish an online soft-
ware package that provides values for each component of
the BLOSpecrum for two alig ned sequences (http://bioinf.
dimi.uniud.it/software/software/blosumapplet). Providing a
rationale about the biological significance of an obtained
score sharpens the comparison of weakly related sequences,
and can reveal that comparable scores actually conceal com-
pletely different biological relationships. Furthermore, our
decomposition helps in selecting the matrix that is correctly
tailored for the actual evolutionary divergence associated to
the two sequences one is going to compare, or in deciding if
a compositionally adjusted matrix might not perform better.
Although we have used the BLOSUM scoring method for
our analyses, since it is the most widely used by web tools
measuring protein similarities, our decomposition is appli-
cable, in principle, to any scoring matrix in the form of (3),
Francesco Fabris et a l. 3
and confirms that the usefulness of this type of matrix has a
solid mathematical justification.
2. METHODS
2.1. Mathematical analysis of the BLOSUM score
The BLOSUM score (3) can be analyzed from a mathematical
perspective using well-known tools developed by Shannon
in his seminal paper that laid the foundation for Information
Theory [16, 17]. The first of these is the Mutual Information
I(X, Y )(orrelative entropy) between two random variables
X and Y ,
I(X, Y )
=
i, j
p(i, j)log
p(i, j)
p(i)p( j)
,(4)
where p(i, j), p(i), p(j) are, respectively, the joint proba-
bility distribution and the marginals associated to the ran-
dom variables X and Y. We can adapt (4) to the compar-
ison of two sequences if we interpret p(i, j) as the relative
frequency of finding amino acids i and j paired in the X
and Y sequences, and p(i)(p(j)) of finding amino acid i
( j)insequenceX (Y). Following this approach, in a bio-
logical setting, mutual information (MI) becomes a measure
of the stochastic correlation between two sequences. It can be
shown (see the appendix) that I(X,Y)
≤ log 20 ≈ 4.3219.
The second tool is the informational divergence D(P//Q)be-
tween two probability distributions P
={p
1
, p
2
, , p
K
} and
Q
={q
1
, q
2
, , q
K
} [18], where
D(P//Q)
=
K
i=1
p(i)log
p(i)
q(i)
. (5)
The informational divergence (ID) can be interpreted as
a measure of the nonsymmetrical “distance” between two
probability distributions. A more detailed mathematical
treatment of the properties associated with MI and ID is pro-
vided in the appendix. Here, we simply indicate that ID and
MI are nonnegative quantities, and that they are tied by the
formula
I(X, Y )
=
i, j
p(i, j)log
p(i, j)
p(i)p( j)
= D
P
XY
//P
X
P
Y
≥
0,
(6)
so that MI is really a special kind of ID, that measures the
“distance” between the joint probability distributions P
XY
and the product P
X
P
Y
of the two marginals P
X
and P
Y
.
Given two amino acid sequences, X and Y , the corre-
sponding BLOSUM (unscaled) nor malized score S
N
(X,Y),
measured in bits,iscomputedas
S
N
(X,Y) =
1
n
n
h=1
s
x
h
, y
h
=
i, j
f (i, j)log
p(i, j)
p(i)p( j)
,(7)
where f (i, j)
= n(i, j)/n is the relative frequency of the pair
i, j observed on the aligned sequences X and Y.Because
one usually deals with sequences that could have remarkably
different lengths, we report the normalized perresidue score
to permit a coherent comparison. It is important to stress the
fact that while f (i, j) is the observed frequency pertaining to
the sequences under inspection, the target frequencies p(i, j),
together with the background marginals p(i)andp(j), per-
tain to the database BLOCKS. In a sense, they constitute “the
model” of the typical behaviour of a protein, since p(i)or
p( j) is in f act the “typical” probability distribution of amino
acids as observed in most proteins, while p(i, j) is the “typi-
cal” probability of finding the amino acids i and j position-
ally paired in two protein sequences with a p ercent identity
depending from θ. From an evolutionary point of view, we
can say that if p(i, j) is greater than in the case of indepen-
dence, then it is very likely that i and j are biologically corre-
lated.
Equation (7) is in fact quite similar to (4), which spec-
ifies mutual information, the only difference being the use
of f (i, j) instead of p(i, j) as the multiplying factor for the
logarithmic term, so that the normalized score is a kind of
“mixed” mutual information. As a matter of fact, we can de-
fine
I(A, B)
=
i, j
p(i, j)log
p(i, j)
p(i)p( j)
(8)
as the mutual infor mation, or relative entropy, of the tar-
get and background frequencies associated to the database
BLOCKS, or to any other protein model used to find the tar-
get frequencies. Here A,andB are dummy random variables
taken to have generated the data of the database. The quan-
tity I(A, B)wasineffect used by Altschul in the case of PAM
matrices [7], and by S. Henikoff andJ.G.Henikoff [9] for the
BLOSUM matrices, and in both cases it can be interpreted as
the average exchange of information associated with a pair
of aligned amino acids of the data bank, or as the expected
average score associated to pairs of amino acids, when they
are put into correspondence in alignments that adhere to
the protein model over which the matrices are computed.
From the perspective of an aligning method, we can state that
I(A, B) measures the av erage information available for each
position in order to distinguish the alignment from chance,
so that the higher its value, the shorter the fragments whose
alignment can be distinguished from chance [7]. Equation
(6)(or(A.4) in the appendix) ensures also that this average
score is always greater than or equal to zero.
On the other hand, if we compute the expected score
when two amino acids i and j are picked at random in an
independence setting model, given as
E(A, B)
=
i, j
p(i)p( j)log
p(i, j)
p(i)p( j)
=−D
P
X
P
Y
//P
XY
) ≤ 0,
(9)
the classical assumptions made in constructing a scoring ma-
trix [7] require that this expected score is lower than or equal
to zero. Note that all these quantities pertain to the database
BLOCKS (in the case of BLOSUM), that is to the particular
“protein model” used.
4 EURASIP Journal on Bioinformatics and Systems Biology
To solely evaluate the stochastic similarity between two
sequences X and Y , the identity
I(X, Y )
=
i, j
f (i, j)log
f (i, j)
f
X
(i) f
Y
( j)
, (10)
which measures the degree of stochastic dependence between
the protein sequences, would suffice (here f
X
(i) = n(i)/n and
f
Y
( j) = n( j)/n are the relative frequencies of amino acid i
observed in sequence X and amino acid j observed in se-
quence Y). But this is not so interesting from the biological
point of view, as one has to take into account the possibil-
ity that, even if similar from the stochastic point of view, two
sequences are far from being an example of a typical protein-
to-protein matching (or evolutionary transition). In other
words, we need to inspect this stochastic similarity under the
“lens” of the protein model used in the BLOCKS database (or
by the PAM model, for the matter).
Subjecting the (unscaled) normalized score S
N
(X,Y)of
(7) to simple mathematical manipulations (see the appendix
for details), we can split S
N
(X,Y) into the fol l owing terms:
S
N
(X,Y) = I(X, Y ) − D
F
XY
//P
AB
+ D
F
X
//P
A
+ D
F
Y
//P
B
.
(11)
Here, F
XY
is the joint frequency distribution of the amino
acids pairs in the sequences, (observed target frequencies),
while F
X
and F
Y
are, respectively, the distribution of the
amino acids inside X and Y (observed background frequen-
cies). P
AB
instead is the joint probability distribution asso-
ciated to the BLOCKS database, and is the vector of target
frequencies. Note also that P
A
= P
B
= P are the probabil-
ity distributions of the amino acids inside the same database
BLOCKS, that is the database background frequencies; they
are equal as a consequence of the symmetry of the BLO-
SUM matrix entries, since p(i, j)
= p( j, i). We define the set
{I(X, Y ), D(F
XY
//P
AB
), D(F
X
//P), D(F
Y
//P)} to be the BLO-
SUM spectrum of the aligned sequences (or BLOSpectrum).
Notice that (11) holds also when the BLOSUM matrix is de-
compositionally adjusted following the approach descr ibed
in Yu et al. [11], that is when the background frequencies are
different (P
A
= P
B
).
The terms constituting the BLOSpectrum have a differ-
ent order of magnitude, as D(F
X
//P)andD(F
Y
//P)actwith
a cardinality of 20, when compared to the joint divergences
I(X, Y )andD(F
XY
//P
AB
), that act on probability distribu-
tions whose cardinality is 20
∗ 20 = 400. From a practical
point of view, this means that the contribution of I(X, Y)
and D(F
XY
//P
AB
) to the score is expected to be roughly
double than that of D(F
X
//P)andD(F
Y
//P). Actually, un-
der the hypothesis of a Bernoullian process (i.e., station-
ary and memoryless), we have D(P
2
//Q
2
) = 2D(P//Q)[18]
(as in our case 20
2
= 400), and the sum of the two terms
D(F
X
//P)+D(F
Y
//P) compensates the order of magnitude
of the joint divergences.
Finally, it should be recalled that the score actually ob-
tained by using the BLOSUM matrices, whose entries are
multiplied by the constant c and rounded to the nearest inte-
ger, is an approximation of the exact score S
N
(X,Y)of(11),
once it has been scaled. The difference is usually quite small
(about 2-3% if the score is high), but it becomes more and
more significant as the score approaches zero.
2.2. Taking gaps into account
An important consideration regarding our mathematical
analysis is that it does not formally take gaps into account.
From a mathematical perspective, the only way to account
correctly for gaps would be to use a 21
∗21 scoring matrix, in
which the gap is treated as equivalent to a 21st amino acid, so
that pairs of the form (i,
−)or(−, j), where the symbol “−”
represents the gap, are also contemplated; but from a biologi-
cal perspective this might not be acceptable, since a gap is not
a real component of a sequence. We can nevertheless extend
our analysis to a gapped score if we admit the independence
between each gap and any residue paired with it. Biologically,
independence may be questionable, and would need to be
determined case by case, as each g ap is due to a chance dele-
tion or insertion event subsequently acted on by natural se-
lection (which may be neutral or positive). Moreover, there
is no certainty as to the correct positioning of a gap in any
given alignment, as it is introduced a posteriori as the prod-
uct of an alignment algorithm that takes the two sequences
X and Y, and tries to minimize (by an exact procedure, or
by a heuristic approach) the number of changes, insertions
or deletions that allow to transform X into Y (or vice versa).
In practice, we consider quite reasonable the idea that gaps
in a given position should imply a degree of independence as
to which amino acids might occur there in related proteins;
this is accepted also in PSI-BLAST [19]. The consequence of
assuming independence is that p(
−, j) = p(−)p(j)leadstoa
null contribution of the corresponding score, since s(
−, j) =
log[p(−, j)/p(−)p(j)] = 0(see(3)), so that for gapped se-
quences, we simply assign a score equal to zero whenever an
amino acid is paired with a gap. Note that this does not mean
that we reduce a gapped alignment to an ungapp ed one, but
that we simply ignore the gap and the corresponding residue,
since the pair is not affecting the BLOSpectrum,duetoits
zero contribution to the score. Moreover, it is conceivable
that for distant sequence correlations, the use of different al-
gorithms, or of different gap penalties schemes for any given
algorithm, could result in a different pattern of gaps and con-
sequently in different sequence alignments, each with a cor-
responding BLOSpectrum. In this case, the likelihood of each
alignment might be tested by exploiting the BLOSpectrum,
that might be quite different even if the numerical scores have
approximately the same value; this can help identify the most
appropriate one.
3. RESULTS AND DISCUSSION
3.1. Meaning and biological implications of the
BLOSpectrum terms
Let us now analyze the meaning of the terms in (11).
(i) The mutual information I(X, Y ) is the sequence con-
vergence, which measures the degree of stochastic de-
pendence (or stochastic correlation) between aligned
Francesco Fabris et a l. 5
sequences X and Y ; the greater its value, the more sta-
tistically correlated are the two. It is highly correlated
with, but not identical to, the percent identity of the
alignment, as it also includes the propensity of finding
certain amino acids paired, even if different.
This term enhances the overall BLOSUM score, since
it is taken with the plus sign.
(ii) The target frequency divergence D(F
XY
//P
AB
)measures
the difference between the “observed” target frequen-
cies, and the target frequencies implicit in the substi-
tution matrix. In mathematical terms, it measures the
stochastic distance between F
XY
and P
AB
, that is the
distance between the mode in which amino acids are
paired in the X and Y sequences and inside the “pro-
tein model” implicit in the BLOCKS database. When
the vector of observed frequencies F
XY
is “far” from
the vector of target frequencies P
AB
exhibited by the
protein model, then the divergence is high, so that
starting from X we obtain an Y (or vice versa) that
is not that we would expect on the basis of the target
frequencies of the database; in other words, the amino
acids are paired fol low ing relative frequencies that are
not the standard ones.
The term D(F
XY
//P
AB
)isapenaltyfactorin(11), since
it is taken with the minus sign.
(iii) The background frequency divergence D(F
X
//P
A
)(or
D(F
Y
//P
B
)) of the sequence X (or Y) measures the dif-
ference between the “observed” background frequen-
cies, and the background frequencies implicit in the
substitution matrix. In mathematical terms, it mea-
sures the stochastic distance between the observed fre-
quencies F
X
(or F
Y
) and the vector P = P
A
= P
B
of
background frequencies of the amino acids inside the
database BLOCKS. The greater is its value, the more
different are the observed frequencies from the back-
ground frequencies exhibited by a typical protein se-
quence.
This term enhances the score, since it is taken with the
plus sign.
Note that the quantities that constitute the decomposition of
the BLOSUM score are not independent of one another. For
example, D(F
XY
//P
AB
) ≈ 0 implies low values for D(F//P)
also. This is because when F
XY
→ P
AB
(or D(F
XY
//P
AB
) → 0;
see the appendix), then also the observed marginals F
X
and
F
Y
are forced to approach the background marginal, that
is F
X
→ P and F
Y
→ P, which implies D(F//P) → 0.
This is a consequence of the tie between a joint probabil-
ity distribution and its marginals [10]. For the same reason,
if D(F//P)
0, then D(F
XY
//P
AB
) will also be large, al-
though the opposite is not necessarily the case. This leads
to (at least partially) a compensation of the effects, due to
the minus sign of the target frequency divergence, so that
−D(F
XY
//P
AB
)+D(F
X
//P
A
)+D(F
Y
//P
B
)hasasmallvalue.
This implies that a significant BLOSUM score can be ob-
tained only when the aligned sequences are statistically cor-
related, that is, when I(X, Y) has a high value. Since when
performing an alignment we are mainly interested in posi-
tive or almost positive global scores, it is a str a ightforward
consequence that only alignment characterized by remark-
able values of I(X, Y)willemerge.
There are therefore essentially three cases of biological in-
terest, which we can now analyze in terms of the correspon-
dence b etween mathematical and biological meaning of the
terms.
Case 1. The joint observed frequencies F
XY
are typical,
1
that
is, they are very close to the target frequencies, F
XY
≈ P
AB
.
In this case, D(F
XY
//P
AB
) ≈ 0 and also D(F//P) ≈ 0.
Case 2. The joint observed frequencies F
XY
are not typical
(F
XY
= P
AB
), but the marginals are typical (F
X
≈ P, F
Y
≈ P).
In this case, D(F
XY
//P
AB
) 0, but D(F//P) ≈ 0.
Case 3. Both the joint observed F
XY
and the marginals F
X
,
F
Y
are not ty pical, that is F
XY
= P
AB
, F
X
= P, F
Y
= P.
In this case, D(F
XY
//P
AB
) 0, but also D(F//P) 0.
Case 1 is straightforward; two similar protein sequences
with a typical background amino acid distribution; and
amino acids paired in a way that complies with the protein
model implicit in BLOCKS result in a high score. This is
frequently the case for two firmly correlated sequences, be-
longing to the same family of proteins with standard amino
acid content, associated with organisms that diverged only
recently.
Case 2 is rather more interesting; the amino acid dis-
tribution is close to the background distribution (these are
“typical” protein sequences) but the score is highly penalized
as the observed joint frequencies are different from the tar-
get frequencies implicit in the BLOCKS database. This can
have different causes. For example, the chosen BLOSUM ma-
trix may be incorrectly matched to the evolutionary distance
of the sequences, or the sequences may have diverged under
a nonstandard evolutionary process. For high-scoring align-
ments involving unrelated s equences, the target frequency di-
vergence D(F
XY
//P
AB
) will tend to be low, due to the second
theorem of Karlin and Altschul [8], when the target frequen-
cies associated to the scoring matrix in use are the correct
ones for the aligned sequences being analyzed.
2
This is be-
cause any set of target frequencies in any particular amino
acid substitution matrix, such as BLOSUM-θ, is tailored to
a particular degree of evolutionary divergence between the
sequences, generally measured by relative entropy (8)[7],
and related with the controlled maximum rate θ of per-
cent identity. So a low D(F
XY
//P
AB
) ≈ 0 is evidence that
the BLOSUM-θ matrix we are using is the correct one, as a
precise consequence of a mathematical theorem, while con-
versely for positive (or almost positive) scoring alignments
with large target frequency divergence, the sequences may be
1
Recall that the concept of “typicality” always refers to the adherence of the
various probability distributions to that of the protein model associated
to the database BLOCKS.
2
Note that in general, choosing the (θ parameter associated with the)
smallest D(F
XY
//P
AB
)isdifferent from choosing the minimum E-value
associated with different θ parameters. Recall that E
= m ∗ n2
−S
,whereS
is the score and m and n are the sequences lengths.
6 EURASIP Journal on Bioinformatics and Systems Biology
related at a different evolutionary distance than that of the
substitution matrix in use. Trying several scoring matrices
until “something interesting” is found is a common prac-
tice in protein sequence alignment [20]. In our case, scan-
ning the θ range could thus lead to a significant decrease in
D(F
XY
//P
AB
), as detected in the BLOSpectrum, and improve
the score [7, 12, 13], taking it back to Case 1. This could in
turn result in a better capacity to discriminate weakly corre-
lated sequences from those correlated by chance. If, on the
other hand, tuning θ does not greatly affect D(F
XY
//P
AB
),
and we are comparing typical sequences (low background
frequency divergence) with an appropriate θ par ameter, the
large target frequency divergence indicates that some non-
standard evolutionary process (regarding the substitution of
amino acids) is at work. This cannot adequately be captured
by the standard BLOCKS database and BLOSUM substitu-
tion matrices. Under these circumstances, Case 2 can never
lead to high scores, due to the penalization of the target fre-
quency divergence. We are here likely in the grey area of
weakly correlated sequences with a very old common ances-
tor, or of portions of proteins with strong structural prop-
erties that do not require the conservation of the entire se-
quence. Note that unfortunately we are not able to assess the
statistical significance when our method finds a suspected
concealed correlation; however, the method still gives us use-
ful information that helps guide our judgment on the possi-
ble existence of such correlation, that needs to be further in-
vestigated in depth, exploiting other biological information
such as 3D structure and biological function.
Case 3 accounts for the situation in which we have two
nontypical sequences, with high values of both target and
background frequency divergence. This applies, for example,
to some families of antimicrobial peptides, that are unusually
rich in certain amino acids (such as Pro and Arg, Gly,orTrp
residues). This means that the high penalty arising from the
subtracted D(F
XY
//P
AB
) is (at least partially) compensated
by the positive D(F
X
//P
A
)andD(F
Y
//P
B
), and the global
score does not collapse to negative values, even if it is usu-
ally low. In effect, the background frequency divergence acts
as a compensation factor that prevents excessive penalties for
those sequences which, even though related by nonstandard
amino acid substitutions, also have a nontypical background
distribution of the amino acids inside the sequences them-
selves. In other words, the nontypicality of F
XY
is (at least
in part) forced of by the anomalous background frequen-
cies of the amino acids. This compensation is welcome, since
it avoids missing biologically related sequences pertaining
to nontypical protein families, and mathematically corrob-
orates the robustness of the BLOSUM scoring method.
The problem of evaluating the best method for scor-
ing nonstandard sequences has been recently tackled by
Yu et al. [11, 21], who showed that standard substitution
matrices are not truly appropriate in this case, and de-
veloped a method for obtaining compositionally adjusted
matrices. In general, when background frequencies differ
markedly from those implicit in the substitution matrix (i.e.,
the background frequency divergence is high) is one case
when using a standard matrix is nonoptimal. Another is
when the background frequencies vary, and the scale factor
λ
= (log(p(i, j)/p(i)p(j)))/s(i, j) appropriate for normaliz-
ing nominal scores varies as well [8]. If the real λ is lower
than the “standard” one, then the uncorrected nominal score
can appear much too high [19, 22]. Our approach offers a
different perspective to the problem, that is, the possibility
of gaining insight about biological sequence correlation di-
rectly from the BLOSUM score. Moreover, the background
frequency divergence components of BLOSpectrum indicate
whether compositionally adjusted matrices could be useful
in the case under inspection. Since [21] illustrates three “cri-
teria for invoking compositional adjustment” (length ratio,
compositional distance, and compositional angle), we sug-
gest that the occurrence of “Case 3” in the BLOSUM spec-
trum could be thought of as an additional fourth criterion.
The background divergence of the BLOSpectrum decom-
position offers a further rationale to confirm the effectiveness
of the procedure proposed by Yu et al., since a large back-
ground divergence D(F//P) forces the target frequency diver-
gence D(F
XY
//P
AB
) to be unnaturally large; compositionally
adjusted matrices, that minimizes background frequency di-
vergence, tend to remove this effect, leaving it free to assume
the value associated to the (correct degree of evolutionary)
divergence between the sequences under inspection.
As a consequence of the three cases discussed above, we
can suggest the following procedure for analyzing the score
obtained from an alignment between two given sequences
of the same length, or resulting from a BLAST or FASTA
(gapped or ungapped) database search.
Scoring analysis procedure
(1) Given the two sequences, evaluate the components
of (11) by inserting the sequences in the available
software to obtain the BLOSpectrum (http://bioinf.
dimi.uniud.it/software/software/blosumapplet).
(2) Evaluate the target frequency divergence D(F
XY
//P
AB
)
for each θ.
(3) Choose the θ value that minimizes D(F
XY
//P
AB
).
(4) Determine if the alignment falls in Cases 1, 2,or3 as
described.
(5) If the alignment falls in Case 1,wehavetwostrictly
correlated proteins.
(6) If, even after tuning θ, the alignment falls in Case 2
(D(F
XY
//P
AB
) is high, but D(F//P) is low), then we
may have a concealed or weak correlation between the
sequences.
(7) If the alignment falls in Case 3 (both D(F
XY
//P
AB
)and
D(F//P) are high), we may have correlated sequences
belonging to a nontypical family. In this case, the use
of compositionally adjusted matrices may provide a
sharper score [11, 21].
In analyzing the parameters that compose the BLOSpectrum,
so as to decide among Cases 1, 2,and3, we find it useful to
use an indicative, if somewhat arbitrary set of guidelines, as
summarized in Ta ble 1.
We assign a range of values for each parameter (tag L
=
Low, tag M = Medium, tag H = High). These values have been
Francesco Fabris et a l. 7
Table 1: Rule of thumb guidelines to decide among low (L),
medium (M), and high ( H) values of the parameters.
L M H
I(X, Y) <0.9 0.9–1.1 >1.1
D(F
XY
//P
AB
) <1.1 1.1–1.5 >1.5
D(F//P)
<0.3 0.3–0.7 >0.7
derived from a “rule of thumb” approach when analyzing the
results of the experiments described in the following sections;
but obviously they need to be tuned as soon as new experi-
mental evidence will be available.
The final consideration is that, wh en comparing biologi-
cally related sequences, one has to choose the correct scoring
matrix if necessary by means of a compositional adjustment.
If, as a result, background and target frequency divergences
have low values, the mutual information or sequence conver-
gence I(X, Y ) remains as the effective parameter that mea-
sures protein similarity. If, after considering the above possi-
bilities, one still observes a residual persistence of the target
frequency divergence, then two weakly correlated sequences
are presumably identified, that derived from a common re-
mote ancestor after several events of substitution.
3.2. Practical implementation of the method
As stated in the Introduction, we recall that the analysis based
on the BLOSpectrum evaluation is not aimed at increasing
the performance of available alignment algorithms, nor at
suggesting new methods for inserting gaps so as to maximize
the score. The BLOSpectrum only gives added information
of biological and operative interest, but only once two se-
quences have already been aligned using current algorithms,
such as BLAST, BLAST2, FASTA, or others. The ultimate bi-
ological goal of the method is that of revealing the possible
presence of a weak or concealed correlation for alignments
resulting in a relatively low BLOSUM score, that might other-
wise be neglected. Another operative merit is that the knowl-
edge of the target frequency divergence helps identify the best
scoring matrix, that is the one tailored for the correct evolu-
tionary distance.
In order to perform automatic computation of the four
terms of (11), we have developed the software BLOSpec-
trum, freely available at />software/blosumapplet. Given two sequences with the same
length, with or without gaps, the software derives the vec-
tors F
X
, F
Y
,andF
XY
by computing the relative frequencies
f (i)
= n(i)/n, f (j) = n(j)/n,and f (i, j) = n(i, j)/n, that is
the relative frequency of amino acid i observed in sequence
X, of amino acid j observed in sequence Y , and the relative
frequency of the pair i, j. The vectors P
AB
={p(i, j)}
i, j
and
P
={p(i)}
i
, needed to decompose the score, are those de-
rived from BLOCKS database and used by S. Henikoff and
J. G. Henikoff [9] to extract the score entries of the 20
∗ 20
BLOSUM matrices (35, 40, 50, 62, 80, 100); they have been
kindly provided by these authors on request. The software
computes also the exact BLOSUM normalized score, that is
the algebraic sum of the four terms, together with the rough
BLOSUM score, directly obtained by summing up the inte-
ger values of the BLOSUM-θ matrix. As already observed in
Section 2.2 the pairs containing a gap, such as (
−, j)or(i, −),
are not considered in the computation, since their contribu-
tion to the score is zero when one assumes the independence
between a gap and the paired amino acid.
There are essentially two ways for employing the BLO-
Spectrum. The first one is that of performing a BLAST or
FASTA search inside a database, given a query sequence.
Theresultisasetofh possible matches, ordered by score,
in which the query sequence and the corresponding match
are paired for a length that is respectively n
1
, n
2
, , n
h
.The
user can extract all matches of interest within the output
set a nd compares them with the query sequence by using
BLOSpectrum software. The second one is that of comparing
two assigned sequences with a program such as BLAST2, so
as to find the best gapped alignment. Also in this case we can
use BLOSpectrum on the two portions of the query sequences
that are paired by BLAST2 and that have the same length n.
It is obvious that the next step would b e that of integrating
the BLOSpectrum tool inside a widely used database search
engine.
Even if the correct way for using the BLOSpectrum soft-
ware is that of supplying it with two sequences of the same
length, derived from preceding queries of BLAST, BLAST2,
FASTA or others, the BLOSpectrum applet accepts also two
sequences of different length n and m>n; in this case the
program merely computes the scores associated to all possi-
ble alignments of n over m, showing the highest one, but it
does not insert gaps.
3.3. Biological examples
To illustrate the behavior of the BLOSpectrum under the per-
spective of the above three cases, we have chosen groups of
proteins from several established protein families present in
the SWISSPROT data bank
(see Table 2), together with some specific examples of se-
quences, taken from the literature, that are known to be bio-
logically related, even if aligning with rather modest scores.
The first set contains sequences from the related Hep-
atocyte nuclear factor 4α (HNF4-α), Hepatocyte nuclear fac-
tor 6 (HNF6), and GAT binding protein 1 (globin transcrip-
tion factor 1 families). These represent typical protein fami-
lies coupled by standard target frequencies. Furthermore, se-
quences within each family are quite similar to one another,
with a percent identity greater than 85%. All these proteins
are expected to fall in Case 1.
The second set of sequences is expected to fall in Case 2.A
first example is taken from the serine protease family, contain-
ing paralogous proteins such as trypsin, elastase, and chy-
motrypsin, whose phylogenetic tree constructed according to
the multiple alignment for all members of this family [23]is
consistent with a continuous evolutionary divergence from
acommonancestorofbothprokaryotesandeukaryotes.
Another example pertaining to weakly correlated sequences
that show distant relationships is the one originally used by
8 EURASIP Journal on Bioinformatics and Systems Biology
Table 2: The three sets of protein families used in testing the BLOSpectrum. The UniProt ID is furnished (with the sequence length). For the
defensins and Pro-rich peptides, only the mature peptide sequences were used in alignments. In the following tables, sequences are indicated
by the corresponding numbers 1–4.
Sequence
Family 1 2 3 4
First set
HNF4-α
P41235 (465)
H. sapiens
P49698 (465)
Mus musculus
P22449 (465)
Rattus norv.
HNF6
Q9UBC0 (465)
H. sapiens
O08755 (465)
Mus musculus
P70512 (465)
Rattus norv.
GAT1
P15976 (413)
H. sapiens
P17679 (413)
Mus musculus
P43429 (413)
Rattus norv.
Second set
Serine proteases
P07477 (247)
H. sapiens
trypsin
P17538 (263)
H. sapiens
chymotrypsin
Q9UNI1 (258)
H. sapiens
elastase1
P00775 (259)
Streptomyces
griseus trypsin
P35049 (248)
Fusarium oxy-
sporum trypsin
Hemoglobins
P02232 (92)
Vicia faba
leghemoglobin I
S06134 (92)
P. chilensis
hemoglobin I
Transpo sons
A26491 (41)
D. mauritiana
mariner transposon
NP493808 (41)
C. elegans
transposon TC1
Beta defensins
BD01 (36)
H. sapiens
BD02 (41)
H. sapiens
BD03 (39)
H. sapiens
BD04 (50)
H. sapiens
Third set
Pro/Arg-
rich
peptides
BCT5 (43) bovin BCT7 (59) bovin PR39PRC (42) pig PF (82) pig
Altschul [7] to compare PAM-250 with PAM-120 matrices,
that is, the 92 length residue Vicia faba leghemoglobin I and
Paracaudina chilensis hemoglobin I, characterized by a very
poor percent identity (about 15%), with pairs of identical
amino acids residues that are spread fairly evenly along the
alignment. A further example considers the sequences as-
sociated to Drosophila mauritiana mariner transposon and
Caenorhabditis elegans transposon TC1, with a length of 41
residues, used by S. Henikoff andJ.G.Henikoff [9] to test the
performance of their BLOSUM scoring matrices. The last ex-
ample derives from human beta defensins. This family of host
defense peptides have arisen by gene duplication followed by
rapid divergence driven by positive selection, a common oc-
currence in proteins involved in immunity [24]. They are
characterized by the presence of six highly conserved cys-
teine residues, which determines folding to a conserved ter-
tiary structure, while the rest of the sequence seems to have
been relatively free of structural constraints during evolution
[25, 26]. Even if clearly related, these peptides have a percent-
age sequence identity less than 40%.
All these families represent the case of nonstandard tar-
get frequencies, while the amino acid frequency distribution
does not appear, at first sight, to be too abnormal. The se-
quence comparisons score are modest at best, even though
members are known to be biologically correlated.
The third set contains sequences that are expected to fall
in Case 3. These are members of the Bactenecins family of lin-
ear antimicrobial peptides, with an unusually high content
of Pro and Arg residues, and an identity of about 35% [27],
representing sequences with a highly atypical amino acid fre-
quency distribution.
If we analyze the alignments inside all these sets of pro-
tein families, we effectively find examples for each of the
three cases illustrated in the preceding section. The align-
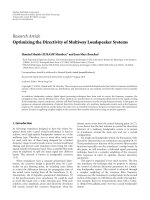
ments of human and mouse HNF4-α sequences (as illus-
trated in Ta ble 3), and the BLOSpectrum of HNF4-α,HNF6,
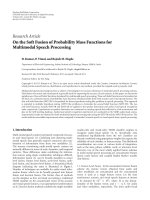
and GAT1 sequence comparisons (see Figure 1), are clear ex-
amples of Case 1, with high correlation between all respective
couples of sequences and a target frequency divergence that
is strongly sensitive to the BLOSUM-θ par ameter, so we stop
the scoring procedure at step 5.
For example, the HNF4-α alignment has a target fre-
quency divergence that varies from 2.41 to 0.93 when
passing from BLOSUM-35 (a matrix tailored for a wrong
Francesco Fabris et a l. 9
Table 3: BLOSUM decomposition for intrafamily alignments for proteins of the first set.
HNF4-α human versus HNF4-α mouse
BLOSUM I(X, Y) D(F
XY
//P
AB
) D(F
X
//P) D(F
Y
//P) S
N
(X, Y) Score % Identity
100 3.939 0.929 0.050 0.057 3.118 2833 95.9
80
3.939 1.297 0.046 0.053 2.741 2537 95.9
62
3.939 1.582 0.046 0.052 2.456 2330 95.9
50
3.939 1.861 0.043 0.050 2.171 3003 95.9
40
3.939 2.226 0.039 0.047 1.800 3381 95.9
35
3.939 2.414 0.036 0.044 1.605 2982 95.9
HNF4-α (BLOSUM-100)
Sequences I(X, Y) D(F
XY
//P
AB
) D(F
X
//P) D(F
Y
//P) S
N
(X, Y) Score % Identity
1–3 3.955 0.930 0.050 0.056 3.132 2846 96.3
2-3
4.141 1.008 0.057 0.056 3.246 2952 99.5
(1) I(X, Y )(2)D(F
XY
//P
AB
)(3)D(F
X
//P)(4)D(F
Y
//P)(5)Score
HNF4-α human
versus
HNF4-α mouse
HNF6 human
versus
HNF6 mouse
GAT1 human
versus
GAT1 mouse
First set
3
2
1
−1
12345
BLOSUM-100
3
2
1
−1
BLOSUM-100
3
2
1
−1
BLOSUM-100
Figure 1: BLOSpectrum for sequences of the first set.
evolutionary distance), to BLOSUM-100 (the matrix tai-
lored for a correct evolutionary distance) so that minimiz-
ing the frequency divergence (rows in italic) helps identify
the best θ parameter for comparing the analyzed sequences;
it corresponds to θ
= 100, coherent with the high per-
cent identity (86–96%). In this case, the compensation fac-
tor D(F
X
//P)+D(F
Y
//P) corresponding to background fre-
quency divergence is almost zero, since observed background
and target frequencies are very near to those implicit in
the BLOCKS database, leading to the conclusion that these
are typical sequences that correspond closely to the protein
model associated with BLOCKS. The global (normalized)
score is high (3.12 in the HNF4-α example), due to a high
degree of stochastic similarity (I(X, Y)
≈ 3.94), which is not
greatly penalized. Other members of the HNF4-α,HNF6,or
GAT1 families behave similarly (see Figure 1).
The situation changes considerably when we compute the
BLOSUM decomposition for the different examples listed
for the second set, for example, comparing human trypsin,
elastase and chymotrypsin to one another, or comparing
these enzymes in distantly related species, such as human,
streptomyces griseus (a bacterium), and Fusarium oxyspo-
rum (a fungus). Following the Scoring Procedure, and starting
with ungapped alignments, we have a case of high target fre-
quency divergence, with a low level of background frequency
divergence, corresponding to the situation outlined in step
6. However, as soon as we use gapped alignments, we ob-
serve a remarkable increment in the score, due to a reduced
10 EURASIP Journal on Bioinformatics and Systems Biology
(1) I(X, Y )(2)D(F
XY
//P
AB
)(3)D(F
X
//P)(4)D(F
Y
//P)(5)Score
BLOSUM-62BLOSUM-40 BLOSUM-35
BLOSUM-40
BLOSUM-35
BLOSUM-80 BLOSUM-50
Chymotrypsin human
versus
S. griseus trypsin
Vicia faba
leghemoglobin I
versus
Paracaudina chilensis
hemoglobin I
D. mauritiana
mariner transposon
versus
C. elegans
transposon TC1
BD01 human
versus
BD02 human
Gapped
Ungapped
Second set
1
−1
2
1
−1
12345
12345
2
1
−1
−2
2
1
−1
−2
2
1
−1
−2
−3
2
1
−1
−2
3
2
1
−1
−2
−3
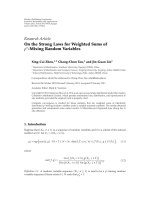
Figure 2: BLOSpectrum for (ungapped and gapped) sequences of the second set.
penalization factor associated to target frequency divergence
(see Figure 2,firstcolumn,andTabl e 4 ). This is the obvious
case when the bad matching is a consequence of deletions
and/or insertions that occurred during evolution, which is
resolved once gaps are introduced, so that the sequence com-
parison fal ls into Case 1
Adifferent situation occurs aligning Vicia faba leghe-
moglobin I and Paracaudina chilensis hemoglobin I. D(F
XY
//
P
AB
) minimization (step 3) leads to a narrower spread
of values (2.48–2.07) when passing from BLOSUM-100 to
BLOSUM-35, with minimum (2.05) at θ
= 40, which is con-
sequently the best parameter to compare the sequences. The
global score (0.24) is rather low, despite these sequences be-
ing clearly evolutionarily related. In fact, the BLOSpectrum
shows that the stochastic correlation I(X, Y)isquitehigh
(1.84), but is killed by the heavy penalty derived from the
negative contribution of D(F
XY
//P
AB
), while the compensa-
tion factors due to background frequency divergence are less
significant (0.25 and 0.19, resp.), as the sequences are typical
proteins under the BLOCKS model. Furthermore, extending
the size of the alignment or including gaps does not signif-
icantly alter the spectr um (see Table 5 and Figure 2,second
column), so we leave the Scoring Procedure at step 6; we sim-
ply have weakly related sequences.
The Drosophila mauritiana and Caenorhabditis elegans
transposons provide a similar example, with only a weak
minimization for θ
= 62 (D(F
XY
//P
AB
) = 2.80). The other
BLOSpectrum components are respectively I( X, Y )
= 2.34,
D(F
X
//P) = 0.53, and D(F
Y
//P) = 0.72. The sequences thus
have a high stochastic correlation, but the target frequencies
are rather atypical, so that the divergence entirely kills the
contribution derived from mutual information, and if the
score is weakly positive (0.79) it is only due to the terms
associated to background frequency divergence. In fact, the
biological relationship of these atypical sequence fragments
is effectively captured only due to the presence of this com-
pensation factor. In this case, a gapped alignment includ-
ing a wider portion of the sequences, actually reduces the
Francesco Fabris et a l. 11
Table 4: BLOSUM decomposition for ungapped and gapped serine proteases.
Serine proteases
BLOSUM I(X,Y) D(F
XY
//P
AB
) D(F
X
//P) D(F
Y
//P) S
N
(X, Y) Score % Identity
human chymotr ypsin versus Streptomyces griseus trypsin (ungapped)
100 1.014 2.023 0.134 0.132 −0.742 −398 11.5
80
1.014 1.739 0.141 0.137 −0.446 −230 11.5
62
1.014 1.570 0.146 0.145 −0.264 −121 11.5
50
1.014 1.437 0.134 0.141 −0.147 −120 11.5
40
1.014 1.321 0.132 0.138 −0.035 −42 11.5
35
1.014 1.305 0.136 0.145 −0.008 −7 11.5
human chymotr ypsin versus Streptomyces griseus trypsin (gapped)
100 1.645 1.213 0.164 0.156 0.753 326 35.9
80
1.645 1.138 0.170 0.164 0.842 382 35.9
62
1.645 1.149 0.178 0.171 0.845 416 35.9
50
1.645 1.176 0.171 0.159 0.800 557 35.9
40
1.645 1.270 0.170 0.158 0.703 640 35.9
35
1.645 1.346 0.177 0.163 0.640 584 35.9
background frequency divergences to remarkably lower val-
ues (0.237 and 0.226), neutralizing the compensation (see
Table 6 and Figure 2, third column).
In both the preceding examples, we are in the situation
where the parameter θ of the substitution matrix is appropri-
ate for the sequence divergence of the sequences in question,
the background frequency divergence is small, but the target
frequency divergence is still large: this is a signal that we are
dealing with weakly related sequences, characterized by sev-
eral events of substitution that occurred during evolution. It
is usually difficult to capture these weakly related sequences
using standard scoring matrices, such as BLOSUM or PAM,
since the common ancestor could be very old. As a matter of
fact, this difficulty was used to respectively test the PAM-250
versus PAM-120 matrices (Altschul [7], hemoglobin) and
BLOSUM-62 versus PAM-160 matrices (S. Henikoff and J.
G. Henikoff [9], transposons). Here, we cannot remove the
cause of mismatching and we leave the Scoring Procedure at
step 6.
The last example from this group derives from human
beta defensins, and even if these sequences are known to be
evolutionarily related, some couples actually show a negative
normalized score (1–4, 2-3, 2–4, see Table 7 and Figure 2,
last column), suggesting that they are not. In fact, a nor-
mal BLOSUM-62 BLAST search using the human beta de-
fensin 1 sequence, picks up several homologues from other
mammalian species, whereas those with the three paralogous
human sequences are below the cutoff score. BLOSpectrum
analysis reveals a high stochastic correlation I(X, Y) (2.00–
3.03), neutralized by an even higher-penalty factor due to the
target frequency divergence (3.28–3.56), partly compensated
by the substantial background frequency divergences (0.54–
0.79), and with little effect of the BLOSUM-θ parameter, or
of introducing gaps. These are fairly typical proteins, whose
score is heavily penalized by a remarkable target frequency
divergence. Only the compensation factor induced by back-
ground frequency divergence can, in some cases, sustain the
score over positive values, allowing the identification of a bi-
ological correlation that would otherwise have been lost.
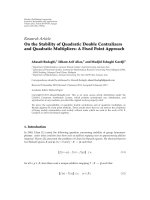
The third set of sequences are Pro/Arg rich antimicro-
bial peptides of the Bactenecins family, with about 35% iden-
tity [27, 28]. The obtained scores are clearly positive, despite
the poor stochastic correlation (0.40–0.60, see Table 8 and
Figure 3).
The penalty factor due to target frequency divergence is
remarkably high in this case (4.15–4.49) and should drag
the score to quite negative values, but the compensation fac-
tor due to background frequency divergence is even greater
and fully compensates it. We thus leave the scoring proce-
dure at step 7. This is the typical case of poorly conserved
sequences with singular key structural aspects that are how-
ever highly preserved (c.f. the pattern of proline and argi-
nine residues). As the background frequencies F
X
and F
Y
are far from the standard background P associated with the
BLOCKS database, the evaluation of a more realistic score for
these sequences pass through the use of a decompositionally
adjusted BLOSUM matrix [11]. Such matrices are built in
such a way as to reduce background frequency divergence,
so as to eliminate the port ion of target divergence that is in-
duced by it. In this way, the residual target divergence ac-
counts only for effec tive evolutional divergence between se-
quences.
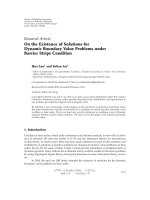
As a final example, we obtained BLOSUM spectra also for
sequences from obviously uncorrelated families. The results
are reported in Table 9 and Figure 4. In these cases we gener-
ally obtain a poor stochastic correlation I(X,Y), and a high
value for the penalty factor D(F
XY
//P
AB
), leading to a glob-
ally negative score, which is not compensated by background
12 EURASIP Journal on Bioinformatics and Systems Biology
Table 5: BLOSUM decomposition for ungapped and gapped hemoglobins.
P02232: 49 SAGVVDSPKLGAHAEKVFGMVRDSAVQLRATGEVVLDGKDGSIHIQKGVLDPHFVVVKEALLKTIKE 115
++ + S ++ AHA +V ++ + +L + L H V H+ + + L++ ++
S06134: 61 ASQLRSSRQMQAHAIRVSSIMSEYVEELDSDILPELLATLARTHDLNKVGADHYNLFAKVLMEALQA 127
P02232: 116 ASGDKWSEELSAAWEVAYDGLATAI 140
G ++E+ AW A+
S06134: 128 ELGSDFNEKTRDAWAKAFSIVQAVL 152
Vicia faba leghemoglobin I versus Paracaudina chilensis hemoglobin I (ungapped)
BLOSUM I(X,Y) D(F
XY
//P
AB
) D(F
X
//P) D(F
Y
//P) S
N
(X, Y) Score % Identity
100 1.839 2.478 0.264 0.207 −0.166 −31 15.2
80
1.839 2.240 0.264 0.199 0.063 12 15.2
62
1.839 2.128 0.260 0.192 0.163 35 15.2
50
1.839 2.077 0.255 0.185 0.203 54 15.2
40
1.839 2.051 0.255 0.194 0.237 83 15.2
35
1.839 2.070 0.263 0.202 0.235 82 15.2
Vicia faba leghemoglobin I versus Paracaudina chilensis hemoglobin I (gapped)
100 1.597 1.962 0.166 0.172 −0.026 −10 18.1
80
1.597 1.759 0.161 0.163 0.162 40 18.1
62
1.597 1.661 0.154 0.153 0.243 65 18.1
50
1.597 1.618 0.145 0.145 0.268 104 18.1
40
1.597 1.606 0.145 0.155 0.291 152 18.1
35
1.597 1.623 0.154 0.163 0.283 148 18.1
P02232: 2 FTEKQEALVNSSSQLFKQNPSNYSVLFYTIILQKAPTAKAMFSFLK DSAGVVDSPKLGAHAEKVF 68
T Q+ +V + +N +++ + I P+A+ F + ++ + S ++ AHA +V
S06134: 12 LTLAQKKIVRKTWHQLMRNKTSFVTDVFIRIFAYDPSAQNKFPQMAGMSASQLRSSRQMQAHAIRVS 78
P02232: 69 GMVRDSAVQLRATGEVVLDGKDGSIHIQKGVLDPHFVVVKEALLKTIKEASGDKWSEELSAAWEVAY 135
++ + +L + L H V H+ + + L++ ++ G ++E+ AW A+
S06134: 79 SIMSEYVEELDSDILPELLATLARTHDLNKVGADHYNLFAKVLMEALQAELGSDFNEKTRDAWAKAF 145
frequency divergences. Note that in two cases, a mildly posi-
tive score could suggest a distant relationship. Analysis of the
BLOSpectrum helps in evaluating this possibility. The PF12
versus GAT1 alignment is simply a case of overcompensation
for a nontypical sequence (the background frequency diver-
gence for one of the sequences is very high). In the second
case, however, the I(X, Y) value for the BD04 versus GAT1
human alignment is surprisingly quite high, suggesting that
a closer look might be appropriate.
4. CONCLUSIONS
A standard use of scoring substitution matrices, such as
BLOSUM-θ, is often insufficient for discovering concealed
correlations between weakly related sequences. Among other
causes, this can derive from (i) the introduction of gaps dur-
ing evolution (ii) use of a BLOSUM-θ matrix tailored for a
different evolutionary distance than that pertaining to the
aligned sequences, and/or (iii) the use of standard matrices
Francesco Fabris et a l. 13
Table 6: BLOSUM decomposition for ungapped and gapped transposons.
NP_493808: 243 VFQQDNDPKHTSLHVRSWFQRRHVHLLDWPSQSPDLNPIEH 283
+F DN P HT+ VR + + +L + SPDL P +
A26491: 245 IFLHDNAPSHTARAVRDTLETLNWEVLPHAAYSPDLAPSDY 285
Drosophila mauritiana mariner transposon versus C. elegans transposon TC1 (ungapped)
BLOSUM I(X,Y) D(F
XY
//P
AB
) D(F
X
//P) D(F
Y
//P) S
N
(X, Y) Score % Identity
100 2.339 2.926 0.740 0.531 0.685 55 34.1
80
2.339 2.849 0.733 0.531 0.754 60 34.1
62
2.339 2.800 0.724 0.526 0.789 67 34.1
50
2.339 2.831 0.721 0.516 0.746 90 34.1
40
2.339 2.935 0.716 0.509 0.630 104 34.1
35
2.339 2.969 0.714 0.505 0.590 92 34.1
Drosophila mauritiana mariner transposon versus C. elegans transposon TC1 (gapped)
100 1.991 2.244 0.244 0.243 0.235 40 25.0
80
1.991 2.110 0.246 0.234 0.362 67 25.0
62
1.991 2.021 0.245 0.227 0.443 91 25.0
50
1.991 2.009 0.237 0.226 0.445 123 25.0
40
1.991 2.043 0.227 0.228 0.404 152 25.0
35
1.991 2.066 0.226 0.229 0.381 144 25.0
NP_493808: 243 VFQQDNDPKHTSLHVRSWFQRRHVHLLDWPSQSPDLNPIE-HLWEELERRLGGIRASNAD 301
+F DN P HT+ VR + + +L + SPDL P + HL+ + L R + +
A26491: 245 IFLHDNAPSHTARAVRDTLETLNWEVLPHAAYSPDLAPSDYHLFASMGHALAEQRFDSYE 304
NP_493808: 302 AKFNQLENAWKAIPMSVIHKLIDSMPRRCQAVIDANG 338
+ L+ +A +I +PR+ +++G
A2649: 305 SVKKWLDEWFAAKDDEFYWRGIHKLPERWEKCVASDG 341
for comparison of proteins with nonstandard background
frequency distributions of amino acids. All these well-known
effects can be better evidenced and quantified by decompo-
sition of BLOSUM score (BLOSpectrum) according to (11).
This equation highlights the core of the biological correla-
tion measured by the BLOSUM score, that is mutual infor-
mation I(X, Y ), or sequence convergence. If gaps are taken
into a ccount (such as in BLAST), and the correct θ parame-
ter is chosen with the help of BLOSpectrum, and if the back-
ground frequencies of sequences are near to the standard
ones, then the global score is given by sequence convergence
plus a residual penalization factor due to target frequency
divergence. This residual value implicitly takes into account
that numerous substitution events may have occurred dur-
ing sequence evolution, and so is a coherent measure of the
biological relationship and distance between the sequences.
If the backg round frequencies of sequences are not standard,
then we have shown the BLOSUM scoring method has an
in-built capacity to correct for anomalies in amino acid dis-
tributions using background frequency divergence as a com-
pensation factor. One can also choose to compositionally ad-
just the matrix, so as to reduce the compensation factor to-
gether with the component of target frequency divergence
that is induced by a bad background frequency distribution.
This systematic method is illustrated in the scor ing analysis
procedure of Section 2.
Our decomposition becomes important when we con-
sider sequences for which the BLOSUM score indicates a
weak or no correlation. A critical evaluation of the BLO-
Spectrum components can help corroborate or identify an
underlying biological correlation and whether the matrices
being used are the most appropriate ones for measuring it.
In other words, when considering the grey area of BLO-
SUM scores with a marginal significance, it could help to
14 EURASIP Journal on Bioinformatics and Systems Biology
Table 7: The BLOSUM terms for beta defensins.
BD01 human versus BD02 human
BLOSUM I(X, Y ) D(F
XY
//P
AB
) D(F
X
//P) D(F
Y
//P) S
N
(X, Y) Score % Identity
100 3.030 3.566 0.564 0.618 0.646 45 41.6
80
3.030 3.453 0.568 0.623 0.768 58 41.6
62
3.030 3.438 0.604 0.652 0.849 65 41.6
50
3.030 3.418 0.615 0.663 0.891 99 41.6
40
3.030 3.378 0.577 0.626 0.855 129 41.6
35
3.030 3.320 0.539 0.588 0.837 120 41.6
human beta defensins (BLOSUM-35)
Sequences I(X, Y) D(F
XY
//P
AB
) D(F
X
//P) D(F
Y
//P) S
N
(X, Y) Score % Identity
1–3 2.731 3.325 0.539 0.751 0.697 101 30.5
1–4
2.532 3.658 0.539 0.728 0.141 22 16.6
2-3
2.009 3.466 0.794 0.616 −0.045 −10 10.2
2–4
2.334 3.522 0.609 0.568 −0.009 0 12.1
3-4
2.122 3.286 0.794 0.655 0.286 44 20.5
Table 8: The BLOSUM terms for Pro/Arg-rich peptides.
BCT5 bovin versus BCT7 bovin
BLOSUM I(X, Y ) D( F
XY
//P
AB
) D(F
X
//P) D(F
Y
//P) S
N
(X, Y) Score % Identity
100 0.424 4.935 2.329 2.460 0.279 28 34.8
80
0.424 4.724 2.317 2.449 0.467 42 34.8
62
0.424 4.637 2.301 2.430 0.518 37 34.8
50
0.424 4.533 2.264 2.389 0.544 68 34.8
40
0.424 4.407 2.221 2.338 0.576 97 34.8
35
0.424 4.368 2.199 2.301 0.556 98 34.8
Pro/Arg-rich peptides (BLOSUM-35)
Sequences I(X, Y) D(F
XY
//P
AB
) D(F
X
//P) D(F
Y
//P) S
N
(X, Y) Score % Identity
1–3 0.516 4.434 2.095 2.205 0.382 63 30.9
1–4
0.446 4.491 2.199 2.488 0.643 110 39.5
2-3
0.584 4.156 2.095 2.257 0.780 133 47.6
2–4
0.406 4.350 2.256 2.251 0.563 134 37.2
3-4
0.609 4.260 2.095 2.347 0.792 132 45.2
decide if an evolutionary relationship actually exists. We pro-
vide online software at />software/blosumapplet w hich integ rates a BLOSpectrum his-
togram with the score obtained by a classical BLAST engine
working on two input sequences, which allows an immediate
visual analysis of the score components. The systematic use
of BLOSpectrum parameters to permit a more sensitive filter-
ing of scores inside a BLAST or similar engine could be the
logical next operative step. We have provided several biolog-
ical examples indicating the potential of our method, but it
is clear that it needs a massive biological experimentation to
completely test its effective usefulness.
APPENDIX
Proof of (11). By multiplying inside the log function of (7)
by f (i, j)/f(i, j)andby f (i) f ( j)/f(i) f (j) and rearranging
the terms, we obtain
S
N
(X,Y) =
i, j
f (i, j)log
p(i, j)
p(i)p( j)
f (i, j)
f (i, j)
f (i) f ( j)
f (i) f ( j)
=
i, j
f (i, j)log
f (i, j)
f (i) f ( j)
−
i, j
f (i, j)log
f (i, j)
p(i, j)
+
i, j
f (i, j)log
f (i) f ( j)
p(i)p( j)
Francesco Fabris et a l. 15
(1) I(X, Y )(2)D(F
XY
//P
AB
)(3)D(F
X
//P)(4)D(F
Y
//P)(5)Score
BCT5 bovin
versus
BCT7 bovin
BCT5 bovin
versus
PR39PRC pig
BCT7 bovin
versus
PR39PRC pig
Third set
BLOSUM-35
2
1
−1
−2
−3
−4
2
1
−1
−2
−3
−4
12345
BLOSUM-35
2
1
−1
−2
−3
−4
BLOSUM-35
Figure 3: BLOSpectrum for sequences of the third set.
Table 9: Some examples of BLOSUM-35 terms for sequences belonging to noncorrelated families.
BLOSUM-35
HNF4-α human versus HNF6 human
Sequences I(X, Y) D(F
XY
//P
AB
) D(F
X
//P) D(F
Y
//P) S
N
(X, Y) Score % Identity
1-1 0.578 0.986 0.036 0.205 −0.165 −312 5.37
HNF4-α human versus GAT1 human
1-1 0.712 1.033 0.038 0.193 −0.088 −144 8.71
HNF6 human versus GAT1 human
1-1 0.622 1.122 0.230 0.193 −0.076 −143 8.47
BD04 human versus BCT7 bovin
4–2 1.010 3.887 0.460 2.220 −0.195 −36 10.0
PF12 pig versus GAT1 human
4–1 0.686 3.486 2.182 0.709 0.091 24 18.2
BD04 human versus GAT1 human
4–1 2.243 3.033 0.460 0.465 0.136 25 12.0
= I(X, Y) − D
F
XY
//P
AB
+
i, j
f (i, j)log
f (i)
p(i)
+
i, j
f (i, j)log
f ( j)
p( j)
= I(X, Y) − D
F
XY
//P
AB
+ D
F
X
//P
A
+ D
F
Y
//P
B
. (A.1)
A fuller understanding of the mathematical tools used in
Section 2 requires some definitions and mathematical prop-
erties pertaining to ID and MI; they are summarized as fol-
lows.
Let us start by considering some probability distribu-
tions [10] over an alphabet A with K symbols, for example
P
={p
1
, p
2
, , p
K
}, Q ={q
1
, q
2
, , q
K
},andsoon.Inour
context, K
= 20, as there are 20 amino acids, and the al-
phabet letters correspond to the 1-letter amino acid standard
coding (D
= Asp, E = Glu, W = Trp, etc.). If we imagine the
space of all possible K dimensional probability distributions,
it is right to ask what is the “distance” from P to Q (or vice
16 EURASIP Journal on Bioinformatics and Systems Biology
HNF4 human
versus
HNF6 human
HNF6 human
versus
GAT1 human
−1
1
−1
1
BLOSUM-35
−1
1
BLOSUM-35
Noncorrelated sequences
2
1
−1
−2
−3
−4
2
1
−1
−2
−3
−4
2
1
−1
−2
−3
BD04 human
versus
BCT7 bovin
BLOSUM-35
12345
BLOSUM-35 BLOSUM-35
(1) I(X, Y )(2)D(F
XY
//P
AB
)(3)D(F
X
//P)(4)D(F
Y
//P)(5)Score
BLOSUM-35
12345
PF12 pig
versus
GAT1 human
HNF4 human
versus
GAT1 human
BD04 human
versus
GAT1 human
Figure 4: BLOSpectrum for noncorrelated sequences.
versa). The most popular (pseudo-)distance is the informa-
tional divergence D( P//Q),
D(P//Q)
K
i=1
p(i)log
p(i)
q(i)
,(A.2)
introduced by Kullback in 1954 in the context of statistics
[29]; here p(i)
≥ 0andq(i) > 0. It is easy to verify [18]
that the informational divergence (ID) is nonnegative, and it
is equal to 0 if and only if P is coincident with Q (P
≡ Q).
Furthermore, ID is not boundable, since D(P//Q)
→ +∞ if
an i exists such that q(i)
→ 0. All this can be summarized in
the following way:
0
≤ D(P//Q) ≤ +∞ (= 0 when P ≡ Q)
=
+∞ when there exists i such that 2(i) = 0
.
(A.3)
Note that ID is the sum of positive and negative terms, and
the fact that the average is always greater than zero is not ob-
vious (it is a consequence of the convexity property of the
logarithm). Since D(P//Q)
= 0 if and only if P ≡ Q, this al-
lows us to interpret the ID as a measure of (pseudo)distance
between probability distributions. It is only “pseudo” (from
the mathematical point of view) since the concept of “dis-
tance” is well defined in mathematics, and requires also sym-
metry between the variables and the validity of the so-called
triangular inequality. But ID lacks both these last two prop-
erties, since, in general, D(P//Q)
= D(Q//P) (it is asymmet-
ric) and, if R is a third probability distribution, we are not
sure that D(P//R)+D(R//Q) is greater than D(P//Q) (the
triangular inequality does not hold). We underline that such
a distance is not symmetric (and so the order in which P and
Q are specified does matter), that is, it is a distance “from”
rather than a distance “between.”
Suppose now that P
X
={p
X
(1), p
X
(2), , p
X
(K)} and
P
Y
={p
Y
(1), p
Y
(2), , p
Y
(K)} are the probability distribu-
tions associated to the (random) variables X and Y ,which
take their values in the same alphabet A.Here,p
X
(i) =
Pr{X = i} means the probability that the variable X assumes
Francesco Fabris et a l. 17
the value i.Inourframework,X and Y are two protein se-
quences of the same length n,andp
X
(2) = Pr{X = 2}=0.09
(e.g.) is interpreted as the relative frequency of the second
amino acid of the alphabet A;so,theoveralloccurrenceof
the 2nd amino acid in sequence X is equal to 0.09n. In this
context, we can introduce also a joint probability distribu-
tion associated to the sequences, P
XY
={p
XY
(i, j), i, j ∈
A}=Pr{X = i, Y = j, i, j ∈ A},wherep
XY
(i, j)corre-
sponds to the relative frequency of finding the amino acids
i, j paired in a certain position of the alignment between X
and Y. It is well known that
i, j
p
XY
(i, j) = 1(P
XY
is a prob-
ability distribution) and that the sum of the joint probabili-
tiesoveronevariablegivesthemarginal of the other variable
j
p
XY
(i, j) = p
X
(i). For example, given that the ninth and
the fifth amino acid in the alphabet are Arginine and Leucine,
respectively, p
XY
(9, 5) = p
XY
(Arg, Leu) = 0.01 means that
the relative frequency of finding Arg in X paired with Leu in
Y is equal to 0.01. In practice, we avoid the use of the sub-
scripts, and use the simpler notation p(i)andp(i, j) instead
of p
X
(i)andp
XY
(i, j).
Since the condition of independence between two vari-
ables (protein sequences) X and Y is fixed by the formula
p
XY
(i, j) = p
X
(i)p
Y
( j)(foreachpairi, j ∈ A), then, once
assigned a certain P
XY
, it could be interesting to attempt
to evaluate the distance of P
XY
from the condition of inde-
pendence between the variables. Making use of the ID (A.2),
we need to evaluate the quantity D(P
XY
//P
X
P
Y
), that is the
stochastic distance between the joint P
XY
and the product of
the marginals P
X
P
Y
. If we have independence, then P
XY
≡
P
X
P
Y
, and the divergence equals zero. On the contrary, if it
appears that X and Y are tied by a certain degree of depen-
dence, this can be measured by
D
P
XY
//P
X
P
Y
=
i, j
p(i, j)log
p(i, j)
p(i)p( j)
I(X, Y)
≥ 0.
(A.4)
This quantity is called also the mutual information (or rela-
tive entropy) I(X, Y ) between the random variables (the pro-
tein sequences, in our setting) X and Y. It is symmetric in
its variables (I(X,Y)
= I(Y, X)) and is always nonnegative,
since it is an informational divergence. Note also that MI is
upper bounded by the logarithm of the alphabet cardinal-
ity, that is I(X, Y)
≤ log 20 [18]. Moreover, since it equals
zero if and only if the joint probability distribution coin-
cides with the product of the marginals, that is, when we
have independence between the two variables, we can inter-
pret the mutual information (MI)asameasureofstochastic
dependence between X and Y . From another point of view,
we can say that independence is equivalent to the situation
in which the variables X and Y do not exchange informa-
tion. So, the meaning of I(X,Y) can be read also as the de-
gree of dependence between the variables, or as the average in-
formation exchanged between the same var iables. Mutual in-
formation is one of the pillars of Shannon information the-
ory, and was introduced in the seminal paper by Shannon
[16, 17].
ACKNOWLEDGMENTS
The authors thank Jorja Henikoff, who provided the matrices
of joint probability distributions associated to the database
BLOCKS, and an anonymous referee of a previous version
of this paper, who made several key remarks. This work has
been supported by the Italian Ministry of Research, PRIN
2003, FIRB 2003 Grants, by the Istituto Nazionale di Alta
Matematica (INdAM), 2003 Grant, and by the Regione Friuli
Venezia Giulia (2005 Grants).
REFERENCES
[1] S. B. Needleman and C. D. Wunsch, “A general method appli-
cable to the search for similarities in the amino acid sequence
of two proteins,” Journal of Molecular Biology, vol. 48, no. 3,
pp. 443–453, 1970.
[2] A. D. McLachlan, “Tests for comparing related amino-acid
sequences. Cytochrome c and cy tochrome c
551
,” Journal of
Molecular Biology, vol. 61, no. 2, pp. 409–424, 1971.
[3] D. Sankoff, “Matching sequences under deletion-insertion
constraints,” Proceedings of the National Academy of Sciences
of the United States of America, vol. 69, no. 1, pp. 4–6, 1972.
[4] P. H. Sellers, “On the theory and computation of evolution-
ary distances,” SIAM Journal on Applied Mathematics, vol. 26,
no. 4, pp. 787–793, 1974.
[5] M.S.Waterman,T.F.Smith,andW.A.Beyer,“Somebiologi-
cal sequence metrics,” Advances in Mathematics, vol. 20, no. 3,
pp. 367–387, 1976.
[6] M. O. Dayhoff,R.M.Schwartz,andB.C.Orcutt,“Amodelof
evolutionary change in proteins,” in Atlas of Protein Sequence
and Structure,M.O.Dayhoff, Ed., vol. 5, supplement 3, pp.
345–352, National Biomedical Research Foundation, Wash-
ington, DC, USA, 1978.
[7] S. F. Altschul, “Amino acid substitution matrices from an in-
formation theoretic perspective,” Journal of Molecular Biology,
vol. 219, no. 3, pp. 555–565, 1991.
[8] S. Karlin and S. F. Altschul, “Methods for assessing the statis-
tical significance of molecular sequence features by using gen-
eral scoring schemes,” Proceedings of the National Academy of
Sciences of the United States of America, vol. 87, no. 6, pp. 2264–
2268, 1990.
[9] S. Henikoff andJ.G.Henikoff, “Amino acid substitution
matrices from protein blocks,” Proceedings of the National
Academy of Sciences of the United States of America, vol. 89,
no. 22, pp. 10915–10919, 1992.
[10] W. Feller, An Introduction to Probability and Its Applications,
John Wiley & Sons, New York, NY, USA, 1968.
[11] Y K.Yu,J.C.Wootton,andS.F.Altschul,“Thecompositional
adjustment of amino acid substitution matrices,” Proceedings
of the National Academy of Sciences of the United States of Amer-
ica, vol. 100, no. 26, pp. 15688–15693, 2003.
[12] S. F. Altschul, “A protein alignment scoring system sensitive
at all evolutionary distances,” Journal of Molecular Evolution,
vol. 36, no. 3, pp. 290–300, 1993.
[13] D. J. States, W. Gish, and S. F. Altschul, “Improved sensitiv-
ity of nucleic acid database searches using application-specific
scoring matrices,” Methods, vol. 3, no. 1, pp. 66–70, 1991.
[14] S. R. Sunyaev, G. A. Bogopolsky, N. V. Oleynikova, P. K.
Vlasov, A. V. Finkelstein, and M. A. Roytberg , “From analy-
sis of protein structural alignments toward a novel approach
to align protein sequences,” Proteins: Structure, Function, and
Bioinformatics, vol. 54, no. 3, pp. 569–582, 2004.
18 EURASIP Journal on Bioinformatics and Systems Biology
[15] M. A. Zachariah, G. E. Crooks, S. R. Holbrook, and S. E.
Brenner, “A generalized affine gap model significantly im-
proves protein sequence alignment accuracy,” Proteins: Struc-
ture, Function, and Bioinformatics, vol. 58, no. 2, pp. 329–338,
2005.
[16] C. E. Shannon, “A mathematical theory of communication—
part I,” Bell System Technical Journal, vol. 27, pp. 379–423,
1948.
[17] C. E. Shannon, “A mathematical theory of communication—
part II,” Bell System Technical Journal, vol. 27, pp. 623–656,
1948.
[18] I. Csisz
´
ar and J. K
¨
orner, Information Theory: Coding Theorems
for Discrete Memoryless Systems, Academic Press, New York,
NY, USA, 1981.
[19] A. A. Sch
¨
affer, L. Aravind, T. L. Madden, et al., “Improving
the accuracy of PSI-BLAST protein database searches with
composition-based statistics and other refinements,” Nucleic
Acids Research, vol. 29, no. 14, pp. 2994–3005, 2001.
[20] F. Frommlet, A. Futschik, and M. Bogdan, “On the significance
of sequence alignments when using multiple scoring matri-
ces,” Bioinformatics, vol. 20, no. 6, pp. 881–887, 2004.
[21]S.F.Altschul,J.C.Wootton,E.M.Gertz,etal.,“Protein
database searches using compositionally adjusted substitution
matrices,” FEBS Journal, vol. 272, no. 20, pp. 5101–5109, 2005.
[22] A. A. Sch
¨
affer, Y. I. Wolf, C. P. Ponting, E. V. Koonin,
L. Aravind, and S. F. Altschul, “IMPALA: matching a pro-
tein sequence against a collection of PSI-BLAST-constructed
position-specific score matrices,” Bioinformatics, vol. 15,
no. 12, pp. 1000–1011, 1999.
[23] W. R. Rypniewski, A. Perrakis, C. E. Vorgias, and K. S. Wilson,
“Evolutionary divergence and conservation of trypsin,” Pro-
tein Engineering, vol. 7, no. 1, pp. 57–64, 1994.
[24] A. L. Hughes, “Evolutionary diversification of the mammalian
defensins,” Cellular and Molecular Life Sciences, vol. 56, no. 1-
2, pp. 94–103, 1999.
[25] F. Bauer, K. Schweimer, E. Kl
¨
uver, et al., “Structure determi-
nation of human and murine β-defensins reveals structural
conservation in the absence of significant s equence similarit y,”
Protein Science, vol. 10, no. 12, pp. 2470–2479, 2001.
[26] A. Tossi and L. Sandri, “Molecular diversity in gene-encoded,
cationic antimicrobial polypeptides,” Current Pharmaceutical
Design, vol. 8, no. 9, pp. 743–761, 2002.
[27] R. Gennaro, M. Zanetti, M. B enincasa, E. Podda, and M. Mi-
ani, “Pro-rich antimicrobial peptides from animals: structure,
biological functions and mechanism of action,” Current Phar-
maceutical Design, vol. 8, no. 9, pp. 763–778, 2002.
[28] M. E. Selsted, M. J. Novotny, W. L. Morris, Y Q. Tang, W.
Smith, and J. S. Cullor, “Indolicidin, a novel bactericidal
tridecapeptide amide from neutrophils,” Journal of Biological
Chemistry, vol. 267, no. 7, pp. 4292–4295, 1992.
[29] S. Kullback, Information Theory and Statistics, Dover, Mineola,
NY, USA, 1997.