Báo cáo hóa học: " Research Article Gene Systems Network Inferred from Expression Profiles in Hepatocellular Carcinogenesis by Graphical Gaussian Model" pptx
Bạn đang xem bản rút gọn của tài liệu. Xem và tải ngay bản đầy đủ của tài liệu tại đây (685.41 KB, 11 trang )
Hindawi Publishing Corporation
EURASIP Journal on Bioinformatics and Systems Biology
Volume 2007, Article ID 47214, 11 pages
doi:10.1155/2007/47214
Research Article
Gene Systems Network Inferred from Expression Profiles in
Hepatocellular Carcinogenesis by Graphical Gaussian Model
Sachiyo Aburatani,
1
Fuyan Sun,
1
Shigeru Saito,
2
Masao Honda,
3
Shu-ichi Kaneko,
3
and
Katsuhisa Horimoto
1
1
Biological Network Team, Computational Biology Research Center (CBRC), National Institute of Advanced
Industrial Science and Technology (AIST), 2-42 Aomi, Koto-ku, Tokyo 135-0064, Japan
2
Chemo & Bio Informatics Department, INFOCOM CORPORATION, Mitsui Sumitomo Insurance Surugadai Annex Building,
3-11, Kanda-Surugadai, Chiyoda-ku, Tokyo 101-0062, Japan
3
Department of Gastroenterology, Graduate School of Medical Science, Kanazawa University, 13-1 Takara-machi, Kanazawa,
Ishikawa 920-8641, Japan
Received 28 June 2006; Revised 27 February 2007; Accepted 1 May 2007
Recommended by Paul Dan Cri stea
Hepatocellular carcinoma (HCC) in a liver with advanced-stage chronic hepatitis C (CHC) is induced by hepatitis C virus, which
chronically infects about 170 million people worldwide. To elucidate the associations between gene groups in hepatocellular car-
cinogenesis, we analyzed the profiles of the genes characteristically expressed in the CHC and HCC cell stages by a statistical
method for inferring the network between gene systems based on the graphical Gaussian model. A systematic evaluation of the
inferred network in terms of the biological knowledge revealed that the inferred network was strongly involved in the known gene-
gene interactions with high significance (P<10
−4
), and that the clusters characterized by different cancer-related responses were
associated with those of the gene groups related to metabolic pathways and morphological events. Although some relationships in
the network remain to be interpreted, the analyses revealed a snapshot of the orchestrated expression of cancer-related groups and
some pathways related with metabolisms and morphological events in hepatocellular carcinogenesis, and thus provide possible
clues on the disease mechanism and insights that address the gap between molecular and clinical assessments.
Copyright © 2007 Sachiyo Aburatani et al. This is an open access article distributed under the Creative Commons Attribution
License, which permits unrestricted use, distribution, and reproduction in any medium, provided the original work is properly
cited.
1. INTRODUCTION
Hepatitis C virus (HCV) is the major etiologic agent of non-
A non-B hepatitis, and chronically infects about 170 million
people worldwide [1–3]. Many HCV carriers develop chronic
hepatitis C (CHC), and finally are afflicted with hepatocel-
lular carcinoma (HCC) in livers with advanced-stage CHC.
Thus, the CHC and HCC cell stages are essential in hepato-
cellular carcinogenesis.
To elucidate the mechanism of hepatocellular carcino-
genesis at a molecular level, many experiments have been
performed from various approaches. In particular, recent
advances in techniques to monitor simultaneously the ex-
pression levels of genes on a genomic scale have facilitated
the identification of genes involved in the tumorigenesis
[4]. Indeed, some relationships between the disease and the
tumor-related genes were proposed from the gene expres-
sion analyses [5–7]. Apart from the relationship between
tumor-related genes and the disease at the molecular level,
the information about the pathogenesis and the clinical char-
acteristics of hepatocellular carcinogenesis has accumulated
steadily [8, 9]. However, there is a gap between the infor-
mation about hepatocellular carcinogenesis at the molecu-
lar level and that at more macroscopic levels, such as the
clinical level. Furthermore, the relationships between tumor-
related genes and other genes also remain to be investigated.
Thus, an approach to describe the perspective of carcinogen-
esis from measurements at the molecular level is desirable to
bridge the gap between the information at the two different
levels.
Recently, we have developed an approach to infer a regu-
latory network, which is based on graphical Gaussian model-
ing (GGM) [10, 11]. Graphical Gaussian modeling is one of
the graphical models that includes the Boolean and Bayesian
models [12, 13]. Among the graphical models, GGM has the
simplest structure in a mathematical sense; only the inverse
2 EURASIP Journal on Bioinformatics and Systems Biology
of the correlation coefficient between the variables is needed,
and therefore, GGM can be easily applied to a wide variety
of data. However, straightforward applications of statistical
theory to practical data fail in some cases, and GGM also
fails frequently when applied to gene expression profiles; here
the expression profile indicates a set of the expression de-
grees of one gene, measured under various conditions. This
is because the profiles often share similar expression pat-
terns, which indicate that the correlation coefficient matrix
between the genes is not regular. Thus, we have devised a pro-
cedure, named ASIAN ( automatic system for inferring a net-
work), to apply GGM to gene expression profiles, by a combi-
nation of hierarchical clustering [14]. First, the large number
of profiles is grouped into clusters, according to the standard
approach of profile analysis [15]. To avoid the generation
of a nonregular correlation coefficient matrix from the ex-
pression profiles, we adopted a stopping rule for hierarchical
clustering [10]. Then, the relationship between the clusters is
inferred by GGM. Thus, our method generates a framework
of gene regulatory relationships by inferring the relationships
between the clusters [11, 16], and provides clues toward es-
timating the global relationships between genes on a large
scale.
Methods for extracting biological knowledge from large
amounts of literature and arranging it in terms of gene
function have been developed. Indeed, ontologies have been
made available by the gene ontology (GO) consortium [17]
to construct a functional categorization of genes and gene
products, and by using the GO terms, the software deter-
mines whether any GO terms annotate a specified list of
genes at a frequency greater than that expected by chance
[18]. Further m ore, various software applications, most of
which are commercial software, such as MetaCore from
GeneGo have been developed for
the navigation and analysis of biological pathways, gene reg-
ulation networks, and protein interaction maps [19]. Thus,
advances in the processing of biological knowledge have
enabled us to correspond to the results of gene expres-
sion analyses for a large amount of data with the biological
functions.
In this study, we analyzed the gene expression profiles
from the CHC and HCC cell stages, by ASIAN based on the
graphical Gaussian Model, to reveal the framework of gene
group associations in hepatocellular carcinogenesis. For this
purpose, first, the genes characteristically expressed in hep-
atocellular carcinogenesis were selected, and then, the pro-
files of the genes thus selected were subjected to the associ-
ation inference method. In addition to the association in-
ference, which was presented by the network between the
clusters, the network was further interpreted systematically
by the biological knowledge of the gene interactions and by
the functional categories with GO terms. The combination
of the statistical network inference from the profiles with the
systematic network inter pretation by the biological knowl-
edge in the literature provides a snapshot of the orchestration
of gene systems in hepatocellular carcinogenesis, especially
for bridging the gap between the information on the disease
mechanisms at the molecular level and at more macroscopic
levels.
2. MATERIALS AND METHODS
2.1. Gene selection
We selected the up- and downregulated genes characteristi-
cally expressed in the CHC and HCC stages, as a prerequi-
site for defining the variables in the network inference by
the graphical Gaussian modeling. This involved the follow-
ing steps. (1) The averages and the standard deviations in the
respective conditions, AV
j
and SD
j
,for j = 1, , N
c
,arecal-
culated. (2) The expression degree of the ith gene in the jth
condition, e
ij
, is compared with |AV
j
± SD
j
|.(3)Thegene
is regarded as a characteristically expressed gene, if the num-
ber of conditions that e
ij
≥|AV
j
± SD
j
| is more than N
c
/2.
Although the criterion for a characteristically expressed gene
is usually
|AV
j
± 2SD
j
|, the present s election procedure de-
scribed above is simply designed to gather as many charac-
teristically expressed genes as possible, and is suitable to cap-
ture a macroscopic relationship between the gene systems es-
timated by the follow ing cluster analysis.
2.2. Gene systems network inference
The present analysis is composed of three parts: first, the pro-
files selected in the preceding section are subjected to the
clustering analysis with the automatic determination of clus-
ter number, and then the profiles of clusters are subjected
to the graphical Gaussian modeling. Finally, the network in-
ferred by GGM is rearranged according to the magnitude of
partial correlation coefficients, which can be regarded as the
association strength, between the clusters. The details of the
analysis are as follows.
2.2.1. Clustering with automatic determination
of cluster number
In clustering the gene profiles, here, the Euclidian distance
between Pearson’s correlation coefficients of profiles and
the unweighted pair group method using arithmetic aver-
age (UPGMA or group average method) were adopted as the
metric and the technique, respectively, with reference to the
previous analyses by GGM [11, 16]. In particular, the present
metric between the two genes is designed to reflect the simi-
larity in the expression profile patterns between other genes
as well as between the measured conditions, that is,
d
ij
=
n
l=1
r
il
− r
jl
2
,(1)
where n is the total number of the genes, and r
ij
is the Pear-
son correlation coefficient between the i and j genes of the
expression profiles that are measured at N
c
conditions, p
ik
,
(k
= 1, 2, , N
c
):
r
ij
=
l
k
=1
p
ik
− p
i
·
p
jk
− p
j
l
k=1
p
ik
− p
i
2
·
l
k=1
p
jk
− p
j
2
,(2)
where
p
i
is the arithmetic average of p
ik
over N
c
conditions.
Sachiyo Aburatani et al. 3
In the cluster number estimation, various stopping r u les
for the hierarchical clustering have been developed [20]. Re-
cently, we have developed a method for estimating the clus-
ter number in the hierarchical clustering, by considering the
following application of the graphical model to the clusters
[10]. In our approach, the variance inflation factor (VIF) is
adopted as a stopping rule, and is defined by
VIF
i
= r
−1
ii
,(3)
where r
−1
ii
is the ith diagonal element of the inverse of the
correlation c oefficient matrix between explanatory variables
[21]. In the cluster number determination, the popular cutoff
value of 10.0 [21] was adopted as a threshold in the present
analysis, also with reference to the previous analyses.
After the cluster number determination, the average ex-
pression profiles are calculated for the members of each clus-
ter, and then the average correlation coefficient matrix be-
tween the clusters is calculated from them. Finally, the av-
erage correlation coefficient matrix between the clusters is
subjected to the graphical Gaussian modeling. Note that the
average coefficient correlation matrix avoids the difficulty
of the above numerical calculation, due to the distinctive
patterns of the average expression profiles of clusters. This
means that the GGM works well for the average coefficient
correlation matrix.
2.2.2. Graphical Gaussian modeling
The concept of conditional independence is fundamental to
graphical Gaussian modeling (GGM). The conditional inde-
pendence structure of the data is characterized by a condi-
tional independence graph. In this graph, each variable is
represented by a vertex, and two vertices are connected by
an edge if there is a direct association between them. In con-
trast, a pair of vertices that are not connected in the graph is
conditionally independent.
In the procedure for applying the GGM to the profile data
[11], a graph, G
= (V, E), is used to represent the relation-
ship among the M clusters, where V is a finite set of nodes,
each corresponding to one of the M clusters, and E is a fi-
nite set of edges between the nodes. E consists of the edges
between cluster pairs that are conditionally dependent. T he
conditional independence is estimated by the partial correla-
tion coefficient, expressed by
r
i, j|rest
=−
r
ij
√
r
ii
√
r
jj
,(4)
where r
ij|rest
is the partial correlation coefficient between
variables i and j, given the rest variables, and r
ij
is the (i, j)
element in the reverse of the correlation coefficient matrix.
In order to evaluate which pair of clusters is condition-
ally independent, we applied the covariance selection [22],
which was attained by the stepwise and iterative algorithm
developed by Wermuth and Scheidt [23]. The algorithm is
presented as Algorithm 1.
The graph obtained by the above procedure is an undi-
rected graph, which is called an independence graph. The in-
Step 1. Prepare a complete graph of G(0) = (V, E). The nodes
correspond to M clusters. All of the nodes are connected. G(0)
is called a full model. Based on the expression profile data, con-
struct an initial correlation coefficient matrix C(0).
Step 2. Calculate the partial correlation coefficient matrix
P(τ) from the correlation coefficient matrix C(τ). τ indicates
the number of the iteration.
Step 3. Find an element that has the smallest absolute value
among all of the nonzero elements of P(τ). Then, replace the
element in P(τ)withzero.
Step 4. Reconstruct the correlation coefficient matrix, C(τ +
1), from P(τ). In C(τ + 1), the element corresponding to the
element set to zero in P(τ) is revised, while all of the other
elements are left to be the same as those in C(τ).
Step 5. In the Wermuth and Sheidt algorithm, the termination
of the iteration is judged by the “deviance” values. Here, we
used two types of deviance, dev1 and dev2, with the following:
dev1
= N
c
log
C(τ +1)
C(0)
,
dev2
= N
c
log
C(τ +1)
C(τ)
.
(5)
Calculate dev1 and dev2. The two deviances follow an asymp-
totic χ
2
distribution with a degree of freedom = n,andthat
with a degree of freedom
= 1, respectively. n is the number of
elements that are set to zero until the (τ +1)thiteration.Inour
approach, n is equal to (τ +1).
|C(τ)| indicates the determi-
nant of C(τ). N
c
is the number of different conditions under
which the expression levels of M clusters are measured.
Step 6. If the probability value corresponding to dev1
≤ 0.05,
or the probability value corresponding to dev2
≤ 0.05, then
the model C(τ + 1) is rejected, and the iteration is stopped.
Otherwise, the edge between a pair of clusters with a part ial
correlation coefficient set to zero in P(τ) is omitted from G(τ)
to generate G(τ +1),andτ is increased by 1. Then, go to
Step 1.
Algorithm 1
dependence graph represents which pair of clusters is con-
ditionally independent. That is, when the partial correlation
coefficient for a cluster pair is equal to 0, the cluster pair is
conditionally independent, and the relationship is expressed
as no edge between the nodes corresponding to the clusters
in the independence graph.
The genes grouped into each cluster are expected to share
similar biological functions, in addition to the regulatory
mechanism [24]. Thus, a network between the clusters can
be approximately regarded as a network between gene sys-
tems, each with similar functions, from a macroscopic view-
point. Note that the number of connections in one vertex is
not limited, while it is only one in the cluster analysis. This
4 EURASIP Journal on Bioinformatics and Systems Biology
feature of the network reflects the multiple relationships of a
gene or a gene group in terms of the biological function.
2.2.3. Rearrangement of the inferred network
When there are many edges, drawing them all on one graph
produces a mess or “spaghetti” pattern, which would be dif-
ficult to read. Indeed, in some examples of the application
of GGM to actual profiles, the intact networks by GGM still
showed complicated forms with many edges [11, 16]. Since
the magnitude of the partial correlation coefficient indicates
the strength of the association between clusters, the intact
network can be rearranged according to the partial corre-
lation coefficient value, to inter pret the association between
clusters. The strength of the association can be assigned by
a standard test for the partial correlation coefficient [25]. By
Fisher’s Z transformation of partial correlation coefficients,
that is,
Z
=
1
2
log
1+r
ij·rest
1 − r
ij·rest
,(6)
Z is approximately distributed according to the following
normal distribution:
N
1
2
log
1+r
ij·rest
1 − r
ij·rest
,
1
N
c
− (M − 2)
−
3
,(7)
where N
c
and M are the number of conditions and the num-
ber of clusters, respectively. Thus, we can statistically test the
observed correlation coefficients under the null hypothesis
with a significance probability.
2.3. Statistical significance of the inferred network
with the biological knowledge
The inferred network can be statistically evaluated in terms
of the gene-gene interactions. The chance probability was es-
timated by the correspondence between the inferred cluster
network and the infor mation about gene interactions. The
following steps were used. (1) The known gene pairs with
interactions in the database were overlaid onto the inferred
network. (2) The number of cluster pairs, upon which the
gene interactions were overlaid, was counted. (3) The chance
probability, in which the cluster pairs connected by the estab-
lished edges in the network were found in all possible pairs,
was calculated by using the following equation:
P
= 1 −
f −1
i=0
g
i
N −g
n
− i
N
n
,(8)
where N is the number of possible cluster pairs in the net-
work, n is the number of cluster pairs with edges in the in-
ferred network, f is the number of cluster pairs with edges
in the inferred network, including the known gene pairs with
interactions, and g is the number of cluster pairs, including
the known gene pairs with interactions.
2.4. Evaluation of the inferred network in terms of
the biological knowledge
The inferred network can be evaluated in terms of the bi-
ological knowledge. For this purpose, we characterize the
clusters by GO terms, and overlay the knowledge about
the gene interactions onto the network. For this purpose,
we first use GO::TermFinder [18] to characterize the clus-
ters by GO terms with the user-defined significance prob-
ability ( mFinder). Then,
Pathway Studio [19] is used to survey the biological informa-
tion about the gene interactions between the selected genes.
2.5. Software
All calculations of the present clustering and GGM were per-
formed by the ASIAN web site [26, 27](eka.
cbrc.jp/asian) and “Auto Net Finder,” the commercialized
PC version of ASIAN, from INFOCOM CORPORATION,
Toky o, Ja p an ( />2.6. Expression profile data
The expression profiles of 8516 genes were monitored in 27
CHC samples and 17 HCC samples [28].
3. RESULTS AND DISCUSSION
3.1. Clustering
Among the 8516 genes with expression profiles that were
measured in the previous studies [28], 661 genes were se-
lected as those characteristically expressed in the CHC and
HCC stages. As a preprocessing step for the association in-
ference, the genes thus selected were automatically divided
into 18 groups by ASIAN [26, 27]. Furthermore, each cluster
was characterized in terms of the GO terms, which define the
macroscopic features of the cluster in terms of the biological
function.
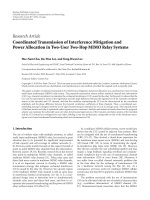
Figure 1 shows the dendrogram of clusters, together with
their expression patterns. As seen in Figure 1, the genes were
grouped into 18 clusters, in terms of the number of mem-
bers and the expression patterns in the clusters. The average
number of cluster members was 36.7 genes (SD, 14.2), and
the maximum and minimum numbers of members were 69
in cluster 14 and 18 in cluster 9, respectively. As for the ex-
pression pattern, five clusters (10, 12, 14, 15, and 18) and
ten clusters (1–7, 9, 16, and 17) were composed of up- and
downregulated genes, respectively, and three clusters (8, 11,
and 13) showed similar mixtures of up- and downregulated
genes.
Tab le 1 shows the GO terms for the clusters (clus-
terGOB), which characterized them well (see details at
/>∼horimoto/HCGO.pdf). Among the 661
genes analyzed in this study, 525 genes were characterized by
the GO terms, and among the 18 clusters, 11 clusters were
characterized by GO terms with P<.05. In addition, 188
genes (28.3% of all characterized genes) corresponded to the
GO terms listed in Tab le 1 . As seen in the table, although
Sachiyo Aburatani et al. 5
most clusters are characterized by several GO terms, reflect-
ing the fact that the genes function generally in multiple
pathways, the clusters are not composed of a mixture of genes
with distinctive functions. For example, cluster 2 is charac-
terized by 10 terms, and most of the terms are related to
the energy metabolism. Thus, the GO terms in the respective
clusters share similar features of biological functions, which
cause the hierarchical structure of the GO term definitions.
In Table 1, most of the clusters characterized by GO
terms with P<.05 are related to response function and to
metabolism. Clusters 1, 6, 8, 12, and 13 are characterized by
GO terms related to different responses, and clusters 2, 3, 4,
and 7 are characterized by GO terms related to different as-
pects of metabolism. Although the genes in two clusters, 14
and 16, did not adhere to this dichotomy, the genes charac-
teristically expressed in HCC in the above nine clusters were
related to the responses and the metabolic pathways. As for
the remaining clusters with lower significance, three clusters
(9, 10, and 11) were also characterized by response functions,
and four clusters (5, 15, 17, and 18) were related to morpho-
logical events at the cellular level. Note that none of the clus-
ters characterized by cellular level events attained the signifi-
cance level. This may be because the genes related to cellular
level events represent only a small fraction of genes relative
to all genes with known functions, in comparison with the
genes related to molecular level events in the definition of
GO terms.
It is interesting to determine the correspondence between
the up- and downregulated genes and the GO terms in the
clusters. In the five clusters of upregulated genes, clusters 10
and 12 were characterized by different responses, and two
clusters were characterized by morphological events, which
were the categories of “cell proliferation” in cluster 15 and of
“development” in cluster 18. The remaining cluster, 14, was
characterized by regulation, development, and metabolism.
As for the clusters of downregulated genes, four of the ten
clusters were characterized by GO terms related to various
aspects of metabolism. In the remaining six clusters, three
clusters were characterized by GO terms related to responses,
two clusters were characterized by morphological events, and
one cluster was characterized by mixed categories.
In summary, the present gene selection and the follow-
ing automatic clustering produced a macroscopic view of
gene expression in hepatocellular carcinogenesis. Although
the clusters contain many genes that do not always share the
same functions, the clusters were characterized by their re-
sponses, morphological events, and metabolic aspects from
a macroscopic viewpoint. The clusters of upregulated genes
were characterized by the former two categories, and those
of the downregulated genes represented all three categor ies.
Thus, the present clustering serves to interpret the network
between the clusters in terms of the biological function and
the gene expression pattern.
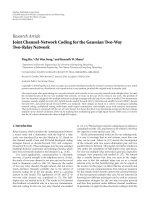
3.2. Known gene interactions in the inferred network
The association between the 18 clusters inferred by GGM is
shown in Figure 2. In the intact network by ASIAN, 96 of 153
possible edges between 18 clusters (about 63%) were estab-
10 (38)
11 (31)
12 (30)
13 (56)
8 (32)
9 (18)
4 (25)
5 (24)
17 (24)
14 (69)
15 (28)
18 (28)
16 (50)
6 (42)
7 (48)
1 (32)
2 (59)
3 (27)
Figure 1: Dendrogram of genes and profiles. The dendrogram was
constructed by hierarchical clustering with the metric of the Euclid-
ian distances between the correlation coefficients and the UPGMA.
The blue line on the dendrogram indicates the cluster boundary es-
timated automatically by ASIAN. The gene expression patterns of
the respective clusters in the CHC and HCC stages are shown by
the degree of intensity: the red and green colors indicate relatively
higher and lower intensities. The cluster number and the number of
member genes in each cluster (in parentheses) are denoted on the
right side of the figure.
lished by GGM. Since the intact network is still messy, the
network was rearr a nged to interpret its biological meaning
by extracting the relatively strong associations between the
clusters, according to the procedure in Section 2.2.3.After
the rearrangement, 34 edges remained by the statistical test
of the partial correlation coefficients with 5% significance.
In the rearranged network, all of the clusters were nested,
but each cluster was connected to a few other clusters. In-
deed, the average number of edges per cluster was 2.3, and
the maximum and minimum numbers of edges were seven
in cluster 15 and one in cluster 9, respectively. In particular,
the numbers of edges are not proportional to the numbers
of constituent genes in each cluster. For example, while the
numbers of genes in clusters 15 and 17 are equal to each other
(24 genes), the number of edges from cluster 15 (2 edges) dif-
fers from that from cluster 17 (5 edges). Thus, the number of
edges does n ot depend on the number of genes belonging to
the cluster, but rather on the gene associations between the
cluster pairs.
6 EURASIP Journal on Bioinformatics and Systems Biology
To test the validity of the inferred network in terms of
biological function, the biological knowledge about the gene
interactions is overlaid onto the inferred network. For this
purpose, all of the gene pairs belonging to cluster pairs are
surveyed by Pathway Assist, which is a database for bio-
logical knowledge about molecular interactions, compiled
based on the gene ontology [17]. Among the 661 genes an-
alyzed in this study, the interactions between 90 gene pairs
were detected by Pathway Assist, and 50 of these pairs were
found in Figure 2. Notice that the number of gene pairs re-
ported in the literature does not directly reflect the impor-
tance of the gene interactions, and instead is highly depen-
dent on the number of scientists who are studying at the cor-
responding genes. Thus, we counted the numbers of clus-
ter pairs in which at least one gene pair was known, by
projecting the gene pairs with known interactions onto the
network. By this projection, the interactions were found in
35 (g in the equation of Section 2.3) cluster pairs among
153 (N) possible pairs (see details of the gene pair projection
at />∼horimoto/GPPN.pdf). Then, 19 ( f )
of the 35 cluster pairs were overlapped with 34 (n)cluster
pairs in the rearranged network. The chance probability that
a known interaction was found in the connected cluster pairs
in the rearranged network was calculated as P<10
−4.3
.Thus,
the rearranged network faithful ly captures the known inter-
actions between the constituent genes.
Furthermore, the genes with known interactions were
corresponded to the genes responsible for the GO terms of
each cluster, as shown in Table 1. The genes responsible for
the GO terms were distributed over all cluster pairs, includ-
ing gene pairs with known interactions, except for only two
pairs, clusters 15 and 17, and 15 and 18. Thus, the network
can be interpreted not only by the known gene interactions
but also by the GO terms characterizing the clusters.
3.3. Gene systems network characterized by GO terms
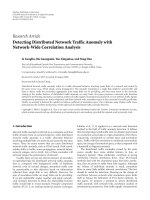
3.3.1. Coarse associations between the clusters
To elucidate the associations between the clusters, the clus-
ter associations with 1% significance probability were further
discriminated from those with 5% probability. This gener-
ated four groups of clusters, shown in Figure 3(a).
First, we will focus on the groups including the clus-
ters that were characterized by GO terms with a signifi-
cance probability, a nd that were definitely occupied by up-
or downregulated genes (clusters depicted by triangles with
bold lines in the figure). Groups I and III attained the above
criteria. In group I, the clusters were a mixture of the clusters
of the up- and downregulated genes. Note that three of the
six clusters were composed of upregulated genes, which were
characterized by responses (cluster 12), mixed categories
(cluster 14), and morphological events (cluster 15). In group
III, all three clusters were of downregulated genes. One clus-
ter was characterized by responses, and two were character-
ized by amino-acid-related metabolism. In contrast, groups
II and IV were composed of the clusters that were somewhat
inadequately characterized by GO terms and expression pat-
terns. Thus, groups I and III provide the characteristic fea-
tures about the orchestration of gene expression in hepato-
cellular carcinogenesis.
Secondly, a coarse grinning for group associations pro-
vides another viewpoint, shown in Figure 3(b). When the
groups with at least one edge between the clusters in the re-
spective groups were presented, regardless of the number of
edges, groups I, II, and IV were nested, and group III was
connected with only group I. In the second view, group I,
which includes three of the five clusters of upregulated genes
in all clusters, was a ssociated with all of the other groups.
This suggests that group I represents a positive part of the
gene expression in hepatocellular carcinogenesis, which is
consistent with the interpretation by the first view, from the
significant GO terms and the clear expression patterns. Inter-
estingly, among the clusters character ized by morphological
events (clusters 5, 15, 17, and 18), three of the four clusters
were distributed over groups I, II, and IV, and the distribu-
tion was consistent with the nested groups. This suggests that
the upregulated genes of the clusters in group I are responsi-
ble for the events at the cellular level.
Thirdly, the clusters not belonging to the four groups
were clusters 1, 3, and 5. Clusters 1, 3, and 5 were directly
connected with groups I, III, and IV, groups I and III, and
group IV, respectively. Interestingly, cluster 1, characterized
by only “anti-inflammatory response,” was connected with
five clusters belonging to three groups, in which four clus-
ters were downregulated clusters. Although cluster 5 was not
clearly characterized by the GO terms, cluster 3 was charac-
terized by metabolic terms that were quite similar to those
for cluster 2, a downregulated cluster. Thus, the three clus-
ters may be concerned with downregulation in hepatocellu-
lar carcinogenesis.
3.3.2. Interpretations of the inferred network
in terms of pathogenesis
The coarse associations between the clusters in the preceding
section can be interpreted on the macroscopic level, such as
the patholog ical level. The inter pretation of the network in-
ferred based on the information at the molecular level will be
useful to bridge the gap between the information about the
disease mechanisms at the molecular and more macroscopic
levels.
One of the most remarkable associations is found in
group I. Cluster 12, with upregulation, was associated at a
1% significance level with cluster 2, with downregulation.
The former cluster is characterized by the GO terms related
to the immune response, and the latter is characterized by
those involved w ith metabolism. In general, CHC and HCC
result in serious damage to hepatocytes, which are important
cells for nutrient metabolism, and the damage induces dif-
ferent responses. Indeed, HCC is a suitable target for testing
active immunotherapy [29]. Furthermore, cluster 2 was a lso
associated at a 1% significance level with cluster 14, char-
acterized by prostaglandin-related terms. This may reflect
the fact that one mediator of inflammation, prostaglandin,
shows elevated expression in human and animal HCCs [30].
Thus, the associations in group I are involved in the molecu-
lar pathogenesis of the CHC and HCC stages.
Sachiyo Aburatani et al. 7
Table 1: Cluster characterization by GO terms
#
.
Cluster no. GO no. Category P-value
Fraction
1 GO:0030236 Anti-inflammatory response 0.18% 2 of 22/6 of 26081
2 GO:0006094 Gluconeogenesis 0.06% 3 of 37/19 of 26081
2 GO:0006066 Alcohol metabolism 0.12% 6 of 37/312 of 26081
2 GO:0006091 Generation of precursor metabolites and energy 0.14% 9 of 37/961 of 26081
2 GO:0019319 Hexose biosynthesis 0.34% 3 of 37/33 of 26081
2 GO:0046165 Alcohol biosynthesis 0.34% 3 of 37/33 of 26081
2 GO:0046364 Monosaccharide biosynthesis 0.34% 3 of 37/33 of 26081
2 GO:0006067 Ethanol metabolism 0.48% 2 of 37/5 of 26081
2 GO:0006069 Ethanol oxidation 0.48% 2 of 37/5 of 26081
2 GO:0006629 Lipid metabolism 1.47% 7 of 37/722 of 26081
2 GO:0009618 Response to pathogenic bacteria 4.96% 2 of 37/15 of 26081
3 GO:0006094 Gluconeogenesis 0.61% 2 of 15/19 of 26081
3 GO:0019319 Hexose biosynthesis 1.87% 2 of 15/33 of 26081
3 GO:0046165 Alcohol biosynthesis 1.87% 2 of 15/33 of 26081
3 GO:0046364 Monosaccharide biosynthesis 1.87% 2 of 15/33 of 26081
3 GO:0009069 Serine family amino acid metabolism 4.49% 2 of 15/51 of 26081
4 GO:0006725 Aromatic compound metabolism 0.07% 4 of 20/140 of 26081
4 GO:0009308 Amine metabolism 0.38% 5 of 20/454 of 26081
4 GO:0006570 Tyrosine metabolism 0.59% 2 of 20/11 of 26081
4 GO:0050878 Regulation of body fluids 1.65% 3 of 20/113 of 26081
4 GO:0006950 Response to stress 2.70% 6 of 20/1116 of 26081
4 GO:0006519 Amino acid and derivative metabolism 4.12% 4 of 20/398 of 26081
4 GO:0007582 Physiological process 4.63% 20 of 20/17195 of 26081
5 GO:0006917 Induction of apoptosis
∗
16.06% 2 of 13/132 of 26081
5 GO:0012502 Induction of programmed cell death
∗
16.06% 2 of 13/132 of 26081
6 GO:0009613 Response to pest, pathogen, or parasite 0.00% 8 of 29/522 of 26081
6 GO:0043207 Response to external biotic stimulus 0.00% 8 of 29/557 of 26081
6 GO:0006950 Response to stress 0.00% 10 of 29/1116 of 26081
6 GO:0009605 Response to external stimulus 0.05% 10 of 29/1488 of 26081
6 GO:0006953 Acute-phase response 0.05% 3 of 29/25 of 26081
6 GO:0006955 Immune response 0.34% 8 of 29/1098 of 26081
6 GO:0006956 Complement activation 0.48% 3 of 29/52 of 26081
6 GO:0006952 Defense response 0.68% 8 of 29/1209 of 26081
6 GO:0050896 Response to stimulus 1.15% 11 of 29/2619 of 26081
6 GO:0009607 Response to biotic stimulus 1.65% 8 of 29/1372 of 26081
6 GO:0006629 Lipid metabolism 2.20% 6 of 29/722 of 26081
7 GO:0006559 L-phenylalanine catabolism 0.83% 2 of 31/9 of 26081
7 GO:0019752 Carboxylic acid metabolism 1.00% 6 of 31/590 of 26081
7 GO:0006082 Organic acid metabolism 1.02% 6 of 31/592 of 26081
7 GO:0006558 L-phenylalanine metabolism 1.26% 2 of 31/11 of 26081
7 GO:0009074 Aromatic amino acid family catabolism 1.26% 2 of 31/11 of 26081
7 GO:0006519 Amino acid and derivative metabolism 1.67% 5 of 31/398 of 26081
7 GO:0019439 Aromatic compound catabolism 1.79% 2 of 31/13 of 26081
7 GO:0006629 Lipid metabolism 3.04% 6 of 31/722 of 26081
7 GO:0009308 Amine metabolism 3.09% 5 of 31/454 of 26081
8 GO:0001570 Vasculogenesis 0.09% 2 of 21/4 of 26081
8 GO:0006950 Response to stress 0.42% 7 of 21/1116 of 26081
8 GO:0050896 Response to stimulus 2.33% 9 of 21/2619 of 26081
8 EURASIP Journal on Bioinformatics and Systems Biology
Table 1: Continued.
9 GO:0009611 Response to wounding
∗
11.19% 3 of 13/394 of 26081
10 GO:0009607 Response to biotic stimulus
∗
6.66% 6 of 19/1372 of 26081
11 GO:0050896 Response to stimulus
∗
72.68% 6 of 17/2619 of 26081
12 GO:0006955 Immune response 0.01% 8 of 18/1098 of 26081
12 GO:0006952 Defense response 0.01% 8 of 18/1209 of 26081
12 GO:0050874 Organismal physiological process 0.02% 10 of 18/2432 of 26081
12 GO:0009607 Response to biotic stimulus 0.03% 8 of 18/1372 of 26081
12 GO:0050896 Response to stimulus 0.39% 9 of 18/2619 of 26081
12 GO:0030333 Antigen processing 0.97% 3 of 18/108 of 26081
12 GO:0019882 Antigen presentation 2.62% 3 of 18/151 of 26081
12 GO:0019884 Antigen presentation, exogenous antigen 3.97% 2 of 18/32 of 26081
12 GO:0019886 Antigen processing, exogenous antigen via MHC class II 4.22% 2 of 18/33 of 26081
13 GO:0009611 Response to wounding 0.08% 6 of 30/394 of 26081
13 GO:0009613 Response to pest, pathogen, or parasite 0.38% 6 of 30/522 of 26081
13 GO:0043207 Response to external biotic stimulus 0.55% 6 of 30/557 of 26081
13 GO:0006955 Immune response 3.12% 7 of 30/1098 of 26081
13 GO:0006950 Response to stress 3.44% 7 of 30/1116 of 26081
13 GO:0050874 Organismal physiological process 3.98% 10 of 30/2432 of 26081
14 GO:0051244 Regulation of cellular physiological process 0.51% 8 of 45/665 of 26081
14 GO:0007275 Development 0.94% 13 of 45/2060 of 26081
14 GO:0001516 Prostaglandin biosynthesis 3.30% 2 of 45/9 of 26081
14 GO:0046457 Prostanoid biosynthesis 3.30% 2 of 45/9 of 26081
14 GO:0051242 Positive regulation of cellular physiological process 4.35% 5 of 45/289 of 26081
15 GO:0008283 Cell proliferation
∗
29.37% 4 of 26/488 of 26081
16 GO:0042221 Response to chemical substance 0.16% 5 of 31/237 of 26081
16 GO:0008152 Metabolism 1.29% 25 of 31/11891 of 26081
16 GO:0009628 Response to abiotic stimulus 1.89% 5 of 31/400 of 26081
16 GO:0006445 Regulation of translation 2.82% 3 of 31/87 of 26081
17 GO:0050817 Coagulation
∗
13.92% 2 of 12/118 of 26081
18 GO:0007275 Development
∗
11.67% 6 of 16/2060 of 26081
#
The gene ontology terms in each cluster, detected with 5% significance probability by using GO::TermFinder [18], are listed. When the terms with that
significance probability were not found in the cluster, the terms with the smallest probability were listed as indicated by an asterisk. In the last column, “Frac-
tion,” the numbers of genes b elonging to the corresponding category in the cluster, of genes belonging to the cluster, of genes belonging to the corresponding
category in all genes of the GO term data set, and of all genes are listed.
The associated clusters 4 and 7 in group III, which were
characterized by GO terms related to amino acid and lipid
metabolism, also show downregulation. Indeed, the prod-
ucts of dysregulated (aberrant regulation) metabolism are
widely used to examine liver function in common clinical
tests [8]. In addition, the connection between the clusters
in groups III and I implies that the downregulation of the
clusters in group III may be related to abnormal hepatocyte
function.
In addition, cluster 15 in group I, which is characterized
by the GO term “proliferation,” was associated with differ-
ent clusters in groups I, II, and IV. It is known that abnormal
proliferation is one of the obvious features of cancer [31].
This broad association may be responsible for the cellular
level events in hepatocellular carcinogenesis.
In summary, the inferred network reveals a coarse snap-
shot of the gene systems related to the molecular pathogene-
sis and clinical characteristics of hepatocellular carcinogene-
sis. Although the resolution of the network is still low, due to
the cluster network, the present network may provide some
clues for further investigations of the pathogenic relation-
ships involved in hepatocellular carcinoma.
3.3.3. Interpretations of the inferred network in terms of
gene-gene interactions
In addition to the macroscopic interpretations above, the
gene functionality from the gene-gene interactions listed
in Figure 2 is also discussed in the context of hepato-
cellular carcinoma. Although the consideration of gene-
gene interactions is beyond the aim of the present study,
Sachiyo Aburatani et al. 9
ALB-MTP
CYP2C9-CYP2C18
PLG-CPB2
THBD-CPB2
TF-CDH1
TF-HPX
CYP2E1-COL1A2
ALB-OCRL
GNG5-AEBP1
PRELP-SPARC
COL1A2-RFX5
HTATIP2-NME2
SHC1-MAP3K10
MAGED1-BIRC4
B2M- ARAF1
B2M-TIMP1
F8-VWF
ZFP36-VWF
B2M-RFX5
SDC2-CXCL12
DNCH1-CDKN2A
ASCL1-BMP4
CITED2-CDKN2A
FOS-ODC1
SPINK1-CTSB
VEGF-A2M
NTRK2-A2M
JUN-A2M
FBP1- MAN1A1
LPA-MAP2K1
CYP2E1-MAP2K1
ALB-BCHE
IGFBP3-IRS1
MAOA-MAOB
BAAT-NAT2
PCK1-PCK2
PLG-SERPINF2
THBD-SERPINF2
PLG-KLKB1
FOXA3-CYP3A4
AMBP-MAP2K1
CRAT-AR
SORL1-CSF2
DIABLO-HSPB1
VEGF-HSPB1
VEGF-THBS2
VEGF-CTF1
VEGF-CSF2
JUN-CSF2
JUN-WEE1
12
14
7
2
15
13
4
16
6
11
18
9
3
1
8
5
10
17
Figure 2: Network be tween clusters, together with a projection of biological knowledge about the gene interactions. The clusters are indicated by
triangles and circles, in which the cluster numbers correspond to those in Figure 1, and the edges between the clusters are associations with
5% significance probability. The red triangles, the green upside-down triangles, and the circles indicate the clusters of up- and downregulated
genes, and the mixture of them, respectively, and the dotted triangles indicate the clusters that were not characterized by GO terms with less
than 5% significance probability. The known gene interactions in Pathway Assist are indicated between the clusters, in which the genes
highlighted by bold letters are characterized by the GO terms in Tabl e 1.
some examples may provide possible clues about the disease
mechanisms.
First, we surveyed the frequencies of GO terms (gene-
GOB listed in the supplemental data at c
.jp/
∼horimoto/suppl/HCGO.pdf) in the selected genes
in the present analysis, to investigate the features of
gene-gene interactions in the inferred network. A few
generaltermsappearedfrequently,suchas“response”(122
times in the geneGOB column of the supplemental data
at />∼horimoto/suppl/HCGO.pdf)and
“metabolism” (183), as expected from the coarse associations
between the clusters in the preceding section. As for more
specific terms about the gene function, “lipid” (46), “apopto-
sis” (31), and “cell growth” (27) are remarkably found in the
list. The “lipid” is expected from the relationship between
groups I and III, and the “apoptosis” and the “cell growth”
are also expected from the frequent appearance of GO terms
(clusterGOB listed in Table 1) related to the morphological
events. Since the frequent appearance of “lipid” may be a
sensitive reflection of the protein-protein interactions in
lipid metabolic pathways to the expression profiles, here,
we focus on the gene-gene interactions characterized by the
“apoptosis” and the “cell growth.”
Among the gene-gene interactions listed in Figure 2, the
gene-gene interactions characterized by the cell growth or
death are found in the coarse associations between the clus-
ters. Group I contains the gene-gene interactions related to
apoptosis. The expression of HTAIP2 (HIV-1 Tat interactive
protein 2, 30 kd) in cluster 14 induces the expression of a
number of genes, including NME2 (nonmetastatic cells 2,
protein) in cluster 15 as well as the apoptosis-related genes
Bad and Siva [32]. MAGED1 (melanoma antigen, f amily
D, 1) in cluster 13, and its binding partner BIRC4 (bac-
uloviral IAP repeat-containing 4) in cluster 14 a re know n
to play some roles in apoptosis [33]. In addition, the ex-
pression of COL1A2 (collagen, type I, alpha 2) in clus-
ter 12, which is related to cell adhesion and skeletal devel-
opment, is regulated by RFX5 (regulatory factor X, 5) in
cluster 14 [29, 34]. In group IV, the expression of CSF2
(colony-stimulating factor 2) in cluster 8 is dependent on
the cooperation between NFAT (nuclear factor of activated
T cells) and JUN (Jun oncogene) in cluster 10 [35]. Be-
tween groups I and II, ASCL1 (achaete-scute complex-like
1) in cluster 13 and BMP4 (bone morphogenetic protein
4) in cluster 18 share the function of cell differentiation
[36].
As a result, the gene-gene interactions listed above are re-
lated to the mechanisms of cell growth or death at the molec-
ular level. On the other hand, the cluster associations reveal
the relationship between the cancer-induced events and var-
ious aspects of metabolisms at the pathogenesis and clinical
characteristics. Thus, the metabolic pathways might directly
10 EURASIP Journal on Bioinformatics and Systems Biology
Group IV
Group I
Group II
Group III
10
17
5
3
6
4
7
1
8
11
1412
2
16
15
13
9
18
(a)
IIIII
I
IV
(b)
Figure 3: Orchestration of gene sy s tems. (a) The association with
1% significance probability is indicated by a bold line, and the clus-
ters with 1% significance association are naturally divided into four
groups, which are enclosed by broken lines. (b) The connections
between the groups are drawn schematically, as a coarse grinning of
the cluster association.
influence the mechanisms of cancer-induced cell growth or
death at the molecular level in unknown ways.
3.4. Merits and pitfalls of the present approach
The present analysis reveals a framework of gene system as-
sociations in hepatocellular carcinogenesis. The inferred net-
work provides a bridge between the events at the molec-
ular level and those at macroscopic levels: the associations
between clusters characterized by cancer-related responses
and those characterized by metabolic and morphological
events can be interpreted from pathological and clinical
views. In addition, the viewpoint of the gene-gene interac-
tions in the inferred network indicates the relationship be-
tween cancer and cell growth/death. Thus, the gene systems
network may also be useful as a bridge between the gene-gene
interactions and the observations at macroscopic levels, such
as clinical tests.
The present method assumes linearity in the cluster asso-
ciations by using a partial correlation coefficient to identify
the independence between clusters. It is well known that the
interactions among genes and other molecular components
are often nonlinear, and the assumption of linearity misses
many important relationships among genes. In the present
study, our aim was not the inference of detailed gene-gene
interactions, but of coarse gene system interactions. Indeed,
the use of a partial correlation coefficient is employed as a
feasible approach for gene association inference as a fi rst ap-
proximation in some studies [37, 38]. Thus, the assumption
of the linearity is not suitable for a fine analysis of dynamic
gene behaviors, but may be useful for the approximate anal-
ysis of static gene associations.
ACKNOWLEDGMENTS
S. Aburatani was supported by a Grant-in-Aid for Scientific
Research (Grant 18681031) from the Ministry of Education,
Culture, Sports, Science, and Technology of Japan, and K.
Horimoto was partly supported by a Grant-in-Aid for Scien-
tific Research on Priority Areas “Systems Genomics” (Grant
18016008) and by a Grant-in-Aid for Scientific Research
(Grant 19201039) from the Ministry of Education, Culture,
Sports, Science, and Technology of Japan. This study was
supported in part by the New Energy and Industrial Tech-
nology Development Organization (NEDO) of Japan and by
the Ministr y of Health, Labour, and Welfare of Japan.
REFERENCES
[1] M. J. Alter, H. S. Margolis, K. Krawczynski, et al., “The natu-
ral history of community-acquired hepatitis C in the United
States. The sentinel counties chronic non-A, non-B hepatitis
study team,” The New England Journal of Medicine, vol. 327,
no. 27, pp. 1899–1905, 1992.
[2] A. M. Di Bisceglie, “Hepatitis C,” The Lancet, vol. 351,
no. 9099, pp. 351–355, 1998.
[3] S. Zeuzem, S. V. Feinman, J. Rasenack, et al., “Peginterferon
alfa-2a in patients with chronic hepatitis C,” The New England
Journal of Medicine, vol. 343, no. 23, pp. 1666–1672, 2000.
[4] S. S. Thorgeirsson, J S. Lee, and J. W. Grisham, “Molecular
prognostication of liver cancer: end of the beginning,” Journal
of Hepatology, vol. 44, no. 4, pp. 798–805, 2006.
[5] N.Iizuka,M.Oka,H.Yamada-Okabe,etal.,“Oligonucleotide
microarray for prediction of early intrahepatic recurrence of
hepatocellular carcinoma after curative resection,” The Lancet,
vol. 361, no. 9361, pp. 923–929, 2003.
[6] H. Okabe, S. Satoh, T. Kato, et al., “Genome-wide analysis
of gene expression in human hepatocellular carcinomas using
cDNA microarray: identification of genes involved in viral car-
cinogenesis and tumor progression,” Cancer Research, vol. 61,
no. 5, pp. 2129–2137, 2001.
[7] L H. Zhang and J F. Ji, “Molecular profiling of hepatocellular
carcinomas by cDNA microarray,” World Journal of Gastroen-
terology, vol. 11, no. 4, pp. 463–468, 2005.
[8] J. Jiang, P. Nilsson-Ehle, and N. Xu, “Influence of liver can-
cer on lipid and lipoprotein metabolism,” Lipids in Health and
Disease, vol. 5, p. 4, 2006.
[9] A. Zerbini, M. Pilli, C. Ferrari, and G. Missale, “Is there a role
for immunotherapy in hepatocellular carcinoma?” Digestive
and Liver Disease, vol. 38, no. 4, pp. 221–225, 2006.
[10] K. Horimoto and H. Toh, “Statistical estimation of cluster
boundaries in gene expression profile data,” Bioinformatics,
vol. 17, no. 12, pp. 1143–1151, 2001.
[11] H. Toh and K. Horimoto, “Inference of a genetic network by a
combined approach of cluster analysis and graphical Gaussian
modeling,” Bioinformatics, vol. 18, no. 2, pp. 287–297, 2002.
Sachiyo Aburatani et al. 11
[12] S. Lauritzen, Graphical Models, Oxford University Press, Ox-
ford, UK, 1996.
[13] J. Whittaker, Graphical Models in Applied Multivariate Statis-
tics, John Wiley & Sons, New York, NY, USA, 1990.
[14] H. Toh and K. Horimoto, “System for automatically inferring a
genetic network from expression profiles,” Journal of Biological
Physics, vol. 28, no. 3, pp. 449–464, 2002.
[15] D. K. Slonim, “From patterns to pathways: gene expression
data analysis comes of age,” Nature Genetics,vol.32,no.5,pp.
502–508, 2002.
[16] S. Aburatani, S. Kuhara, H. Toh, and K. Horimoto, “Deduction
of a gene regulatory relationship framework from gene expres-
sion data by the application of graphical Gaussian modeling,”
Signal Processing, vol. 83, no. 4, pp. 777–788, 2003.
[17] M. Ashburner, C. A. Ball, J. A. Blake, et al., “Gene ontology:
tool for the unification of biology,” Nature Genetics, vol. 25,
no. 1, pp. 25–29, 2000.
[18] E. I. Boyle, S. Weng , J. Gollub, et al., “GO::TermFinder—open
source software for accessing gene ontology information and
finding significantly enriched gene ontology terms associated
with a list of genes,” Bioinfor matics, vol. 20, no. 18, pp. 3710–
3715, 2004.
[19]A.Nikitin,S.Egorov,N.Daraselia,andI.Mazo,“Pathway
studio—the analysis and navigation of molecular networks,”
Bioinformatics, vol. 19, no. 16, pp. 2155–2157, 2003.
[20] L. Kaufman and P. J. Rousseeuw, Finding Groups in Data: An
Introduction to Cluster Analysis, John Wiley & S ons, New York,
NY, USA, 1990.
[21] R. J. Freund and W. J. Wilson, Regression Analysis: Statistical
Modeling of a Response Variable, Academic Press, San Diego,
Calif, USA, 1998.
[22] A. P. Dempster, “Covariance selection,” Biometrics, vol. 28,
no. 1, pp. 157–175, 1972.
[23] N. Wermuth and E. Scheidt, “Algorithm AS 105: fitting a
covariance selection model to a matrix,” Applied Stat istics,
vol. 26, no. 1, pp. 88–92, 1977.
[24] L. F. Wu, T. R . Hughes, A. P. Davierwala, M. D. Robinson, R.
Stoughton, and S. J. Altschuler, “Large-scale prediction of Sac-
charomyces cerevisiae gene function using overlapping tran-
scriptional clusters,” Nature Genetics, vol. 31, no. 3, pp. 255–
265, 2002.
[25] T. W. Anderson, An Introduction to Multivariate Statistical
Analysis, John Wiley & Sons, New York, NY, USA, 2nd edition,
1984.
[26] S. Aburatani, K. Goto, S. Saito, et al., “ASIAN: a website for
network inference,” Bioinformatics, vol. 20, no. 16, pp. 2853–
2856, 2004.
[27] S. Aburatani, K. Goto, S. Saito, H. Toh, and K. Horimoto,
“ASIAN: a web server for inferring a regulatory network
framework from gene expression profiles,” Nucleic Acids Re-
search, vol. 33, pp. W659–W664, 2005.
[28] M. Honda, S. Kaneko, H. Kawai, Y. Shirota, and K. Kobayashi,
“Differential gene expression between chronic hepatitis B and
Chepaticlesion,”Gastroenterology, vol. 120, no. 4, pp. 955–
966, 2001.
[29] T. Wu, “Cyclooxygenase-2 in hepatocellular carcinoma,” Can-
cer Treatment Reviews, vol. 32, no. 1, pp. 28–44, 2006.
[30] H. Xiao, V. Palhan, Y. Yang, and R. G. Roeder, “TIP30 has an
intrinsic kinase activity required for up-regulation of a subset
of apoptotic genes,” The EMBO Journal, vol. 19, no. 5, pp. 956–
963, 2000.
[31] W. B. Coleman, “Mechanisms of human hepatocarcinogene-
sis,” Current Molecular Medicine, vol. 3, no. 6, pp. 573–588,
2003.
[32] Y. Xu, P. K. Sengupta, E. Seto, and B. D. Smith, “Regulatory
factor for X-box family proteins differentially interact with hi-
stone deacety lases to repress collagen α2(I) gene (COL1A2) ex-
pression,” Journal of Biological Chemistry, vol. 281, no. 14, pp.
9260–9270, 2006.
[33] P. A. Barker and A . Salehi, “The MAGE proteins: emerging
roles in cell cycle progression, apoptosis, and neurogenetic dis-
ease,” Journal of Neuroscience Research, vol. 67, no. 6, pp. 705–
712, 2002.
[34] Y. Xu, L. Wang, G. Buttice, P. K. Sengupta, and B. D. Smith,
“Interferon γ repression of collagen (COL1A2) transcription
is mediated by the RFX5 complex,” The Journal of Biological
Chemistry, vol. 278, no. 49, pp. 49134–49144, 2003.
[35] F. Macian, C. Garcia-Rodriguez, and A. Rao, “Gene expression
elicited by NFAT in the presence or absence of cooperative re-
cruitment of Fos and Jun,” The EMBO Journal, vol. 19, no. 17,
pp. 4783–4795, 2000.
[36] J. Fu, S. S. W. Tay, E. A. Ling, and S. T. Dheen, “High glucose al-
ters the expression of genes involved in proliferation and cell-
fate specification of embryonic neural stem cells,” Diabetolo-
gia, vol. 49, no. 5, pp. 1027–1038, 2006.
[37] J. Sch
¨
afer and K. Strimmer, “An empirical Bayes approach to
inferring large-scale gene association networks,” Bioinformat-
ics, vol. 21, no. 6, pp. 754–764, 2005.
[38] A. de la Fuente, N. Bing, I. Hoeschele, and P. Mendes, “Dis-
covery of meaningful associations in genomic data using par-
tial correlation coefficients,” Bioinformatics, vol. 20, no. 18, pp.
3565–3574, 2004.