Báo cáo hóa học: " Research Article Bird Species Recognition Using Support Vector Machines" doc
Bạn đang xem bản rút gọn của tài liệu. Xem và tải ngay bản đầy đủ của tài liệu tại đây (804.78 KB, 8 trang )
Hindawi Publishing Corporation
EURASIP Journal on Advances in Signal Processing
Volume 2007, Article ID 38637, 8 pages
doi:10.1155/2007/38637
Research Article
Bird Species Recognition Using Support Vector Machines
Seppo Fagerlund
Laboratory of Acoustics and Audio Signal Processing, Helsinki University of Technology, P.O. Box 3000, 02015 TKK , Finland
Received 13 November 2006; Revised 20 February 2007; Accepted 31 March 2007
Recommended by Satya Dharanipragada
Automatic identification of bird species by their vocalization is studied in this paper. Bird sounds are represented with two different
parametric representations: (i) the mel-cepstrum parameters and (ii) a set of low-level signal parameters, both of which have
been found useful for bird species recognition. Recognition is performed in a decision tree with support vector machine (SVM)
classifiers at each node that perform classification between two species. Recognition is tested with two sets of bird species whose
recognition has been previously tested with alternative methods. Recognition results with the proposed method suggest better or
equal performance when compared to existing reference methods.
Copyright © 2007 Seppo Fagerlund. This is an open access article distr ibuted under the Creative Commons Attribution License,
which permits unrestricted use, distribution, and reproduction in any medium, provided the original work is properly cited.
1. INTRODUCTION
Interest towards automatic recognition of bird species based
on their vocalization has increased and many recent stud-
ies have been published [1–5]. Bird species identification is a
typical pattern recognition problem and most studies include
signal preprocessing feature extract ion and classification sec-
tions. Bird vocalization segmentation into smaller recogni-
tion units is per formed by hand or automatically. The num-
ber of species has ranged between 2 and 16 in previous stud-
ies.
The works of Anderson et al. [6] and Kogan and Mar-
goliash [7] were among the first attempts to recognize bird
species automatically by their sounds. They applied dynamic
time warping and hidden Markov models for automatic song
recognition of Zebra Finche (Taeniopygia guttata)andIn-
digo Punting (Passerina cyanea). In these studies, syllables
were represented by spectrograms and classification was per-
formed by matching the spectrograms to predefined proto-
types. Comparison of spectrograms is computationally de-
manding, and in the case of field recordings, they often also
include environmental information that is not relevant to
recognition of bird species.
Neural network classifiers were used in [1, 8]. Mcllraith
and Card [8] tested recognition of songs of six species com-
mon to Manitoba, Canada. In this work, songs were repre-
sented by spectral and temporal parameters. The dimension-
ality of the feature space was reduced by selecting features
for classification by means of their discriminative ability.
Selouani et al. [1] improved the neural network approach by
adding a feedback loop to the multilayer perceptron (MLP)
network. They tested classification of sixteen Canadian bird
species, whose manually extracted syllables were represented
by linear prediction coefficients. Similar to SVM classifiers,
the training of artificial neural networks is computationally
demanding, but the classification phase is relatively fast for
both methods.
Kwan et al. [2] used Gaussian mixture models (GMM)
to classify 11 bird species. Bird sounds were represented with
mel-frequency cepstral coefficients (MFCC). Kwan et al. also
introduced a system for automatic monitoring of birds in
field conditions. Tyagi et al. [4] introduced a new repre-
sentation for bird syllables which was based on the average
spectrum over time and classification was based on tem-
plate matching. Tyagi et al. introduced four reference recog-
nition systems that were based on dynamic time warping and
GMM with three different feature representations. Different
approaches to bird species recognition were introduced in
the work of Vilches et al. [3]. They used data mining tech-
niques for classification and analyses were performed on a
pulse-by-pulse basis in contrast to tra ditional syllable-based
systems.
This work was performed within the AveSound project
[9].Theobjectiveofthisresearchistodevelopafullyauto-
matic system for bird species recognition from their sounds
made in field conditions. The system is based on the recog-
nition of syllables that are the building blocks of bird songs
and calls [10]. In [11] bird vocalization was modeled using
2 EURASIP Journal on Advances in Signal Processing
only one sinusoid while in [12] the harmonic structure was
incorporated into the model. In [13] recognition was based
on the comparison of syllable histograms. Previous works
have studied only birds whose vocalization is mostly tonal
or har monic. However, many birds produce also inharmonic
or noise-like sounds [14]. In [15] recognition of species that
produce regularly inharmonic sounds were studied. Selin et
al. [16] studied species that produce tonal, harmonic, and
inharmonic sounds. Different parametric representations of
bird syllables were studied in [17]. The main emphasis and
focus of this article is in applying support vector machine
classifiers to the recognition of bird species and to com-
pare its performance to alternative pattern recognition tools
already tested within the AveSound project. Fundamental
parts of the recognition system are also revised in this arti-
cle. Recognition was tested using two different datasets pre-
viously used in the AveSound project.
This article is organized as follows. Categories of bird vo-
calization are introduced in Section 2. Also, a method for
segmentation of bird sounds into basic elements of the recog-
nition system is introduced. Section 3 describes parametric
representations of bird vocalization while Section 4 intro-
duces the support vector machine classification method and
system used for classification in this work. Recognition re-
sults with bird data are presented and compared to previous
work in Section 5. Final ly, Section 6 concludes the work.
2. SEGMENTATION OF BIRD SOUNDS
Bird sounds are typically divided into categories of songs
and calls depending upon their function. Generally, songs are
longer and more complex than calls and occur more sponta-
neously. The main function of songs is related to breeding
and territorial defense. Many bird species sing only during
the breeding season and is generally further limited to males
only. Call sounds are typically short vocalizations that carry
a function, for example, an alarm, flight, or feeding . Distin-
guishing between songs and calls can sometimes be ambigu-
ous and hence the separation of bird sounds into these cate-
gories is not studied in this work.
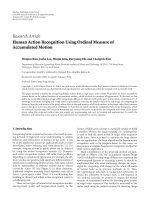
Bird sounds can also be divided into hierarchical levels of
phrases, syllables, and elements [10]. For example, the lev-
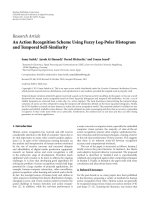
els of a typical song from the Common Chaffinch (Fringilla
coelebs) are illustrated in Figure 1. A phrase is a series of syl-
lables that occurs in a part icular pattern. Usually syllables in
a phrase are similar to each other, but sometimes they can
also be different as in the last frame of the song presented
in Figure 1. Syllables are constructed from elements but in
simple cases syllables and elements are one and the same.
However, complex syllables may be constructed from several
elements. Separation of elements in complex syllables is of-
ten difficult and can be ambiguous. Call sounds are usually
comprised of one syllable or a series of similar syllables and
the phrase level cannot be detected. The phrase level is com-
monly also missing in the songs of certain species. In this
work the syllable is regarded as the smallest unit of bird vo-
calization.
00.511.522.5
Time (s)
2
4
6
8
10
12
14
16
Frequency (kHz)
Phrases
Syllables Elements
Figure 1: Hierarchical levels of song for the common chaffinch.
(1) Find syllable candidates, that is, regions that are above
syllable threshold T
dB
.
(2) Update N
dB
from gaps between syllable candidates.
(3) Update the threshold, for example, T
dB
= N
dB
/2andreturn
to step 1.
Algorithm 1
The segmentation of a recording into individual syllables
is performed using an iterative time-domain algorithm [14].
First, a smooth energy envelope of the signal is computed on
the decibel scale and the maximum value is set to 0 dB. The
global minimum energy is chosen as the initial background
noise level estimate N
dB
. The initial threshold T
dB
is set to
half of the initial noise level, which is itself set to the lowest
signal envelope energy level. The noise and threshold levels
are updated using Algorithm 1 until convergence is obtained
indicating that the noise level is sufficiently stable.
Once the algorithm has converged, syllable candidates
that are very close to each other are grouped together in or-
der to prevent a border effect [18]. Also, temporally distinct
syllable elements that are detected separately are grouped to-
gether. In this work syllable, candidates that are less than 15
milliseconds apart of each other are joined together to be-
come one syllable.
3. FEATURE EXTRACTION OF SYLLABLES
The segmented syllable candidates are represented using
two different parametrization methods. The mel-cepstrum
model is a common parametrization method used frequently
in speech recognition. A second parametrization method
employs a set of descriptive signal parameters and is used
in many audio classification problems. Descriptive signal pa-
rameters include both temporal and spectral features. Both
Seppo Fagerlund 3
parametrization methods are presented in the following sec-
tion in more detail.
3.1. Mel-frequency cepstral coefficients
Mel-frequency cepstral coefficients (MFCC) [19]havebeen
a popular signal representation method used in many audio
classification tasks, especially in automatic speech recogni-
tion (ASR). The basis for the MFCC mel-frequency scale is
derived from the human perceptual system. Perceptual sys-
tems of birds are not the same as in humans, but exhibit sim-
ilar characteristics. The calculation of MFCC parameters is
efficient and straightforward since they do not involve any
tuning parameters.
The calculation of MFCC parameters begins with the seg-
mentation of a signal into overlapping frames. The power
spectrum of each frame is transformed into the logarithmic
mel-frequency spectrum using a filterbank of 32 triangular
filters. The ith MFC-coefficient of each frame is calculated by
MFCC
i
=
K
k=1
X
k
cos
i
k −
1
2
π
K
,(1)
where X
k
is the logarithmic energy of the kth mel-spectrum
and K is the total number of bands. The discrete cosine trans-
form (DCT) in (1) decreases the dimensionality of the fea-
ture vector and decorrelates features as well. In this work a
256 (6 ms) sample frame size was used and adjacent frames
overlapped by 50%. Syllables were parameterized using the
first 12 MFC-coefficients and the energy term. Also, delta and
delta-delta coefficients were calculated to measure temporal
change in parameters and delta parameters.
3.2. Descriptive parameters
In many applications in the field of audio signal process-
ing, the specific signal model is unknown and the spectr al
charasteristics may be quite varied. This is typical especially
within the field of animal and natural sounds. In these ap-
plications it is common to use many descriptive measures
to parametrize sounds, that are derived from both the tem-
poral and spectral domains. In this paper syllables are rep-
resented with 11 low-level signal parameters. Seven features
are calculated on a frame-to-frame basis providing a short
time description of syllables. First, syllables are div ided into
overlapping frames of 256 samples with 50% overlap. Fea-
tures are then calculated for each frame and the mean and
variance values of the feature trajectories are used as the ac-
tual features of the recognition system. Therefore, we have 14
features calculated on a frame basis. Five more features are
calculated from the entire syllable duration thus increasing
the total number of descriptive parameters to 19. These pa-
rameters are listed in Table 1 . A detailed description of these
features is provided in [14].
Table 1: Descriptive parameters used in this work. An asterisk (∗)
in the last column indicates that the feature is calculated on a frame-
to-frame basis.
Feature Abbreviation Frame feature
Spectral features
Spectral centroid mSC, vSC ∗
Signal bandwidth mBW, vBW ∗
Spectral roll-off frequency mSRF, vSRF ∗
Spectral flux mSF, vSF ∗
Spectral flatness mSFM, vSFM ∗
Frequency range range1, range2
Temporal features
Zero crossing rate mZCR, vZCR ∗
Short time energy mEN, vEN ∗
Syllable temporal duration T
Modulation spectrum
MSm, MSf
4. SUPPORT VECTOR MACHINE (SVM)
CLASSIFICATION
Support vector machines and other kernel-based methods
have become a popular tool in many kinds of machine learn-
ing tasks. In audio processing, SVMs have been used, for
example, in phonetic segmentation [20], speech recognition
[21], and general audio classification [22]. One advantage of
SVMs is their accuracy and superior generalization proper-
ties they offer when compared to many other types of clas-
sifiers. SVMs are based on statistical learning theory and
structural risk minimization [23]. In the following section
a brief introduction to SVM classification operation is pre-
sented when applied to binary and multiclass cases as is done
in this work. For a more detailed tutorial covering support
vector machines, refer to [24].
4.1. Binary classification
Let x
i
∈
m
be a feature vector or a set of input variables
and let y
i
∈{+1, −1} be a corresponding class label, where
m is the dimension of the feature vector. In linearly separable
cases a separating hyperplane satisfies
y
i
w · x
i
+ b
≥
1, i = 1, , n,(2)
where the hyperplane is denoted by a vector of weights w
and a bias term b. The optimal separating hyperplane, when
classes have equal loss-functions, maximizes the margin be-
tween the hyperplane and the closest samples of classes. The
margin is given by
d(w, b)
= min
{x
i
,y
i
=1}
w · x
i
+ b
w
+min
{x
j
,y
j
=−1}
w · x
j
+ b
w
(3)
=
2
w
.
(4)
The optimal separating hyperplane can now be solved by
maximizing (4)subjectto(2). The solution can be found
4 EURASIP Journal on Advances in Signal Processing
using the method of Lagrange multipliers. T he objective is
now to minimize the Lagrangian
L
p
(w, b, α) =
1
2
w
2
−
l
i=1
α
i
y
i
w · x
i
+ b
+
l
i=1
α
i
,(5)
and requires that the partial derivatives of w and b be zero. In
(5), α
i
are nonneg a tive Lagrange multipliers. Partial deriva-
tives propagate to constraints w
=
i
α
i
y
i
x
i
and
i
α
i
y
i
= 0.
Substituting w into (5) gives the dual form
L
d
(w, b, α) =
l
i=1
α
i
−
1
2
l
i, j=1
α
i
α
j
y
i
y
j
x
i
· x
j
,(6)
whichisnotanymoreanexplicitfunctionofw or b. T he op-
timal hyp erplane can be found by maximizing (6)subjectto
i
α
i
y
i
= 0 and all Lagrange multipliers are nonnegative.
However, in most real world situations classes are not lin-
early separable and it is not possible to find a linear hyper-
plane that would satisfy (2)foralli
= 1, , n. In these cases
a classification problem can be made linearly separable by us-
ing a nonlinear mapping into the feature space where classes
are linearly separable. The condition for perfect classification
can now be written as
y
i
w · Φ
x
i
+ b
≥ 1, i = 1, , n,(7)
where Φ is the mapping into the feature space. Note that the
feature mapping may change the dimension of the feature
vector. The problem now is how to find a suitable mapping
Φ to the space where classes are linearly separable. It turns
out that it is not required to know the mapping explicitly as
can be seen by writing (7) in the dual form
y
i
l
j=1
α
j
y
j
Φ
x
j
· Φ
x
i
+ b ≥ 1, i = 1, , n,
(8)
and replacing the inner product in (8) with a suitable kernel-
function K(x
j
, x
i
) =Φ(x
j
) · Φ(x
i
). This form arises from
the same procedure as was done in the linearly separable case,
that is, writing the Lagrangian of (7), solving partial deriva-
tives, and substituting them back into the Lagrangian. Using
a kernel trick, we can remove the explicit calculation of the
mapping Φ and need to only solve the Lagrangian (6)indual
form, where the inner product
x
i
· x
j
has been transposed
with the kernel function in nonlinearly separable cases. In the
solution of the Lagrangian, all data points with nonzero (and
nonnegative) Lagrange multipliers are called support vectors
(SV).
Often the hyperplane that separates the training data per-
fectly would be very complex and would not generalize well
to external data since data generally includes some noise and
outliers. Therefore, we should allow some violation in (2)
and (7). This is done with the nonnegative slack variable ζ
i
:
y
i
w · Φ
x
i
+ b
≥ 1 − ζ
i
, i = 1, , n. (9)
The slack variable is adjusted by the regularization constant
C, which determines the tradeoff between complexity and
the generalization properties of the classifier. This limits the
Lagrange multipliers in the dual objective function (6) to the
range 0
≤ α
i
≤ C.
Any function that is derived from mappings to the feature
space satisfies the conditions for the kernel function. How-
ever, this approach requires the design of a suitable feature
map and it also restricts the number of possible kernel func-
tions. A more common approach is to find functions that
fulfill the characterization of a kernel function. A symmetric
function in the input space is a kernel function if a kernel
matrix K
= [K(x
j
, x
i
)]
n
i, j
=1
is positive semidefinite, that is, its
eigenvalues are nonnegative. Probably the most commonly
used kernel function is the Gaussian
K
x
j
, x
i
=
exp
−
x
j
− x
i
2
2σ
2
. (10)
The Gaussian kernel function is translation invariant and
it gener alizes well for different shape classes in the feature
space. Also, the Gaussian kernel has only one tuning param-
eter σ which adjusts the kernel’s width.
4.2. Multiclass classification
The above discussion only covers the binary classification
case, which is insufficient for our situation. There are sev-
eral ways to construct SVM classifiers for more than two
classes. Methods can be divided into submethods that use
only one decision function, or into methods that solve many
binary problems, the latter being more common. Further-
more, methods comprising multiple binary classifiers can be
constructed in many ways. In [25] a good rev iew of different
methods is presented.
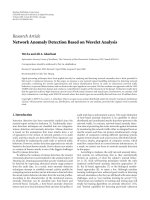
In this work, we use a binary decision tree that consists
of binary SVM classifiers at each node [26]. Each classifier
performs classification between two classes ignoring all other
classes. At each layer of the decision tree one class is rejected.
Finally, at the bottom, the last remaining class is considered
as the winning class. Figure 2 indicates the topology of the
SVM decision tree classifier for the species listed in table 2.
Using the standard method, the classifiers in the nodes
of the decision t ree have identical model parameters. How-
ever, this may lead to a nonoptimal binary classifier for some
nodes, especially when the classes are not equally spaced in
the feature space, as is the case with this problem. In this pa-
per, customized classifiers for each node of the decision tree
are used. Each node contains a binary SVM classifier with a
Gaussian kernel function where the regularization constant
and w idth of the Gaussian kernel are different for each clas-
sifier.
4.3. Training SVMs
Construction of SVM classifiers includes two phases. The
first phase requires finding optimal model parameters, that
is, the regularization constant C and the width of the Gaus-
sian kernel σ. Actual training of the classifier is performed
Seppo Fagerlund 5
ACRRIS ACRSCH GARGLA PICPIC CORNIX CORRAX
ACRSCH
ACRRIS
GARGLA
ACRSCH
PICPIC
GARGLA
CORNIX
PICPIC
CORRAX
CORNIX
GARGLA
ACRRIS
PICPIC
ACRSCH
CORNIX
GARGLA
CORRAX
PICPIC
PICPIC
ACRRIS
CORNIX
ACRSCH
CORRAX
GARGLA
CORNIX
ACRRIS
CORRAX
ACRSCH
CORRAX
ACRRIS
Figure 2: Topology of the decision tree classifier.
during the second phase. These two phases are repeated sep-
arately for each pair of classes in the decision tree.
N-fold cross validation is used to find the optimal values
for the model parameters. In this work, N depends on the
number of individuals within species for dataset 1 (Table 2).
For all pairs of classes in the decision tree, the data points
are divided into the training and test subsets such that the
test subset contains all data vectors from one individual. T he
training subset is used to construct an SVM classifier and its
performance is evaluated with a test subset. The classifica-
tion error is the average of the test errors of the subsets. For
dataset 2 (Tab le 3) a 10-fold cross validation in training data
was used to select optimal model parameters. The validation
procedure is repeated for a grid of parameter values C and
σ. Parameters that produce the lowest classification error are
selected as the final model par ameters. Limits for the para m-
eter values are chosen such that they contain extreme values
at all ends of the scale and the resolution of values is suitable.
Actual t raining of SVM classifiers is performed using the
sequential minimal optimization (SMO) algorithm [27]. The
MATLAB support vector machine toolbox [28] implemen-
tation of the SMO algorithm was used to train individual
SVM classifiers. The SMO algorithm decomposes the orig-
inal large-scale optimization problem into several smaller
problems that can be solved analytically. The SMO algorithm
solves the Lagrangian for two vectors at each iteration. The
vectors are selected from the set of vectors that violates the
optimality condition.
Table 2: 1st set of bird species used for recognition in this work.
The last column indicates the total number of syllables.
Lat. Abbr. Common name Individuals Syllables
CORRAX Common Raven 7 91
CORNIX
Hooded Crow 8 160
PICPIC
Magpie 7 312
GARGLA
Eurasian Jay 9 99
ACRSCH
Sedge Warbler 6 331
ACRRIS
Marsh Warbler 8 277
Table 3: 2nd set of bird species studied in this work. The last two
columns indicate the number of syllables in training and testing
datasets, respectively.
Lat. Abbr. Common name Syllables train Syllables test
ANAPLA Mallard 138 60
ANSANS
Greylag Goose 135 59
COTCOT
Quail 190 83
CRECRE
Corncrake 443 110
GLAPAS
Pygmy Owl 113 48
LOCFLU
River Warbler 890 328
PICPIC
Magpie 203 97
PORPOR
Spotted Crake 166 69
6 EURASIP Journal on Advances in Signal Processing
Table 4: Recognition results for datasets 1 and 2 (upper and lower panel, resp.). Values indicate the percentage of correctly classified syllables
for each species using different parametric representations.
species comp MFCC MFCC Δ MFCC ΔΔ mixture reference
CORRAX 89 95 89 92 95 92
CORNIX
76 87 84 88 89 66
PICPIC
85 82 84 87 91 63
GARGLA
89 83 84 81 92 80
ACRSCH
64 73 85 82 86 57
ACRRIS
75 88 92 90 92 86
overall
79 85 88 87 91 74
species comp MFCC MFCC Δ MFCC ΔΔ mixture reference
ANAPLA 93 98 98 98 100 98
ANSANS
76 75 90 90 85 83
COTCOT
100 96 96 96 100 100
CRECRE
100 100 100 100 99 96
GLAPAS
75 100 100 100 90 96
LOCFLU
100 100 100 100 100 100
PICPIC
98 87 87 87 96 94
PORPOR
100 100 100 100 100 100
overall
96 96 97 97 98 96
5. RESULTS
Recognition performance was tested with datasets used in
[15, 16]. Species in dataset 1 are listed in Ta ble 2. Recognition
was tested separately for each individual by arranging the test
so that syllables in the testing dataset were not used during
the training phase. The recognition results indicate the per-
centage of correctly classified syllables. Information regard-
ing dataset 2 is described in Ta ble 3. In this dataset, manually
segmented syllables were distributed into training and testing
subsets. Syllables from single individuals were par t of either
datasets but not both, thus recognition was also individually
independent for the second dataset.
Recognition results for dataset 1 (Tabl e 2) are shown in
the upper panel in Table 4. Columns indicate recognition
results with a different parametric representation. A mix-
ture model includes all MFC-coefficients (including delta
and delta-delta coefficients) as well as descriptive param-
eters. The reference produces the best recognition perfor-
mance as obtained in [15], where MFCC parameters were
used for syllable representation and nearest-neighbor clas-
sification with the Mahalanobis distance measure used for
recognition. The best recognition results were obtained us-
ing a mixture model, but the feature vector dimension was
also the highest with this representation.
Results for dataset 2 are shown in the lower panel of
Table 4. The reference results are from [16] where sylla-
bles were represented with four parameters derived from a
wavelet decomposed signal representation and where neu-
ral networks were used for classification. Results show only
a slight difference in performance between different para-
metric representations. Compared to the reference method,
the SVM classifier performs equally well when compared to
other par ametric representations. Also, in this dataset the
best overall recognition result was obtained with a mixture
model.
6. CONCLUSIONS
In this paper, support vector machine classification methods
were applied to automatic recognition of bird species. Recog-
nition was tested w ith two datasets previously used in this
project in order to obtain references for the new methods.
Results suggest that equal or better performance, compared
to the reference methods, was achieved. However, recogni-
tion results for two datasets cannot be directly compared
since dataset 2 includes more species with a larger spectrum
of different sounds than dataset 1. Species in the dataset 1
are also more closely related when compared to the species
in dataset 2.
In the proposed method the decision tree topology is in-
variant to the ordering of the species (classes) and the same
result would have been arrived at by changing the order-
ing of the species in the tree. This topology is efficient and
straightforward to construct and it does not require any addi-
tional information regarding the relations between different
species. However, a hierarchical topology that utilizes the re-
lationships of the sound between different species could lead
to a more robust and computationally efficient classifier.
In the proposed method all syllables a re represented with
the same parameters. However, the decision tree topology
in the classifier enables the use of weighting of features in
each subproblem separately. For example, when weighting is
not used, in dataset 2 the recognition results for the Pygmy
Owl (GLAPAS) (lower panel in Tabl e 4, row 5) using the de-
scriptive parameter model is 75% while using MFCC-models
Seppo Fagerlund 7
100% accuracy is achieved. The method thus produces a
lower recognition result (90%) in the mixture model when
compared to the MFCC-models. Future work will investigate
the use of feature weighting, for example, its use would have
produced 100% accuracy in the case of the mixture model.
ACKNOWLEDGMENT
This work is supported by the Academy of Finland under re-
search Grant 206652 (The AveSound project).
REFERENCES
[1] S A. Selouani, M. Kardouchi, E. Hervet, and D. Roy, “Au-
tomatic birdsong recognition based on autoregressive time-
delayneuralnetworks,”inCongress on Computational Intelli-
gence Methods and Applications (CIMA ’05), pp. 1–6, Istanbul,
Turkey, December 2005.
[2] C. Kwan, K. C. Ho, G. Mei, et al., “An automated acoustic sys-
tem to monitor and classify birds,” EURASIP Journal on Ap-
plied Signal Processing, vol. 2006, Article ID 96706, 19 pages,
2006.
[3] E.Vilches,I.A.Escobar,E.E.Vallejo,andC.E.Taylor,“Data
mining applied to acoustic bird species recognition,” in Pro -
ceedings of the 18th International Conference on Pattern Recog-
nition (ICPR ’06), vol. 3, pp. 400–403, Hong Kong, August
2006.
[4] H.Tyagi,R.M.Hegde,H.A.Murthy,andA.Prabhakar,“Au-
tomatic identification of bird calls using spectral ensemble av-
erage voiceprints,” in Proceedings of the 13th European Signal
Processing Conference (EUSIPCO ’06), Florence, Italy, Septem-
ber 2006.
[5]E.J.S.Fox,J.D.Roberts,andM.Bennamoun,“Text-
independent speaker identification in birds,” in Proceedings of
the 9th International Conference on Spoken Language Processing
(ICSLP ’06), Pittsburgh, Pa, USA, September 2006.
[6] S. E. Anderson, A. S. Dave, and D. Margoliash, “Template-
based automatic recognition of birdsong syllables from con-
tinuous recordings,” The Journal of the Acoustical Society of
America, vol. 100, no. 2, pp. 1209–1219, 1996.
[7] J. A. Kogan and D. Margoliash, “Automated recognition of
bird song elements from continuous recordings using dy-
namic time warping and hidden Markov models: a compar-
ative study,” The Journal of the Acoustical Society of America,
vol. 103, no. 4, pp. 2185–2196, 1998.
[8] A. L. Mcllraith and H. C. Card, “Birdsong recognition us-
ing backpropagation and multivariate statistics,” IEEE Trans-
actions on Signal Processing, vol. 45, no. 11, pp. 2740–2748,
1997.
[9] S. Fagerlund, “Avesound project web-site,” 2006, http://www
.acoustics.hut.fi/research/avesound/avesound.html.
[10] C.K.CatchpoleandP.J.B.Slater,Bird Song: Biological Themes
and Variat ions , Cambridge University Press, Cambridge, UK,
1995.
[11] A. H
¨
arm
¨
a, “Automatic identification of bird species based on
sinusoidal modelling of syllables,” in Proceedings of IEEE Inter-
national Conference on Acoustics, Speech, and Signal Processing
(ICASSP ’03), vol. 5, pp. 545–548, Hong Kong, April 2003.
[12] A. H
¨
arm
¨
a and P. Somervuo, “Classification of the harmonic
structure in bird vocalization,” in Proceedings of IEEE Inter-
national Conference on Acoustics, Speech, and Signal Process-
ing (ICASSP ’04), vol. 5, pp. 701–704, Montreal, Canada, May
2004.
[13] P. Somervuo and A. H
¨
arm
¨
a, “Bird song recognition based
on syllable pair histograms,” in Proceedings of IEEE Interna-
tional Conference on Acoustics, Speech, and Signal Processing
(ICASSP ’04), vol. 5, pp. 825–828, Montreal, Canada, May
2004.
[14] S. Fagerlund, “Automatic recognition of bird species by their
sounds,” M.S. thesis, Helsinki University of Technology, Es-
poo, Finland, 2004.
[15] S. Fagerlund and A. H
¨
arm
¨
a, “Parametrization of inharmonic
bird sounds for automatic recognition,” in Proceedings of the
13th European Signal Processing Conference (EUSIPCO ’05),
Antalya, Turkey, September 2005.
[16] A. Selin, J. Turunen, and J. T. Tanttu, “Wavelets in recognition
of bird sounds,” EURASIP Journal on Advances in Signal Pro-
cessing, vol. 2007, Article ID 51806, 9 pages, 2007.
[17] P. Somervuo, A. H
¨
arm
¨
a, and S. Fagerlund, “Parametric repre-
sentations of bird sounds for automatic species recognition,”
IEEE Transactions on Audio, Speech and Language Processing,
vol. 14, no. 6, pp. 2252–2263, 2006.
[18] D. Li, I. K. Sethi, N. Dimitrova, and T. McGee, “Classifica-
tion of general audio data for content-based retrieval,” Pattern
Recognition Letters, vol. 22, no. 5, pp. 533–544, 2001.
[19] S. B. Davis and P. Mermelstein, “Comparison of paramet-
ric representations for monosyllabic word recognition in con-
tinuously spoken sentences,” IEEE Transactions on Acoustics,
Speech, and Signal Processing, vol. 28, no. 4, pp. 357–366, 1980.
[20] A. Juneja and C. Espy-Wilson, “Speech segmentation using
probabilistic phonetic feature hierarchy and support vector
machines,” in Proceedings of the International Joint Conference
on Neural Networks (IJCNN ’03), vol. 1, pp. 675–679, Portland,
Ore, USA, July 2003.
[21] A. Ganapathiraju, J. E. Hamaker, and J. Picone, “Applica-
tions of support vector machines to speech recognition,” IEEE
Transactions on Signal Processing, vol. 52, no. 8, pp. 2348–2355,
2004.
[22] C C. Lin, S H. Chen, T K. Truong, and Y. Chang, “Audio
classification and categorization based on wavelets and sup-
port vector machine,” IEEE Transactions on Speech and Audio
Processing, vol. 13, no. 5, part 1, pp. 644–651, 2005.
[23] V. Vapnik, Statistical Learning Theory, John Wiley & Sons, New
York, NY, USA, 1998.
[24] C. J. C. Burges, “A tutorial on support vector machines for
pattern recognition,” Data Mining and Knowledge Discovery,
vol. 2, no. 2, pp. 121–167, 1998.
[25] F. Schwenker, “Hierarchical support vector machines for
multi-class pattern recognition,” in Proceedings of the 4th In-
ternat ional Conference on Knowledge-Based Intellingent Engi-
neering Systems and Allied Technologies (KES ’00), vol. 2, pp.
561–565, Brighton, UK, August-September 2000.
[26] J. C. Platt, N. Cristianini, and J. Shawe-Taylor, “Large margin
dags for multiclass classification,” in Advances in Neural Infor-
mation Processing Systems 12, pp. 547–553, MIT Press, Cam-
bridge, Mass, USA, 2000.
[27] J. C. Platt, “Fast training of support vector machines using se-
quential minimal optimization,” in Advances in Kernel Meth-
ods - Support Vector Learning,B.Scholkopf,C.Burges,andA.J.
Smola, Eds., chapter 12, pp. 185–208, MIT Press, Cambridge,
Mass, USA, 1999.
[28] G. C. Cawley, “MATLAB support vector machine tool-
box (v0.55β),” School of Information Systems, University
of East Anglia, Norwich, Norfolk, UK. NR4 7TJ, 2000,
/>∼gcc/svm/toolbox/.
8 EURASIP Journal on Advances in Signal Processing
Seppo Fagerlund was born in Pori, Finland,
in 1978. He received the M.S. degree in elec-
trical engineering from the Helsinki Univer-
sity of Technology (TKK), Espoo, Finland,
in 2004. In 2002, he worked as a Research
Assistant i n Nokia Research Center. In 2004,
he became a Research Assistant and in 2005
a Researcher at the Laboratory of Acoustics
and Audio Signal Processing, Helsinki Uni-
versity of Technology (TKK). His research
intrests include signal processing of bioacoustic signals and pattern
recognition.